In this section
1. Introduction
A high-quality address register is at the heart of the census. In 2021, when the next census will be conducted predominantly online, an address register will be essential for posting out invitations to take part in the census or questionnaires, managing data collection and providing a framework for statistical estimation and the resulting outputs.
Knowing more about addresses, including unusual types of addresses such as caravan homes, may help deliver more efficient field operations, high-quality statistics and a reduced burden on the public. This is because it is essential to know the location of all properties where people live to ensure that responses are collected from all residents of the country. Data from property website Zoopla could be used to improve the coverage of the address register, maximising the response to the 2021 Census. This in turn ensures that census statistics provide accurate and comprehensive information that is capable of meeting users’ requirements.
Zoopla is one of the most popular websites in the UK to search for properties for sale or for rent. Unlike rival websites such as Rightmove, Zoopla has an application programming interface (API), which allows those with some programming skills to obtain data for free about properties listed for sale or for rent, including the property description, price and location. Coverage of these websites is not universal because not all properties for sale or for rent are listed on them. However, it is thought that most properties are listed.
We have collected a freely available sample of data from the Zoopla API and developed methods that automatically identify those properties that are likely to be caravan homes with good accuracy, using machine learning and text analysis. Knowing the location of caravan homes is useful to the address register and therefore to the success of the 2021 Census. The data collected from Zoopla is being used for research and statistical purposes only and this paper provides a first evaluation of using this type of data to locate caravan homes. If successful, this research could be extended to examine whether the caravan homes are residential or holiday homes. However, to do this, the caravan homes must first be identified as such. Other sources of data, such as satellite imagery, could also be used for this purpose.
Back to table of contents2. Data collection
Property websites such as Rightmove, Zoopla, OnTheMarket and PrimeLocation are the most popular way to search for property for sale or for rent in the UK. These websites contain a wealth of information about those properties listed, including price, property description, number of bedrooms and bathrooms, and location.
We first considered obtaining data from property websites for research by web scraping, which involves setting up an automated program to extract information from websites. Many websites prohibit the use of web scraping, including all four of the websites mentioned in this section. However, Zoopla does provide an application programming interface (API) that can be used to obtain information about the properties listed on its website. This data is freely available and Zoopla emphasises in its developer documentation that it does this to “make property information more transparent and available to all”.
Data can be obtained by writing some programming code to make a call to the API to ask for specific information about properties to be returned. We wrote Python code to obtain data on properties for sale or for rent in a sample of areas and made sure that this was acceptable and appropriate to Zoopla’s terms and conditions. In total, data from 36,146 property listings were returned. The data were collected on a series of days in August and September 2015.
We are committed to making as much code openly available as possible. The code used to extract property data from the Zoopla API and the machine learning code used in this report (both written in Python) are available on GitHub.
Limitations of the Zoopla API
As with any API, there are limitations in the use of the Zoopla API, including:
- an API key is required to access the API, which is provided free of charge
- a maximum of 100 property listings can be obtained with each call to the API and a maximum of 100 calls can be made to the API each hour; this yields a maximum of 10,000 properties per hour out of over 600,000 properties for sale or rent on the website
- as a result of the limitation on the number of properties, research focused on the PO, SO, TR and NR postcode areas; these are coastal areas that are often considered holiday areas, so it was thought that they might contain a high number of caravan homes
A sample of data for one property from the API, as well as other data derived after initial data collection, is illustrated in the Appendix (section 7.3).
Back to table of contents3. Address register
A high-quality address list is at the heart of the census. In 2021, when the next census will be conducted predominantly online, an address register will be essential for delivering internet access codes to addresses by post, managing data collection and providing a framework for estimation. It is also used to produce the output statistics that rely heavily on geographical references linked to addresses.
Given the importance of the address register to the 2021 Census, research is already underway to investigate options for developing a register including all residential and communal addresses1 in England and Wales. A distinction needs to be made between residential addresses and different types of communal addresses, including unusual properties such as house boats and caravan homes. This is so that census collectors are better equipped to deal with such unusual cases, making census follow up more efficient and reducing costs.
Caravan homes are important because, while they comprise less than 0.5% of all households, they are recorded either inconsistently or not at all in different data sources. The Field Operations Report from the Census in 2011 stated:
“Enumeration of caravan parks, holiday sites and other leisure parks often proved difficult. Many caravan unit addresses were duplicated on both the residential and communal establishment address lists. There were also issues with residential sites that had not been identified as such, and with other sites exclusively for holiday makers that had been included. Special enumerators spent a lot of time trying to establish the facts and taking remedial action to rectify this.”
It is also worthwhile to note that caravan homes can often be found in caravan parks and that these are often clustered in holiday and coastal areas such as north Wales, Cornwall and Essex. Because of this clustering, the risk of error due to miscounting caravan homes is compounded in certain local authorities.
This paper describes how caravan homes may be identified in geo-located Zoopla data.
Notes for: Address register
- A communal establishment is an establishment providing managed residential accommodation, where “managed” in this context means full-time or part-time supervision of the accommodation. It includes sheltered housing, hotels, guest houses, bed and breakfast accommodation, and accommodation for students during term-time.
4. Analysis
4.1. Data preparation
Section 7.2 in the Appendix lists the features, or variables, collected in the data, as well as some features that were derived after data collection. This includes the location of the property, its price and description, the number of bedrooms it contains and its property type (amongst other features). Most notably, the latitude and longitude of the property, as extracted from the Zoopla application programming interface (API), were matched to the nearest address using AddressBase and other geographical features were added, such as the local authority in which the property lies. AddressBase is a product that combines address and location information from various different sources, including from Ordnance Survey, Royal Mail and others.
Each property in the sample dataset was manually classified as either being a caravan home or not. This is because data about the “truth” of the property is required for the machine learning procedures to be effective. As it would have taken a substantial amount of time to examine each row of the dataset (n equals 36,146) to determine whether each was a caravan home or not, the classification process was improved by searching for properties labelled as “mobile and/or park home” and noting important phrases used in the property description. These important phrases included “holiday park”, “park home” and “caravan home” amongst others.
Not all caravan homes are labelled as “mobile and/or park home”. Some are labelled “detached”, “bungalow” or “chalet” but clearly not all properties labelled as such are caravan homes. Therefore properties labelled as “mobile and/or park home” or containing one of the previously mentioned phrases were examined to manually confirm whether they were caravan homes or not. All other properties were assumed to not be caravan homes; this left 523 properties (or 1.4%) labelled as caravan homes.
4.2. Explanation of machine learning techniques used
Once labelled, various machine learning methods were employed to automatically identify caravan homes from the data and to evaluate different approaches using the manually classified data as “truth”. The ultimate aim would be to use the most successful approach to classify data for the whole country.
This section provides an explanation of the techniques used.
Logistic regression
Logistic regression is a standard statistical model where the dependent feature is binary, such as a property being a caravan home or not. It is used to estimate the probability of a binary response based on one or more independent features, which must be normally distributed and not a linear combination of each other. The log odds of the binary outcome is modelled as a linear combination of the features. It is also used to understand which among the independent features are useful for predicting the dependent feature, and is used to explore the strength of these relationships. Since logistic regression is based on statistical theory, it is possible to measure the quality of the estimates produced using standard statistical techniques such as confidence intervals.
Decision trees
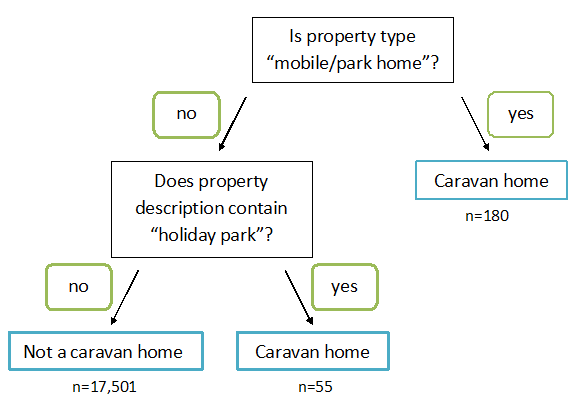
Decision tree learning uses a decision tree as a predictive model that maps observations about an item to conclusions about the item's target value. Decision trees are tree-like charts or diagrams used to represent a decision. You start with the decision to be made and represent this with a box. Then branches are drawn, one for each possible option. At the end of the branch will be another decision to be made, an uncertainty, or a result.
The decision tree used in this research is based on the CART (classification and regression tree) algorithm. It is formed by a collection of rules based on features in the training data:
- rules based on features’ values are selected to get the best split to differentiate observations based on the dependent feature
- once a rule is selected and splits into two, the same process is applied to each "child" (that is, it is a recursive procedure)
- splitting stops when CART detects that no further gain can be made, or some pre-set stopping rules are met
Decision trees are simple to understand and visualise, do not require input data to be normally distributed and can be used with numerical or categorical data.
However, decision trees are prone to over-fitting on training datasets and can be unstable because small variations in the data might result in a completely different tree being generated. More information about decision trees and their advantages and disadvantages is available.
A simple decision tree is visualised in Figure 1.
Figure 1: Example of a decision tree
Source: Office for National Statistics
Download this image Figure 1: Example of a decision tree
.png (11.1 kB)
Random forests
Decision trees can over-fit to their training data, making them worse when performing on unseen data. Random forests are an ensemble method of decision trees, which operate by constructing a multitude of decision trees and outputting the class that is the mode of the classes of the individual trees.
In our example, some of the trees may have been grown from samples that said property type was the more important feature, rather than the number of bedrooms or price. Other trees may find completely different features to be relevant. Using random forests means that the errors from many trees will cancel out when aggregated and lead to a more accurate prediction.
The main limitation of the random forests algorithm is that a large number of trees may make the algorithm slow for big datasets.
Support vector machines (SVM)
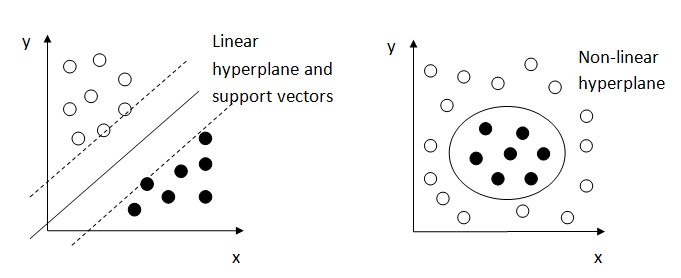
Given a set of training examples, each marked for belonging to one of two categories such as a caravan home or not a caravan home, a support vector machine builds a model that assigns new examples into one category or the other.
A support vector machine model is a representation of the training examples as points in space, mapped so that they form separate categories divided by a clear gap that is as wide as possible. Examples of points and linear and non-linear hyperplanes separating the two categories are illustrated in Figure 2. A good separation is achieved by the hyperplane that has the largest distance to the nearest data point of any class. The dashed lines on the first example are called the support vectors.
Figure 2: Example data with hyperplanes
Source: Office for National Statistics
Download this image Figure 2: Example data with hyperplanes
.png (15.8 kB)
Support vector machines are effective in high-dimensional spaces and are still useful in cases where the number of dimensions is greater than the number of samples.
One main disadvantage of support vector machines is that, as the accuracy of the method is highly dependent upon the hyperparameters chosen, a grid search needs to be performed to choose optimum hyperparameters. This grid search can be time-consuming, particularly when datasets are large. In our example, the grid search took 8 minutes. In addition, support vector machines do not directly provide probability estimates.
More information about support vector machines and their advantages, disadvantages and mathematical formulation is available.
4.3. Measures for evaluating the methods
F1 score
The F1 score is a measure that evaluates the accuracy of a given method. To visualise the performance of each classification method, a two-way table known as a confusion matrix can be set up to contrast the actual and predicted counts of caravan homes and non-caravan homes. In doing so, we are comparing the manually classified data (assumed to be the “truth”) with the results of the algorithms to assess each algorithm’s performance.
Table 1 shows the general form of a confusion matrix.
Table 1: Example of a confusion matrix
| Actual (by eye) | |||
| Caravan home | Other property | ||
| Prediction | Caravan home | True positive | False positive |
| Other property | False negative | True negative | |
| Source: Office for National Statistics | |||
Download this table Table 1: Example of a confusion matrix
.xls (26.6 kB)A number of different statistical measures can be obtained from the table to test for the performance of a classification method. The three of most interest are:
As the proportion of caravan homes in the data was very small, the classic accuracy measure is not advised. In our example, 98.6% of properties are not caravan homes, so simply predicting all properties as not being caravan homes would yield 98.6% accuracy. However, this would not be helpful.
The F1 score is more suited to unbalanced datasets as it is much more discerning of the small 1.4% class of caravan homes, allowing us to better identify the algorithms that are better at classifying properties. It can be interpreted as a weighted average of precision and recall:
An F1 score reaches its best value at 1 and worst at 0. More information is available.
Cross validation
Cross validation is a model validation technique that is used to assess how well a particular model will generalise to unseen data and how it will perform in practice. A model is usually given a dataset of known data on which different models are tested (a training dataset) and a method optimised. The final method chosen is then tested on a testing dataset, to assess how well it performs on unseen data. Cross validation is known to limit problems such as over-fitting and over-estimating the performance of the model chosen.
Cross validation can be employed at various stages of the modelling process, including:
- feature (variable) selection: as a selection criteria for the features that are best at predicting whether a property is a caravan home or not
- model selection: as a selection criteria between different estimation methods (for example, choosing between logistic regression and random forests)
- hyperparameter selection: as a selection criteria between different estimator assumptions (for example, choosing between a linear and non-linear kernel to use within a support vector machine or the smoothing parameter on a logistic regression)
- coefficient stability: it can be used to test the stability of the model coefficients, for example, when the model is run multiple times on different training and testing splits, checking whether the parameters or F1 score vary significantly
There are several methods of cross validation, with the most common being:
- randomly, but manually, splitting the data; for example, randomly assigning 70% of cases to a training dataset and the remaining 30% to a testing dataset
- using k-fold cross validation where the original sample is randomly partitioned into k equal-sized subsamples without replacement; of the k subsamples, a single subsample is retained as the validation data for testing the model and the remaining k−1 subsamples are used as training data; the cross validation process is then repeated k times (the folds), with each of the k subsamples used exactly once as the validation data and the k results from the folds can then be averaged (or combined) to produce a single estimation
- leave one out cross validation; this is the same as k-fold cross validation, in the particular case that k equals the number of observations in the dataset
- stratified cross validation (which can be k-fold), but which keeps a certain distribution (for different subpopulations); this is often used in unbalanced datasets such as in the Zoopla dataset where only 1.4% of properties are classed as caravan homes
Each of the above methods has advantages and disadvantages, including computational intensity, and the method used depends upon the task and dataset at hand. More information about cross validation, including methods, is available.
4.4. Determining the most accurate method for identifying caravan homes
All of the methods described in section 4.2 were combined to help determine the most accurate method for identifying caravan homes from the Zoopla data. The steps used are described in this section.
First of all, the property description was searched and new binary features created (1 if the phrase was found, 0 otherwise). The phrases were:
- holiday park
- holiday village
- chalet
- park home
- static home
- mobile home
- park lodge
- static caravan
The property type field provided by the Zoopla application programming interface (API) was separated into different binary features for each type. For example, if the property was classed as “detached”, the property would have 1 for the detached feature and 0 for all other property type features. This process is known as vectorising and allows categorical features, such as property types, to be reclassified as numerical features for use in statistical modelling and machine learning algorithms. The new features created were (with frequencies in brackets):
- barn conversion (243)
- bungalow (1,675)
- chalet (234)
- cottage (624)
- country house (18)
- detached bungalow (1,976)
- detached house (6,033)
- end terrace house (1,656)
- equestrian property (28)
- farm (4)
- farmhouse (31)
- flat (8,191)
- land (237)
- link-detached house (169)
- lodge (26)
- maisonette (423)
- mews house (54)
- mobile and/or park home (406)
- parking and/or garage (29)
- semi-detached bungalow (496)
- semi-detached house (4,326)
- studio (549)
- terraced bungalow (53)
- terraced house (4,849)
- town house (390)
- villa (14)
Most features in the data were binary (for example, whether the property description contained “holiday park”) or contained small values (such as the number of bedrooms at a property). However, the price feature contained large values and two distributions: one for those properties for sale and the other for those properties to rent. To avoid the price having an unnecessarily large impact on the algorithms (because of the large values), the distributions were separated and a z-score calculated for each value, depending on whether the property was for rent or sale.
The z-score has a mean 0 and standard deviation 1 and its formula is:
Where χ was the price of the individual property, μ was the mean price of all properties (either for rent or for sale) and σ was the standard deviation of the price of the properties (either for rent or for sale). Once z-scores were calculated separately for properties for sale and for rent, these distributions were combined together to create one feature for price.
Some features (such as the name of the estate agent, or county in which the property was located) were dropped, as it was felt that they would not enhance the predictability of the algorithm. Therefore, 37 features remained in the dataset, including those listed previously in this section, as well as:
- listing status (for sale or for rent)
- number of bedrooms
- price (after z-scoring had been applied)
The data was then split into 80% training and 20% testing datasets with 28,916 and 7,230 cases in each respectively. The 80% to 20% split was chosen because it is a common split to make. There were similar proportions of caravans in each dataset.
- On the training set, a 10-fold stratified cross validation was undertaken on each of the algorithms mentioned in this section. Ensuring that the stratification took place means that we were assured that a similar proportion of caravan homes were in each fold. The F1 score was used to test the accuracy of each algorithm.
All features were used in all algorithms. Decision trees and random forests identify the most important features as part of their algorithms and discard those features with the least predictive power. Recursive feature elimination (with five-fold cross validation) was used in logistic regression to identify those features with most predictive power. Recursive feature elimination works by taking all features, training the model on the initial set of features and assigning weights to each one of them. Then, features whose absolute weights are the smallest are pruned from the current set features.
That procedure is recursively repeated on the pruned set until the F1 score is maximised. For logistic regression, the mean F1 score using 37 features was 0.828. Using recursive feature elimination reduced the number of features to 3 and raised the mean F1 score to 0.867. It is not possible to use recursive feature elimination on a support vector machine algorithm when the kernel is non-linear.
Different hyperparameters were tested on the training set in order to maximise the F1 score for each algorithm.
Since the hyperparameters chosen in support vector machines are essential to the accuracy of the method, stratified three-fold cross validation via a grid search was used to identify the hyperparameters that would maximise the F1 score. A grid search exhaustively applies the support vector machine using a grid of possible values. The final values chosen for each hyperparameter were:
- cost equals 100
- gamma equals 0.1
- kernel equals radial basis function (which creates a non-linear hyperplane)
The features were explored to sense check that those suspected of having a greater importance did so in the algorithms. For example, whether the property description contained “park home” or whether the property type was “mobile and/or park home” were strong indicators that the property was a caravan home, whereas whether the property description contained the phrase “static caravan” was a weaker indicator. This may be because some larger properties were being sold with a static caravan on site or described as having sufficient space for a static caravan.
Table 2 shows the mean F1 score, precision and recall across the 10 folds using each algorithm noted previously. Precision is the proportion of properties that we identified as being caravans that actually are caravans, while recall is the proportion of properties that were actually caravans which were identified by us as such. It is useful to have a measure that represents both of these features and the F1 score can be interpreted as the weighted average of precision and recall, where an F1 score reaches its best value at 1 and worst score at 0.
Table 2: Mean F1 score, precision and recall using different algorithms
| Algorithm | Mean F1 score across ten folds | Mean precision | Mean recall |
|---|---|---|---|
| Logistic regression (37 features) | 0.828 +/- 0.009 | 0.715 | 0.986 |
| Logistic regression (3 features) | 0.867 +/- 0.008 | 0.815 | 0.927 |
| Decision tree | 0.863 +/- 0.017 | 0.799 | 0.948 |
| Random forests | 0.900 +/- 0.008 | 0.912 | 0.889 |
| Support vector machines | 0.903 +/- 0.010 | 0.896 | 0.913 |
| Source: Office for National Statistics | |||
Download this table Table 2: Mean F1 score, precision and recall using different algorithms
.xls (18.9 kB)Therefore, based on the F1 scores of each of the methods, it can be seen that support vector machines appears to be the most accurate method for identifying caravan homes in the Zoopla data. As a final check, this method was run on the 20% testing dataset identified at the start of the process (7,230 cases). An F1 score of 0.917 was achieved with the confusion matrix shown in Table 3.
Table 3: Confusion matrix comparing true and predicted caravan homes in testing dataset
| Predicted | ||
| True | Not a caravan home | Caravan home |
| Not a caravan home | 7,113 | 18 |
| Caravan home | 0 | 99 |
| Source: Office for National Statistics | ||
Download this table Table 3: Confusion matrix comparing true and predicted caravan homes in testing dataset
.xls (17.9 kB)4.5. Comparing the output against the address register
These data provide information about individual properties, but caravans are often clustered together into caravan sites (groups of caravan properties). There were 168 properties in Hampshire identified as caravan properties. However, there was some duplication with several properties for sale or for rent on the same caravan sites. Once these duplicates were removed, 51 caravan sites were identified using these data. These 51 sites were compared against a list of caravan sites in Hampshire (there was no similar list for the other areas) from the address register. Of these 51 sites:
- 34 were also in the address register
- of the remaining 17 sites, 11 sites were in the address register at a different but nearby postcode, illustrating that the exact latitude and longitude coordinate shown in Zoopla may not be accurate in all cases
- six sites (or 12% of all sites identified) were found in the Zoopla data, which were not in the address register; this illustrates that identifying caravan homes from Zoopla data adds previously unknown intelligence about the location of caravan homes to the address register
5. Next steps
It has been established that algorithms such as support vector machines are able to accurately identify caravan homes using data from the Zoopla application programming interface (API). To make better use of these data for the address register used in the census, the following could also be undertaken using the property description:
- establish which properties identified in Zoopla as non-caravan homes are classified as caravan homes in the address register
- classify caravan homes as either residential or holiday homes; distinguishing between the location of caravan homes where residents are expected to complete a census form and holiday homes where residents are not expected to be living would be useful for both sending out the correct number of internet access codes and for quality assuring census results
- identify gated communities where it may be difficult for interviewers or enumerators to access the front door of such properties
However, as previously stated, caravan homes constitute a small proportion of all properties for sale or for rent on housing websites. Therefore it is necessary to obtain a larger sample of data to more robustly evaluate the benefit of this approach. To test this, an experimental design could be used where two areas could be selected, with one area benefitting from the approaches previously discussed while the other area does not. This would allow us to quantify the benefit of this type of data to a larger field work operation.
Back to table of contents6. Conclusion
A high-quality address register will be essential to the success of the 2021 Census. In particular, knowing the location and characteristics of unusual properties such as caravan homes is required for sending out internet access codes and for following up households that have delayed in completing their forms.
Zoopla is one of the most popular websites in the UK for searching for property for rent or for sale and we have sourced data for about 36,000 properties from the Zoopla application programming interface (API). Text mining and machine learning were undertaken on the data to identify properties likely to be caravan homes. After data manipulation, it was found that support vector machines was the algorithm that most accurately identified caravan homes on unseen data. Even using this small sample of data, caravan parks were identified that had not been identified in other data sources, such as the address register.
The next steps for this research are to extend the machine learning and text analysis methods to classify caravan homes as either residential or holiday homes. In addition, a larger sample of data is required to more robustly test the methods and outcomes discussed in this working paper.
Back to table of contents7. Appendix
7.1. Source code
The ONS Big Data team is committed to making as much code openly available as possible. The code used to extract property data from the Zoopla application programming interface (API) and the machine learning code used in this report (both written in Python) are available on GitHub.
7.2. Feature descriptions
Table 4: Feature descriptions
| agent_name | The name of the agent that is advertising this listing. | From API |
| County | The name of the county that the property is in. | From API |
| Description | A description of the property. | From API |
| displayable_address | Zoopla says this is the address of the property. In reality it is often a street name. | From API |
| Latitude | The latitude of the property, if known. | From API |
| listing_id | The Zoopla.co.uk unique listing identifier for this property listing. | From API |
| listing_status | The current listings status of this property, either "sale" or "rent". | From API |
| Longitude | The longitude of the property, if known. | From API |
| new_home | If this listing is classified as a new home then "true". | From API |
| num_bathrooms | The number of bathrooms that this property has. In reality this is often not completed by estate agents so is 0. | From API |
| num_bedrooms | The number of bedrooms that this property has. | From API |
| Price | The price of this property for listings that have a status of "sale" and a per-week price for those that have a status of "rent". For example, <per_month>1600</per_month> or <per_week>369</per_week>. If the price modifier value is "price_on_request" the price will be returned as 0. | From API |
| property_type | Type of property, possible values include: | From API |
| Terraced bungalow | ||
| Terraced house | ||
| End terrace house | ||
| Semi-detached bungalow | ||
| Semi-detached house | ||
| Detached bungalow | ||
| Detached house | ||
| Mews house | ||
| Flat | ||
| Maisonette | ||
| Bungalow | ||
| Town house | ||
| Cottage | ||
| Barn conversion | ||
| Mobile and/or park home | ||
| Land | ||
| Studio | ||
| Block of flats | ||
| Office | ||
| Chalet | ||
| Cottage | ||
| Country house | ||
| Equestrian property | ||
| Farm | ||
| Farmhouse | ||
| Houseboat | ||
| Link-detached | ||
| Lodge | ||
| Parking and/or garage | ||
| Villa | ||
| street_name | The name of the street that this property is on. | From API |
| la | Local authority of property, after matching latitude and longitude to nearest address in AddressBase. | Modelled feature |
| lsoa11 | Lower layer super output area (LSOA) of property, after matching latitude and longitude to nearest address in AddressBase. | Modelled feature |
| msoa11 | Middle layer super output area (MSOA) of property, after matching latitude and longitude to nearest address in AddressBase. | Modelled feature |
| oa11 | Output area (OA) of property, after matching latitude and longitude to nearest address in AddressBase. | Modelled feature |
| postcode | Postcode of property, after matching latitude and longitude to nearest address in AddressBase. | Modelled feature |
| uprn | Unique property reference number (UPRN) of property, after matching latitude and longitude to nearest address in AddressBase. Around 0.2% of cases have no UPRN within 120 metres. | Modelled feature |
| parkhome | Binary indicator as to whether the property is a caravan home or not. These have been manually verified. 1 equals caravan home, 0 equals not a caravan home. | Modelled feature |
| Source: Office for National Statistics | ||
Download this table Table 4: Feature descriptions
.xls (23.6 kB)7.3. Sample of data for one property from the Zoopla API
Table 5: Sample of data for one property from the Zoopla API
| agent_name | Harringtons Property Services | |
| county | Hampshire | |
| description | Harringtons are delighted to offer this extensively renovated and secluded four/five bedroom family home in a desirable location within Down End, Fareham. The property has been completely refurbished in a character/contemporary style by the current owner with no expense spared, with stunning individual features such as bi-fold doors in the living room leading to an oak veranda, box sash windows with internal wooden shutters and a mezzanine style reception area in the converted double garage. Externally the property continues to impress with very generously sized off-road parking and an oak three bay car port. | |
| displayable_address | Down End Road, Fareham PO16 | |
| latitude | 50.852573 | |
| listing_id | 36174827 | |
| listing_status | Sale | |
| longitude | -1.155352 | |
| new_home | ||
| num_bathrooms | 2 | |
| num_bedrooms | 5 | |
| price | 575000 | |
| property_type | Detached house | |
| street_name | ||
| Replace slash with or | ||
| Replace slash with and for accessibility | ||
| Insert comma | ||
| Upper case | ||
| Source: Office for National Statistics | ||