1. Main points
The number of working days lost due to labour disputes in 2015 was 170,000 compared with 788,000 in 2014. The 2015 figure was the second lowest annual total since records began in 1891.
The decrease of working days lost in 2015 was mainly attributable to a number of large scale public sector strikes in 2014.
In a change to recent years, Transport and Storage saw the largest number of working days lost, while the majority of individual strikes occurred in Education.
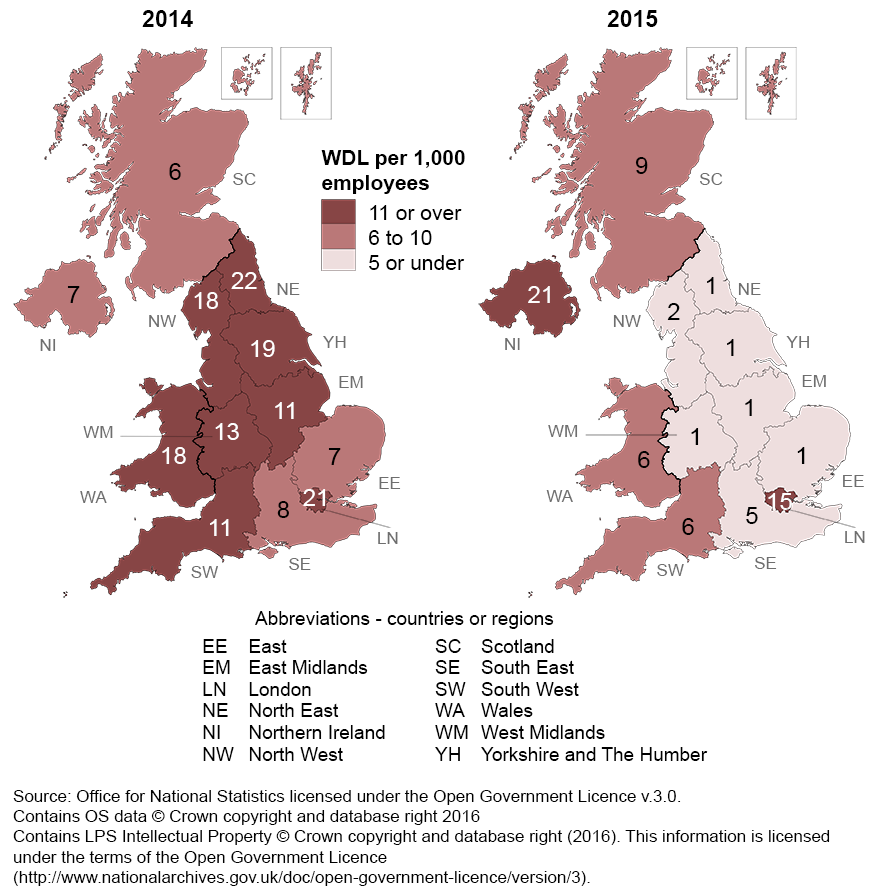
The region with the highest working days lost per 1000 employees in 2015 was Northern Ireland.
Pay was once again the principal cause of labour disputes in 2015. This has been the main cause of labour disputes for the last ten years, with the exception of 2009 and 2010, when the main cause was redundancy.
The public and private sector saw the same amount of disputes in 2015 in a change to recent history. However, the public sector had more working days lost than the private sector.
There were 81,000 workers involved in labour disputes in 2015, the lowest figure since records began in 1893.
Back to table of contents2. Introduction
This article presents analysis of the three main measures of labour disputes (working days lost, stoppages and workers involved) by industry, region, cause, size and duration. The statistics are put into context by considering estimates of working days lost per 1,000 employees. Data are taken directly from the employer or trade union involved after ONS has identified disputes from press reports.
This article gives information on labour disputes in 2015 as well as giving comparisons with earlier years. It presents year total figures on labour disputes in 2015 and provides a more in-depth analysis of figures than that published as part of the monthly Labour Market Statistical Bulletin.
Back to table of contents3. Annual changes
A comparison of labour disputes in 2014 and 2015 is shown in Table 1. There are 3 core components to the figures: the number of working days lost through stoppages, the number of workers involved in those stoppages and the number of stoppages themselves. (See technical note for more details on these definitions). Information on earlier years is available in the table Labour Disputes Annual Estimates 1891 to 2015, which can be found in the datasets associated with this article.
Table 1 : Number of working days lost (WDL), workers involved and stoppages, UK, 2014 and 2015 in progress in year
| 2014 | 2015 | |
|---|---|---|
| Working days lost through stoppages: | 788,300 | 169,600 |
| Workers involved in stoppages: | 733,300 | 81,000 |
| Stoppages: | 155 | 106 |
| Mean number of WDL per stoppage | 5,086 | 1,600 |
| Median number of WDL per stoppage | 171 | 195 |
| Source: Office for National Statistics | ||
| Notes: | ||
| 1. Workers in progress figures also include workers who did not strike initially, but who joined at a later date. | ||
Download this table Table 1 : Number of working days lost (WDL), workers involved and stoppages, UK, 2014 and 2015 in progress in year
.xls (25.1 kB)The 2015 working days lost total (170,000) is not only lower than the total last year, but is the second lowest annual total since records began in 1891 (the lowest was 157,000 in 2005).
There were 81,000 workers involved in labour disputes during 2015, the lowest since records began in 1893.
As shown at Table 1, the mean number of working days lost per stoppage was lower in 2015 than in 2014. However the median number was higher in 2015 than in 2014. The mean value is generally much higher than the median, since working days lost can be greatly affected by large one off strikes. For this reason, the median tends to give a more typical measure of the average number of working days lost per stoppage.
This can be seen at Figures 1 and 2, where the median number of working days lost per stoppage in a year is more consistent over time than the mean.
Figure 1: Median working days lost (WDL) per stoppage, UK, 2009 to 2015
Source: Office for National Statistics
Download this chart Figure 1: Median working days lost (WDL) per stoppage, UK, 2009 to 2015
Image .csv .xls
Figure 2: Mean working days lost (WDL) per stoppage, UK, 2009 to 2015
Source: Office for National Statistics
Download this chart Figure 2: Mean working days lost (WDL) per stoppage, UK, 2009 to 2015
Image .csv .xls4. Review of 1996 to 2015
Figure 3 shows a time series of working days lost between 1891 and 2015. It shows that the amount of industrial action has significantly reduced in the last 30 years. This is a stark contrast to the level of action seen when the miners went on strike in the 1970s and 1980s. The 1910s and 1920s saw even greater levels of industrial action culminating in the general strike of 1926.
Figure 3: Working days lost (WDL), UK, 1891 to 2015
Source: Office for National Statistics
Notes:
- 1898 - Welsh coal strike
- 1912 - National coal strike
- 1919 - Battle of George Square. Dispute over hours in a working week involving the shipbuilding and engineering trades
- 1921 - Black Friday
- 1926 - General Strike. Lasted 9 days. Over 1.5 million coal miners, dockworkers, iron workers, printers, railwaymen, steelworkers and other transport workers joined the strike
- 1972 - UK Miners' strike
- 1979 - Winter of discontent
- 1984 - UK miners' strike, Battle of Orgreave
Download this chart Figure 3: Working days lost (WDL), UK, 1891 to 2015
Image .csv .xlsTable 2 presents labour disputes figures for the period 1996 to 2015, while Figures 4 and 5 illustrate working days lost and the number of stoppages respectively. Figures 4 and 5 show that there are a number of spikes in the time series in years when a particularly large strike took place, showing the impact individual strikes can have on the statistics. The high number of days lost in 2011, for example, was due to two large public sector strikes, while the 2002 figure was due to one very large stoppage in the transport and storage industry. A longer time series can be found within the dataset in this article.
Table 2 : Number of working days lost and stoppages, UK, 1996 to 2015
| Year | Working days lost (thousands) | Working days lost per 1,000 employees2 | Workers involved (thousands) | Stoppages3 | Stoppages involving the loss of 100,000 working days or more |
|---|---|---|---|---|---|
| 1996 | 1,302 | 53 | 364 | 230 | 2 |
| 1997 | 235 | 9 | 130 | 216 | - |
| 1998 | 282 | 11 | 93 | 166 | - |
| 1999 | 242 | 9 | 141 | 205 | - |
| 2000 | 499 | 19 | 183 | 212 | 1 |
| 2001 | 525 | 20 | 180 | 194 | 1 |
| 2002 | 1,323 | 49 | 943 | 146 | 2 |
| 2003 | 499 | 18 | 151 | 133 | - |
| 2004 | 905 | 33 | 293 | 130 | 3 |
| 2005 | 157 | 6 | 93 | 116 | - |
| 2006 | 755 | 27 | 713 | 158 | 1 |
| 2007 | 1,039 | 37 | 745 | 142 | 4 |
| 2008 | 759 | 27 | 511 | 144 | 2 |
| 2009 | 455 | 16 | 209 | 98 | 1 |
| 2010 | 365 | 13 | 133 | 92 | 1 |
| 2011 | 1,390 | 50 | 1,530 | 149 | 3 |
| 2012 | 249 | 9 | 237 | 131 | 1 |
| 2013 | 444 | 16 | 395 | 114 | 2 |
| 2014 | 788 | 27 | 733 | 155 | 2 |
| 2015 | 170 | 6 | 81 | 106 | - |
| Source: Office for National Statistics | |||||
| Notes: | |||||
| 1. Cells containing a hyphen (-) represent zero. | |||||
| 2. Based on the estimates of employee jobs from Workforce Jobs (ONS). | |||||
| 3. Stoppages in progress during year. Prior to 2015 a dispute was counted as a new stoppage if there was a gap of more than one month between instances of industrial action. From 2015 disputes with a gap of more than one month between instances of industrial action are counted as a single stoppage. | |||||
Download this table Table 2 : Number of working days lost and stoppages, UK, 1996 to 2015
.xls (26.6 kB)
Figure 4: Working days lost (WDL), UK, 1996 to 2015 (millions)
Source: Office for National Statistics
Download this chart Figure 4: Working days lost (WDL), UK, 1996 to 2015 (millions)
Image .csv .xls
Figure 5: Stoppages, UK, 1996 to 2015
Source: Office for National Statistics
Download this chart Figure 5: Stoppages, UK, 1996 to 2015
Image .csv .xlsFigure 5 shows that there has been a significant decline in the number of strikes since 1996. Though volatile, the number of working days lost has remained broadly the same over this period. This shows that although the number of stoppages has fallen, large scale stoppages have become more common.
The second column of Table 2 shows working days lost per 1,000 employees for each year from 1996 to 2015. This converts working days lost into a strike rate, taking into account the size of the labour force. This also enables comparisons to be made across industries and regions that differ in size, as well as adjusting for employment changes in industries and regions over time. The level of employee jobs has generally risen over time. The strike rate in the last 10 years is generally lower than in previous decades. This rise in employment explains strike rates that differ between years when there are no discernible changes in working days lost. The 170,000 working days lost in 2015 is equivalent to 6 working days lost per 1,000 employees, which is lower than the average over the last 20 years (23).
Back to table of contents5. Industrial analyses
Historically, certain industries have been more prone to strike action than others, and breaking the labour disputes statistics down into separate industries can reveal some interesting patterns and shifts over time. However, it should be noted that comparisons between industries can also be affected by the methodology that is used for compiling the figures. For example, because very small stoppages are excluded from the figures (see technical note for more details), it is more likely that industry groups with large firms will have disputes included in the statistics. In addition to this, caution must be exercised while carrying out time series analysis due to changes in industrial classifications over time.
Table 3 shows labour disputes statistics for 2015 broken down into 14 industry groups (classified according to the Standard Industrial Classification 2007). Public Administration is the second largest sector in terms of number of working days lost, while the Transport and storage sector has risen to the largest, accounting for just over one third of the working days lost in 2015. However, this industrial group only accounted for 18% of all strikes (19), indicating that the number of workers taking part in these strikes is, on average, greater than other industrial groups. The Education sector showed 21,500 working days lost in 2015, accounting for a further 13% of the working days lost. The industry group with the largest number of stoppages is Education (29).
Table 3: Number of working days lost (WDL) and stoppages by industry, UK, 2015
| Industry group (SIC 2007) | SIC class | Working days lost (thousands) | Working days lost per 1,000 employees | Workers involved (thouands) | Stoppages | |
| All industries and services | 169.6 | 6 | 81 | 106 | ||
| Agriculture forestry and fishing | 01,02,03 | - | - | - | - | |
| Mining, quarrying and Electricity, gas, air conditioning | 5 to 9, 35 | 0.5 | 3 | 0.5 | 1 | |
| Manufacturing | 10 to 33 | 11.3 | 5 | 2.7 | 9 | |
| Sewerage, Waste Management and Remediation Activities and Water Supply | 36 to 39 | 3.1 | 16 | 0.2 | 2 | |
| Construction | 41 to 43 | 2.1 | 2 | 0.4 | 3 | |
| Wholesale and retail trade; repair of motor vehicles, | ||||||
| personal and household goods and Accommodation and Food Services | 45 to 48, 55 to 56 | 1.3 | - | 0.3 | 2 | |
| Transport and storage | 49 to 53 | 60.2 | 47 | 28.4 | 19 | |
| Information and Communication | 58 to 63 | 1.5 | 1 | 0.5 | 4 | |
| Financial and Insurance, Real estate, Professional, Scientific, | ||||||
| Technical and Admin Activities | 64 to 82 | 3.3 | 1 | 1.8 | 9 | |
| Public administration and defence; compulsory social security | 84 | 25.4 | 20 | 23.1 | 13 | |
| Education | 85 | 21.5 | 8 | 14.9 | 29 | |
| Human Health and social work | 86 to 88 | 20.0 | 5 | 7.4 | 10 | |
| Other | 90 to 99 | 19.5 | 27 | 0.8 | 6 | |
| Source: Office for National Statistics | ||||||
| Notes: | ||||||
| 1. The figures for working days lost and workers have been rounded and consequently the sums of constituent items may not agree precisely with the totals. | ||||||
| 2. Some stoppages involved workers in more than one of the above industry groups, but have each been counted as only one stoppage in the totals for all industries and services. | ||||||
| 3. Cells containing a hyphen (-) represent a zero or less than 50. | ||||||
Download this table Table 3: Number of working days lost (WDL) and stoppages by industry, UK, 2015
.xls (27.1 kB)Figure 6 shows working days lost per 1,000 employees for four industrial groupings over a 10-year period. The industry group with the largest strike rate is public administration and defence. This is mainly because disputes in this group tend to be large. Education has also seen a large strike rate. This industry group has a large number of labour disputes, but disputes are usually small.
Figure 6: Working days lost (WDL) per 1,000 employees by sector, UK, 2006 to 2015
Source: Office for National Statistics
Notes:
- Industrial classifications follows Standard Industrial Classification (SIC) 1992 up to 2004, SIC 2005 from 2005 to 2007 and SIC 2007 from 2007 onwards.
Download this chart Figure 6: Working days lost (WDL) per 1,000 employees by sector, UK, 2006 to 2015
Image .csv .xls6. Regional analyses
Table 4 shows regional strike rates between 2007 and 2015, with a further breakdown of the figures for 2015 by industrial grouping. When interpreting these figures, it is important to bear in mind that the industrial composition of employment in a region is a major influencing factor on the scale of labour disputes it experiences. The regions with the highest strike rate in 2015 were Northern Ireland (21) and London (15). All of the regions except Northern Ireland and Scotland showed a decrease compared with 2014. Since 2007, the North East, North West, Yorkshire and The Humber, London and Wales have shown the highest levels of industrial action. The East of England, South East and Northern Ireland have previously shown some of the lowest.
Figure 7 compares working days lost per 1,000 employees between 2014 and 2015. Most regions showed a decrease in strike action over this period. Northern Ireland and London had the largest strike rate in 2015.
Figure 7 - Working days lost (WDL) per 1,000 employees, UK, 2014 to 2015
Source: Office for National Statistics
Download this image Figure 7 - Working days lost (WDL) per 1,000 employees, UK, 2014 to 2015
.png (248.4 kB) .png (248.4 kB)
7. Cause of disputes
Table 5 shows stoppages in 2015 by principal cause and industry grouping. In 2015, 71% of working days lost were due to disputes over pay, accounting for 85% of all stoppages. The biggest contributors to this were public administration and defence and education.
Disputes over pay also include stoppages over feared or alleged reductions in earnings as well as disputes over the size of pay increases. Disputes over pension provisions are also classified as disputes over pay.
Figure 8 and Table 6 give information on working days lost by cause of dispute in each year. The figures are often dominated by 1 or 2 very large strikes, which can make comparisons over time difficult. Looking back over a 10 year period it is clear to see that pay usually dominates the days lost within the UK, with only 2 years not having pay as the major cause of working days lost. For 2009 and 2010, redundancy resulted in the highest number of working days lost.
Figure 8: Working days lost (WDL) by principal cause of dispute, UK, 2006 to 2015
Source: Office for National Statistics
Download this chart Figure 8: Working days lost (WDL) by principal cause of dispute, UK, 2006 to 2015
Image .csv .xls8. Disputes by duration
Labour disputes statistics cover the number of days that strike action took place, not the number of days the parties involved in the dispute were actually in disagreement.
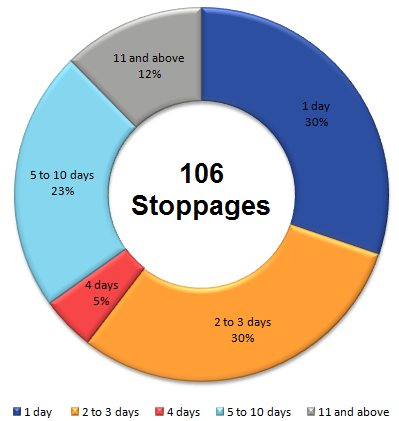
Table 7 and Figure 9 show the duration of the stoppages in progress in 2015. These show that just under a third of the number of stoppages (30%) lasted for only one day. These accounted for 25% of workers involved and 17,500 working days lost (10%). In a change to recent years, the percentage of disputes lasting longer than one day is noticeably higher (70%). In 2013 and 2014, disputes lasting longer than one day accounted for 37% and 54% respectively.
Table 7: Working days lost (WDL), workers involved and stoppages in progress by duration, UK, 2015
| Days | Working days lost (thousands) | Proportion of all working days lost (%) | Workers involved (thousands) | Proportion of all workers (%) | Stoppages in progress | Proportion of all stoppages (%) |
|---|---|---|---|---|---|---|
| 1 | 17.5 | 10.3 | 20.0 | 24.7 | 32 | 30.2 |
| 2 | 29.1 | 17.2 | 21.6 | 26.7 | 19 | 17.9 |
| 3 | 30.9 | 18.2 | 16.8 | 20.7 | 13 | 12.3 |
| 4 | 1.9 | 1.1 | 0.6 | 0.7 | 5 | 4.7 |
| 5 | 7.3 | 4.3 | 1.6 | 2.0 | 9 | 8.5 |
| 6 to 10 | 24.3 | 14.3 | 8.9 | 11.0 | 15 | 14.2 |
| 11 to 15 | 16.6 | 9.8 | 10.0 | 12.3 | 3 | 2.8 |
| 16 to 20 | 5.8 | 3.4 | 0.6 | 0.7 | 2 | 1.9 |
| 21 to 30 | 5.3 | 3.1 | 0.4 | 0.5 | 3 | 2.8 |
| 31 to 50 | 3.0 | 1.8 | 0.2 | 0.2 | 2 | 1.9 |
| Over 50 | 27.8 | 16.4 | 0.4 | 0.5 | 3 | 2.8 |
| All stoppages | 169.6 | 81.0 | 106 | |||
| Source: Office for National Statistics | ||||||
| Notes: | ||||||
| 1. The statistics cover the number of days that strike action took place, not the number of days the parties involved in the dispute were actually in disagreement. | ||||||
| 2. Classification by size is based on the full duration of stoppages, but the figure for days lost include only those days lost in 2015. | ||||||
| 3. The figures for working days lost and workers involved have been rounded and consequently the sum of the constituent items may not agree precisely with the totals. | ||||||
| 4. The working days lost figures are in general less than the product of the duration of each stoppage and the number of workers involved because some workers would not have been involved throughout the dispute - see technical note. | ||||||
| 5. Cells containing a hyphen (-) represent a zero. | ||||||
Download this table Table 7: Working days lost (WDL), workers involved and stoppages in progress by duration, UK, 2015
.xls (27.6 kB)
Figure 9: Stoppages in progress by duration of dispute, UK, 2015
Source: Office for National Statistics
Download this image Figure 9: Stoppages in progress by duration of dispute, UK, 2015
.png (51.3 kB) .xls (26.1 kB)
9. Disputes by size
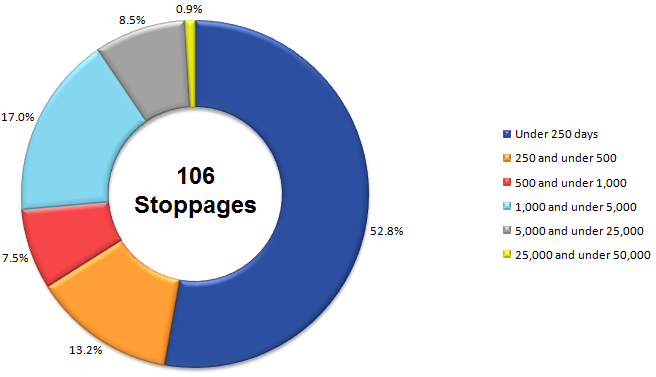
Table 8 shows disputes in 2015 by size and Figure 10 illustrates that a large proportion of days lost result from larger stoppages, with very few stoppages actually being large. The data also shows that 90% of working days lost in 2015 resulted from stoppages where more than 1,000 days were lost in total but only 26% of stoppages were that large. The highest proportion of stoppages was within the ‘under 250 days’ category, accounting for 53% of all stoppages, although this category accounted for just over 3% of working days lost. Table 8 shows the impact that large strikes can have on the figures.
Table 8: Stoppages in progress by size of dispute, UK, 2015
| Working days lost in each dispute | Working days lost (thousands) | Proportion of all working days lost (%) | Workers involved (thousands) | Proportion of all workers (%) | Stoppages in progress | Proportion of all stoppages (%) |
|---|---|---|---|---|---|---|
| Under 250 days | 5.6 | 3.3 | 4.1 | 5.1 | 56 | 52.8 |
| 250 and under 500 | 4.9 | 2.9 | 2.7 | 3.3 | 14 | 13.2 |
| 500 and under 1,000 | 5.9 | 3.5 | 1.8 | 2.2 | 8 | 7.5 |
| 1,000 and under 5,000 | 36.4 | 21.5 | 17.4 | 21.5 | 18 | 17.0 |
| 5,000 and under 25,000 | 90.9 | 53.6 | 40.4 | 49.9 | 9 | 8.5 |
| 25,000 and under 50,000 | 26.1 | 15.4 | 14.7 | 18.1 | 1 | 0.9 |
| All stoppages | 169.6 | 81 | 106 | |||
| Source: Office for National Statistics | ||||||
| Notes: | ||||||
| 1. The figures for working days lost and workers involved have been rounded and consequently the sum of the constituent items may not agree with the totals. | ||||||
Download this table Table 8: Stoppages in progress by size of dispute, UK, 2015
.xls (25.1 kB)
Figure 10: Proportion of stoppages in progress by working days lost (WDL), UK, 2015
Source: Office for National Statistics
Download this image Figure 10: Proportion of stoppages in progress by working days lost (WDL), UK, 2015
.png (52.3 kB) .xls (25.1 kB)
10. Disputes by public and private Sector
Figures 11a and 11b illustrate the breakdown of working days lost and the number of stoppages between the public and private sectors. The figures are also shown in Table 9. The number of working days lost in the public sector decreased from 716,000 in 2014 to 90,000 in 2015. This decrease in strike activity is also shown by the fall in the strike rate in the public sector from 132 working days lost per 1000 employees in 2014 to 17 in 2015.
In the private sector 79,000 days were lost over 53 stoppages, which accounts for 47% of all days lost in 2015. Figure 11a shows that, for 2015 the private sector accounted for 47% of working days lost, the highest proportion since 1999. As shown at Figure 11b, there was an equal split of stoppages between the public and private sectors in 2015.
Figure 11a: Working days lost (WDL) by public and private split, UK, 2006 to 2015
Source: Office for National Statistics
Download this chart Figure 11a: Working days lost (WDL) by public and private split, UK, 2006 to 2015
Image .csv .xls
Figure 11b: Stoppages by public and private split, UK, 2006 to 2015
Source: Office for National Statistics
Download this chart Figure 11b: Stoppages by public and private split, UK, 2006 to 2015
Image .csv .xls
Table 9: Number of working days lost (WDL) and stoppages, public and private split, UK, 2006 to 2015
| Working days lost (thousands) | Stoppages1 | Working days lost per 1000 employees2 | ||||
|---|---|---|---|---|---|---|
| Year | Public | Private | Public | Private | Public | Private |
| 2006 | 656 | 98 | 87 | 71 | 108 | 4 |
| 2007 | 1,002 | 37 | 90 | 52 | 166 | 2 |
| 2008 | 711 | 48 | 75 | 69 | 117 | 2 |
| 2009 | 368 | 88 | 49 | 49 | 58 | 4 |
| 2010 | 313 | 52 | 47 | 45 | 50 | 2 |
| 2011 | 1,276 | 113 | 87 | 62 | 210 | 5 |
| 2012 | 198 | 51 | 62 | 69 | 34 | 2 |
| 2013 | 363 | 81 | 50 | 64 | 63 | 3 |
| 2014 | 716 | 72 | 68 | 87 | 132 | 3 |
| 2015 | 90 | 79 | 53 | 53 | 17 | 3 |
| Source: Office for National Statistics | ||||||
| 1. Stoppages in progress during year. | ||||||
| 2. Based on the latest estimates of employee jobs from Workforce Jobs (ONS). | ||||||
Download this table Table 9: Number of working days lost (WDL) and stoppages, public and private split, UK, 2006 to 2015
.xls (25.1 kB)11. Trade union ballots
Annual trade union ballot data from 2002 to 2015 are presented in Tables 10 and 11. The number of ballots1 has fallen to 568 this year, this compares with 650 in 2014.
Table 10: Trade union ballots (strike action), UK, 2002 to 2015
| Year | Total ballots | Ballots calling for 'strike action' | Ballots voting FOR strike action | Ballots voting AGAINST strike action | Split result |
|---|---|---|---|---|---|
| 2002 | 806 | 738 | 613 | 113 | 12 |
| 2003 | 899 | 825 | 684 | 125 | 16 |
| 2004 | 952 | 901 | 746 | 142 | 13 |
| 2005 | 815 | 775 | 663 | 103 | 9 |
| 2006 | 1341 | 1290 | 1094 | 140 | 57 |
| 2007 | 767 | 713 | 637 | 64 | 12 |
| 2008 | 834 | 786 | 658 | 123 | 13 |
| 2009 | 579 | 561 | 458 | 93 | 10 |
| 2010 | 579 | 555 | 487 | 61 | 7 |
| 2011 | 994 | 964 | 903 | 51 | 9 |
| 2012 | 601 | 585 | 487 | 89 | 8 |
| 2013 | 494 | 469 | 417 | 48 | 4 |
| 2014 | 650 | 628 | 550 | 68 | 10 |
| 2015 | 568 | 558 | 503 | 50 | 5 |
| Source: Electoral Reform Services | |||||
| Notes: | |||||
| 1. As the majority of ballots include options for both ‘strike action’ and ‘action short of strike action,’ the total number of ballots does not equal the total of these options added together. | |||||
| 2. The number of ballots voting for and against strike action may not sum to the total number of ballots calling for strike action due to some votes being split. | |||||
Download this table Table 10: Trade union ballots (strike action), UK, 2002 to 2015
.xls (27.1 kB)
Table 11: Trade union ballots (action short of a strike), UK, 2002 to 2015
| Year | Total ballots | Ballots calling for 'action short of a strike' | Ballots voting FOR action short of a strike | Ballots voting AGAINST action short of strike | Split result |
|---|---|---|---|---|---|
| 2002 | 806 | 537 | 519 | 16 | 2 |
| 2003 | 899 | 638 | 601 | 31 | 6 |
| 2004 | 952 | 759 | 709 | 41 | 9 |
| 2005 | 815 | 604 | 562 | 35 | 7 |
| 2006 | 1341 | 577 | 541 | 27 | 9 |
| 2007 | 767 | 583 | 555 | 19 | 9 |
| 2008 | 834 | 598 | 559 | 30 | 9 |
| 2009 | 579 | 435 | 407 | 21 | 7 |
| 2010 | 579 | 411 | 399 | 5 | 7 |
| 2011 | 994 | 388 | 375 | 8 | 5 |
| 2012 | 601 | 366 | 349 | 15 | 2 |
| 2013 | 494 | 318 | 279 | 33 | 6 |
| 2014 | 650 | 368 | 329 | 36 | 3 |
| 2015 | 568 | 417 | 404 | 12 | 1 |
| Source: Electoral Reform Services | |||||
| Notes: | |||||
| 1. As the majority of ballots include options for both ‘strike action’ and ‘action short of strike action,’ the total number of ballots does not equal the total of these options added together. | |||||
| 2. The number of ballots voting for and against action short of a strike may not sum to the total number of ballots calling for action short of a strike due to some votes being split. | |||||
Download this table Table 11: Trade union ballots (action short of a strike), UK, 2002 to 2015
.xls (27.1 kB)The number of ballots resulting in a vote for strike action in 2015 shows a decrease on the previous year from 550 to 503. The time series for trade union ballots is illustrated in Figure 12. This chart shows that a high percentage of ballots calling for strike action result in ‘yes’ votes, with 90% in 2015 and an average of 87% over the past ten years.
Figure 12: Ballots resulting in strike action, UK, 2002 to 2015
Source: Electoral Reform Services
Download this chart Figure 12: Ballots resulting in strike action, UK, 2002 to 2015
Image .csv .xls12. Quality and methodology
The Labour Disputes Quality and Methodology Information document contains important information on:
- the strengths and limitations of the data
- the quality of the output: including the accuracy of the data, how it compares with related data
- uses and users
- how the output was created