1. Acknowledgements
The Travel to work areas (TTWAs) and alternative TTWA boundaries used in this article were produced by professor Mike Coombes of Newcastle University.
Back to table of contents2. Main points
There are 228 travel to work areas (TTWAs) in the UK (as calculated using Census 2011 data): 149 TTWAs in England, 45 in Scotland, 18 in Wales, 10 in Northern Ireland and 6 cross-border TTWAs.
Comparing data across the 160 TTWAs in Great Britain with a resident population of 60,000 or more illustrates the variability of labour market outcomes across the country:
- employment rates in April 2015 to March 2016 varied from 83.6% in Northallerton to 63.6% in Hartlepool
- economic inactivity rates varied from 13.4% in Gloucester to 31.0% in Clacton
- claimant count rates ranged from 0.5% in Kendal to 4.2% in Hartlepool
- the share of 16 to 64 year old residents with level 4 (degree level) qualifications was highest (above 50%) in Oxford, Edinburgh and Leamington Spa compared with 16% in Clacton and Great Yarmouth; Dudley had the highest share with no qualifications (19%)
Illustrative alternative TTWAs for subgroups of the working population have been produced. When compared with the main TTWA boundaries, these show how the size of labour market areas varies for different groups of workers.
For example, there are 153 TTWAs for workers with high qualifications, but 416 for workers with low qualifications. This illustrates that low skill workers typically commute shorter distances to work. There is a similar difference between full-time and part-time workers
The main TTWA boundaries and the alternative TTWA boundaries can be explored on an interactive map.
Back to table of contents3. Introduction
This article presents information on the 2011 travel to work areas (TTWAs) in England, Wales and Scotland. Analysis is of TTWAs with a resident population greater than 60,000 residents. Analysis of TTWAs in Northern Ireland is not presented here since comparable data is not available.
TTWAs are a geography created to approximate labour market areas. In other words, they are derived to reflect self-contained areas in which most people both live and work. For those involved in labour market analysis and planning, TTWAs are useful for helping build an understanding of local labour markets, for framing local labour market analysis, and in particular for examining the spatial mismatch between labour supply and demand.
Alongside presenting background information on the TTWA geography, there are 2 main sections to this article. The first of these sections uses the published TTWA geography to analyse a range of publically available data on population, employment and economic activity. The final section, by contrast, introduces the concept of alternative TTWAs, created for different subgroups of the working population. This section is new to this release, and provides some useful information on how labour market areas differ amongst different groups of the population, for example comparing full-time workers and part-time workers or higher-skill workers compared with lower-skill workers. Links are provided to a map tool presenting these alternative TTWAs.
Back to table of contents4. Definition of 2011 TTWAs
In concept, a self-contained labour market area is one in which all commuting occurs within the boundary of that area. In practice, it is not possible to divide the UK into entirely separate labour market areas as commuting patterns are too diffuse. Travel to work areas (TTWAs) have been developed so that relatively few commuters cross a TTWA boundary on their way to work. As such, TTWAs are based on statistical analysis rather than administrative boundaries.
The current criteria for defining TTWAs are that at least 75% of the area's resident workforce work in the area and at least 75% of the people who work in the area also live in the area. The area must also have an economically active population of at least 3,500. However, for areas with a working population in excess of 25,000, self-containment rates as low as 66.7% are accepted as part of a limited “trade-off” between workforce size and level of self-containment. The resulting pattern is that many areas are much larger than others – indeed, much of London and its surrounding area forms one TTWA.
The 2011 TTWAs (published August 2015) were produced by Newcastle University, using an algorithm to identify commuting patterns from a 2011 Census matrix of commuting flow data by origin and destination for workers aged 16 and over, based on residence postcode and address of the place of work in main job. For the 2011 TTWAs, statistical geographies were used to define the TTWAs: lower layer super output areas (LSOAs) for England and Wales, data zones (DZs) for Scotland, and super output areas (SOAs) for Northern Ireland.
TTWA boundaries are non-overlapping and cover the whole of the UK. TTWAs have been assigned to regions based on where the highest proportion of land area for the TTWA falls. TTWAs can also cross national boundaries, although no account is taken of commuting between Northern Ireland and the Republic of Ireland.
Over time there has been a consistent pattern of a reduction in the number of TTWAs: more people tend to commute longer distances to work, leading to an increase in the average size of TTWAs in terms of geographical area and population, and a consequent decrease in the number of TTWAs. In 1991 there were 308 TTWAs covering the UK, in 2001 there were 243 TTWAs, and in 2011 a further reduction to 228 TTWAs. Further analysis of the changes to travel to work areas can be found in the Changes to Travel to Work Areas: 2001 to 2011 release.
2011 UK TTWAs can be viewed on this interactive map. Further information and guidance on TTWAs can be found on our methodology page, including additional links to 2011 TTWA summary statistics and methodology note. TTWA boundaries from 2011 for use in GIS, codes and lookup files are available in the Open Geography portal.
Because the size of TTWAs (in terms of resident population) varies considerably, the accuracy of available data also varies. For TTWAs with a small population, there is a greater degree of sampling error from sample surveys, and results for these smaller areas need to be treated with caution. Data for all TTWAs is available on Nomis. However, while we present population data for all TTWAs in this article, the subsequent data on the labour market is focused only on TTWAs in Great Britain that include a total resident population of 60,000 or greater, based on 2014 mid-year population estimates. In some cases estimates are missing for a small number of TTWAs where they have been deemed disclosive or, due to small sample sizes, estimates have been considered unreliable for practical purposes. Where relevant this has been stated.
Back to table of contents5. Population
The latest annual mid-year population estimates for output areas in England and Wales and data zones in Scotland can been used to compare the resident population of travel to work areas (TTWAs).
In total 58 of the 218 TTWAs in Great Britain had a resident population below 60,000, leaving 160 TTWAs with resident populations greater than 60,000. The TTWA with the smallest population was Ullapool in Scotland with 6,800 residents. Of the TTWAs with a population below 60,000 residents, there were 29 TTWAs in Scotland, 19 TTWAs in England, 8 TTWAs in Wales plus the 2 cross-border TTWAs, Berwick and Oswestry. Within England, 10 of the 19 TTWAs with a population smaller than 60,000 were in the South West.
Table 1 shows London had the largest population of all TTWAs in England and Wales at 8.4 million, followed by Manchester (2.7 million). London TTWA includes nearly all areas within the boundary of Greater London, the exception is an area to the west around Heathrow Airport which is included in the Slough and Heathrow TTWA. Manchester TTWA extends over the areas of Bolton, Rochdale and Oldham and also down to Macclesfield to the south.
Birmingham, Slough and Heathrow, Glasgow and Newcastle TTWAs also have resident populations greater than 1 million. Cardiff has the largest TTWA population in Wales at 778,000 residents.
Table 1: TTWAs with the largest resident population, Great Britain, 2014
| % | ||
| TTWA name | Region/Country | Largest Population |
|---|---|---|
| London | London | 8,369,000 |
| Manchester | North West | 2,664,000 |
| Birmingham | West Midlands | 1,741,000 |
| Slough and Heathrow | South East | 1,662,000 |
| Glasgow | Scotland | 1,256,000 |
| Newcastle | North East | 1,057,000 |
| Liverpool | North West | 990,000 |
| Leicester | East Midlands | 952,000 |
| Sheffield | Yorkshire and the Humber | 851,000 |
| Bristol | South West | 835,000 |
| Source: Office for National Statistics | ||
Download this table Table 1: TTWAs with the largest resident population, Great Britain, 2014
.xls (26.6 kB)6. Employment rate
Employment data1 for travel to work areas (TTWAs) is available from the Annual Population Survey (APS). The APS is a continuous household survey which collects data on a range of social and socio-economic variables at local levels. The headline employment rate is calculated by dividing the employment level for those aged from 16 to 64 by the population for that age group. This analysis is based on estimates for the period April 2015 to March 2016.
Figure 1 shows that the highest employment rates for TTWAs were above 80%. Northallerton and Newbury TTWAs had the highest employment rates in Great Britain overall, at 83.6% and 83.5% respectively. Inverness had the highest employment rate of TTWAs in Scotland at 79.8% and in Wales the highest employment rate for TTWAs was 74.9% in Wrexham. These compare to the national employment rate of 73.7% in Great Britain over the same period.
Figure 1: TTWAs with the highest and lowest employment rates
Age 16 to 64, Great Britain April 2015 to March 2016
Source: Office for National Statistics
Download this chart Figure 1: TTWAs with the highest and lowest employment rates
Image .csv .xlsHartlepool in the North East had the lowest employment rate in Great Britain at 63.6%, followed by Birmingham (64.7%). The lowest employment rate in Scotland was for Kilmarnock and Irvine (65.8%) and the lowest in Wales was Merthyr Tydfil (67.5%).
Generally the highest employment rates for TTWAs were observed in the South East and South West and only one TTWA in these regions, Canterbury (66.7%), had an employment rate below 70%. The lowest employment rates for TTWAs were typically in the North and Midlands of England, with no TTWAs in the North East with an employment rate above the national average. The majority of TTWAs in Wales also had employment rates below the national average.
Male and female employment rate
The male employment rate in Great Britain from April 2015 to March 2016 was 78.7%. The TTWAs with the highest and lowest male employment rates are shown in Table 2.
Table 2: TTWAs with the highest and lowest male employment rates, age 16 to 64, Great Britain, April 2015 to March 2016
| % | ||
| TTWA | Region/Country | Male Employment Rate |
|---|---|---|
| Taunton | South West | 90.1 |
| Crawley | South East | 89.7 |
| Thetford and Mildenhall | East of England | 89.6 |
| Chelmsford | East of England | 88.8 |
| Salisbury | South West | 88.4 |
| Dundee | Scotland | 70.4 |
| Sunderland | North East | 69.1 |
| Hartlepool | North East | 68.3 |
| Liverpool | North West | 68.1 |
| Greenock | Scotland | 67.1 |
| Source: Office for National Statistics | ||
Download this table Table 2: TTWAs with the highest and lowest male employment rates, age 16 to 64, Great Britain, April 2015 to March 2016
.xls (27.1 kB)Taunton in the South West had the highest male employment rate at 90.1%. By contrast, the male employment rate in Greenock in Scotland was 23 percentage points lower at 67.1%.
Table 3: TTWAs with the highest and lowest female employment rates, age 16 to 64, Great Britain, April 2015 to March 2016
| % | ||
| TTWA | Region/Country | Female Employment Rate |
|---|---|---|
| Worthing | South East | 82.1 |
| Evesham | South West | 81.0 |
| Northallerton | Yorkshire and the Humber | 80.7 |
| Gloucester | South West | 79.3 |
| Newbury | South East | 78.9 |
| Hartlepool | North East | 59.0 |
| Bradford | Yorkshire and the Humber | 58.8 |
| Birmingham | West Midlands | 58.4 |
| Worksop and Retford | East Midlands | 58.1 |
| Corby | East Midlands | 57.7 |
| Source: Office for National Statistics | ||
Download this table Table 3: TTWAs with the highest and lowest female employment rates, age 16 to 64, Great Britain, April 2015 to March 2016
.xls (27.1 kB)The female employment rate in Great Britain from April 2015 to March 2016 was 68.8%, approximately ten percentage points lower than the employment rate for males. The highest female employment rates were just over 80% in Worthing, Evesham and Northallerton TTWAs. This compares to the lowest female employment rates in TTWAs, shown in Table 3, which were below 60%.
As for the overall employment rate, the TTWAs with the highest male and female employment rates were generally in the South of England. The lowest male employment rates were in the North of England and Scotland whilst female employment rates were lowest in the North and Midlands. However, differences between male and female employment rates in TTWAs vary. Figure 2 shows the 5 TTWAs with the greatest difference in male and female employment rates and the 5 TTWAs with the smallest difference in male and female employment rates.
Figure 2: TTWAs with the greatest and smallest difference in male and female employment rates
Age 16 to 64, Great Britain, April 2015 to March 2016

Source: Office for National Statistics
Download this image Figure 2: TTWAs with the greatest and smallest difference in male and female employment rates
.png (23.2 kB) .xls (68.1 kB)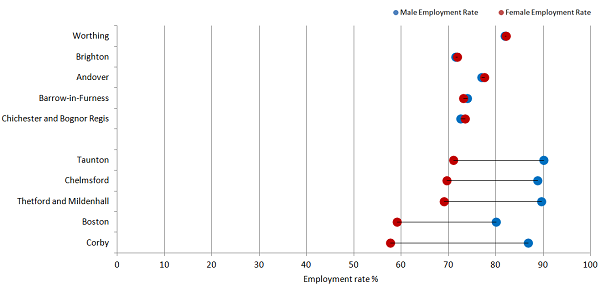
The greatest difference between male and female employment rate occurred in Corby in the East Midlands where the male employment rate (86.8%) exceeded the female employment rate (57.7%) by 29.1 percentage points. This was the lowest female employment rate of all TTWAs and one of the highest male employment rates.
By contrast, employment rates were similar between males and females in some of the TTWAs including the neighbouring TTWAs on the south coast of Chichester and Bognor Regis; Worthing; and Brighton.
Self-employment rate
Those in employment include those who are self-employed and those who are employees. An employee is someone who is in employment and paid a wage by an employer for the work that they do. Someone who is self-employed works for themselves and may or may not have their own employees. Figure 3 shows the TTWAs with the highest and lowest self-employment rates.
Figure 3: TTWAs with the highest and lowest self-employment rates
Age 16 to 64, Great Britain, April 2015 to March 2016
Source: Office for National Statistics
Download this chart Figure 3: TTWAs with the highest and lowest self-employment rates
Image .csv .xlsEvesham in the West Midlands had the highest self-employment rate at 20.6%, over double the average of 10.2% for Great Britain. In Scotland, Dumfries had the highest self-employment rate at 11.2% and in Wales, Haverfordwest and Milford Haven had the highest self-employment rate at 14.7%. Whitehaven had the lowest self-employment rate at 4.1%, followed by Wisbech (4.5%). Swansea had the lowest self-employment rate in Wales at 7.1%.
Figure 4: Self-employment rate for TTWAs by regions and country
Age 16 to 64, Great Britain, April 2015 to March 2016
Source: Office for National Statistics
Download this chart Figure 4: Self-employment rate for TTWAs by regions and country
Image .csv .xlsFigure 4 shows the self-employment rate for each TTWA sorted by region or country. Across the South East and South West, the majority of TTWAs had self-employment rates between 10% and 15%, therefore above the national average. TTWAs in these regions were also amongst those with the highest employment rates. For Scotland, Wales and the remaining English regions self-employment rates were typically between 5% and 10%. Self-employment rates were amongst the lowest in the North East and Scotland.
Notes for Employment rate:
- All estimates are derived from samples of the population and are therefore subject to confidence intervals. The confidence intervals for all estimates can be found on Nomis.
7. Economic inactivity
Economic inactivity1 measures people without work who have not sought work in the last 4 weeks and/or are not available to start work in the next 2 weeks. The headline inactivity rate is calculated by dividing the number of inactive people aged from 16 to 64 by the population for that age group.
Figure 5: TTWAs with highest and lowest proportion of economically inactive population
Age 16 to 64, Great Britain, April 2015 to March 2016
Source: Office for National Statistics
Download this chart Figure 5: TTWAs with highest and lowest proportion of economically inactive population
Image .csv .xlsClacton had the highest share of its population who were economically inactive at 31.0%, followed by Worksop and Retford at 30.1%. Kilmarnock and Irvine had the highest economic inactivity rate for Scotland at 27.6%, whilst the highest economic inactivity rate in Wales was 27.0% in Merthyr Tydfil.
The lowest economic inactivity rate was in Gloucester (13.4%). Inverness had the lowest economic inactivity rate for Scotland at 18.0% and for Wales the lowest economic inactivity rate was in Bridgend at 21.7%. These compare to the economic inactivity rate of 22.2% for Great Britain.
Figure 6: Economic inactivity rate for TTWAs by regions and country
Age 16 to 64, Great Britain, April 2015 to March 2016
Source: Office for National Statistics
Download this chart Figure 6: Economic inactivity rate for TTWAs by regions and country
Image .csv .xlsIn Wales and the North East there were no travel to work areas (TTWAs) with economic inactivity rates below 20%. The majority of TTWAs in the North and Midlands of England, Scotland and Wales were between 20% and 25%. This contrasts with the East, South East and South West where the majority of TTWAs had economic inactivity rates below 20%.
Male and female economic inactivity
Nationally the female economic inactivity rate was higher than the economic inactivity rate for males in Great Britain at 27.5% compared with 16.8%.
In Table 4, Liverpool is shown to have the highest male economic inactivity rate at 26.5%. Over a quarter of males (25.9%) aged 16 to 64 were also economically inactive in Canterbury. Thetford and Mildenhall TTWA had the lowest male economic inactivity rate at 7.0%.
Table 4: TTWAs with the highest male economic inactivity rates, age 16 to 64, Great Britain, April 2015 to March 2016
| TTWA | Region/Country | Male Inactivity Rate | |
|---|---|---|---|
| Liverpool | North West | 26.5 | |
| Canterbury | South East | 25.9 | |
| Sunderland | North East | 24.2 | |
| Greenock | Scotland | 24.1 | |
| Birkenhead | North West | 23.5 | |
| Taunton | South West | 8.3 | |
| Salisbury | South West | 8.0 | |
| Corby | East Midlands | 7.8 | |
| Blandford Forum and Gillingham | South West | 7.5 | |
| Thetford and Mildenhall | East of England | 7.0 | |
| Source: Office for National Statistics | |||
Download this table Table 4: TTWAs with the highest male economic inactivity rates, age 16 to 64, Great Britain, April 2015 to March 2016
.xls (27.6 kB)
Table 5: TTWAs with the highest and lowest female economic inactivity rates, age 16 to 64, Great Britain, April 2015 to March 2016
| % | |||
| TTWA | Region/Country | Female Inactivity Rate | |
|---|---|---|---|
| Skegness and Louth | East Midlands | 39.5 | |
| Clacton | East of England | 38.1 | |
| Boston | East Midlands | 38.0 | |
| Birmingham | West Midlands | 37.4 | |
| Worksop and Retford | East Midlands | 37.1 | |
| Exeter | South West | 18.1 | |
| Northallerton | Yorkshire and the Humber | 17.3 | |
| Newbury | South East | 16.7 | |
| Gloucester | South West | 16.5 | |
| Worthing | South East | 16.1 | |
| Source: Office for National Statistics | |||
Download this table Table 5: TTWAs with the highest and lowest female economic inactivity rates, age 16 to 64, Great Britain, April 2015 to March 2016
.xls (27.1 kB)Table 5 gives the TTWAs with the highest and lowest female economic inactivity rates. At almost 40% of the 16 to 64 population, Skegness and Louth in the East Midlands had the highest female economic inactivity rate. This was closely followed by Clacton in the East of England with a female economic inactivity rate of 38.1%. In comparison, the lowest female economic inactivity rates for TTWAs were less than half this at 16.1% in Worthing (South East) and 16.5% in Gloucester (South West).
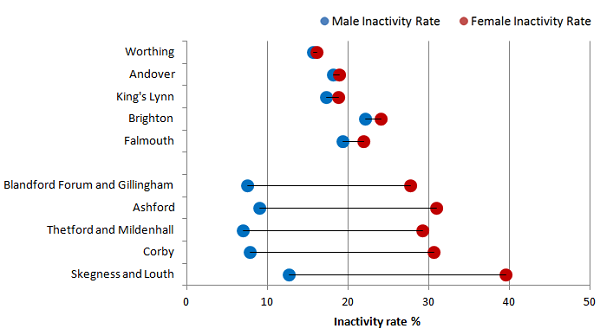
Figure 7 shows the greatest difference in male and female economic inactivity was 26.8 percentage points in Skegness and Louth, which also had the highest female inactivity rate (39.5%). Worthing, which had the lowest female economic inactivity rate, also had the smallest difference between male and female inactivity rates.
Figure 7: TTWAs with the greatest and those with the least difference in male and female inactivity rates
Age 16 to 64, Great Britain, April 2015 to March 2016
Source: Office for National Statistics
Download this image Figure 7: TTWAs with the greatest and those with the least difference in male and female inactivity rates
.png (36.7 kB) .xls (55.8 kB)
Those who are economically inactive can be divided into 2 categories: those who want a job and those who do not. Typically those who do not want a job are not looking for work due to reasons such as staying at home to look after a family. In Great Britain, from April 2015 to March 2016, just under a quarter (24.6%) of the population who were economically inactive wanted a job and three-quarters (75.4%) did not want a job. Figure 8 shows the TTWAs2 with the highest and lowest shares of economically inactive people who want a job.
Figure 8: TTWAs with the highest and lowest shares of economically inactive who want a job
Age 16 to 64, Great Britain, April 2015 to March 2016
Source: Office for National Statistics
Download this chart Figure 8: TTWAs with the highest and lowest shares of economically inactive who want a job
Image .csv .xlsNearly half (47.0%) of the economically inactive population in Andover in the South East wanted a job. This compares to just 10.8% of the economically inactive population in Luton who wanted a job, the smallest share overall.
Notes for Economic inactivity:
All estimates are derived from samples of the population and are therefore subject to confidence intervals. The confidence intervals for all estimates can be found on Nomis.
Based on data for 159 TTWAs, estimates are unavailable for Northallerton TTWA.
8. Claimant count
The Claimant Count1 measures the number of people claiming unemployment-related benefits. From 2013 this includes all out-of-work Universal Credit claimants as well as all Job Seekers Allowance claimants2.
Hartlepool travel to work area (TTWA) had the largest share of its population (aged 16 to 64) receiving unemployment related benefits at just over 4%, closely followed by Kilmarnock and Irvine in Scotland (3.88%). Merthyr Tydfil had the greatest share of its population receiving unemployment related benefits out of all Welsh TTWAs at 3.1%. These compare to the national Claimant Count rates of 1.8% in England, 2.2% in Scotland and 2.3% in Wales.
Figure 9: TTWAs with the highest and lowest claimant count shares as a percentage of population
Age 16 to 64, Great Britain, April 2015 to March 2016
Source: Office for National Statistics
Download this chart Figure 9: TTWAs with the highest and lowest claimant count shares as a percentage of population
Image .csv .xlsKendal in the North West had the lowest claimant count share at 0.48% of the population. The lowest claimant count share in Wales was in Bridgend (1.95%) and in Scotland, Aberdeen (1.22%).
There were no TTWAs in the South West with greater than 2% of the population claiming unemployment-related benefits; the highest was 1.80% in Torquay and Paignton TTWA. This contrasts with the North East of England where all TTWAs had claimant count shares greater than 2% and Yorkshire and the Humber where nearly three-quarters of TTWAs had greater than 2% of their population claiming unemployment-related benefits. More than half of TTWAs in Scotland and most TTWAs in Wales had greater than 2% of the population in the Claimant Count.
Figure 10: Range of claimant count shares as a percentage of population
For TTWAs in English regions, Scotland and Wales, age 16 to 64, April 2015 to March 2016
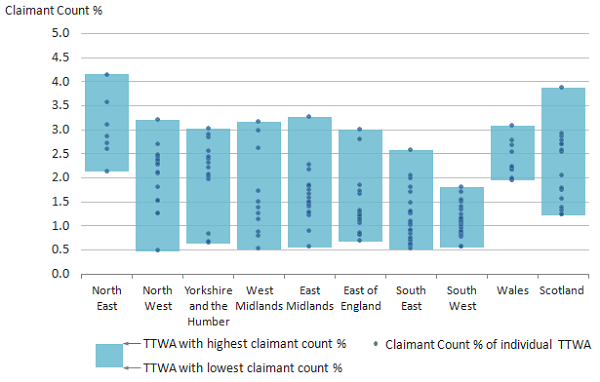
Source: Office for National Statistics
Download this image Figure 10: Range of claimant count shares as a percentage of population
.png (51.4 kB) .xls (96.3 kB)
Notes for Claimant count:
Claimant Count estimates are currently designated as experimental statistics as Universal Credit estimates are still being developed by the Department for Work and Pensions. However, the Claimant Count estimates do provide the best available estimates of the number of people claiming unemployment-related benefits in the UK.
The Claimant Count is the number of people claiming Jobseeker's Allowance plus out of work Universal Credit Claimants on the second Thursday of each month, averaged over a 12 month period.
9. Qualifications
The Annual Population Survey (APS) also collects data on the highest level of qualification attained1. Different types of qualification can be compared by using the equivalent level of National Vocational Qualification (NVQ). NVQ level 4 qualifications are approximately equal to a bachelor’s degree.
Figure 11 shows Oxford travel to work area (TTWA) had the highest share of its 16 to 64 year old residents with an NVQ level 4 qualification or above at 53.5%, closely followed by Edinburgh (53.1%). The highest proportion of the population with an NVQ level 4 qualification or above in Wales was 38.0% in Cardiff.
Figure 11: TTWAs with the highest and lowest shares of residents age 16 to 64 with an NVQ level 4 qualification or above
Age 16 to 64, Great Britain, January to December 2015
Source: Office for National Statistics
Download this chart Figure 11: TTWAs with the highest and lowest shares of residents age 16 to 64 with an NVQ level 4 qualification or above
Image .csv .xlsThe TTWAs with the lowest shares of population with NVQ level 4 qualifications or above were found in the East of England. Clacton had the lowest share at 15.5% of the population, followed by Great Yarmouth (16.3%) and Lowestoft (19.7%).
Dudley TTWA had the highest proportion of 16 to 64 year old residents with no qualifications at 19.2%, following by Bradford with 15.6%. In Scotland, 13.6 % of Kilmarnock and Irvine’s 16 to 64 year old population had no qualifications.
Bath and Taunton in the South West had the lowest shares of 16 to 64 year olds with no qualifications, both at 2.6%, and TTWAs in the South West generally had the lowest shares of 16 to 64 year olds with no qualifications. There were no TTWAs in the North East or North West with less than 8.0% of the 16 to 64 year old population with no qualifications.
Figure 12: Share of population with no qualifications1 for TTWAs by regions and country
Age 16 to 64, Great Britain, January to December 2015
Source: Office for National Statistics
Notes:
- Based on data for 159 TTWAs, estimates are unavailable for Andover TTWA
Download this chart Figure 12: Share of population with no qualifications^1^ for TTWAs by regions and country
Image .csv .xlsNotes for Qualifications:
- All estimates are derived from samples of the population and are therefore subject to confidence intervals. The confidence intervals for all estimates can be found on Nomis.
10. Occupation
The 5 travel to work areas (TTWAs) with the highest shares of population employed by selected occupation groups are shown in Table 6 below1.
Table 6: TTWAs with the highest share of population employed by selected occupation groups, Great Britain, aged 16 to 64, April 2015 to March 2016
| % | |
| 1. Managers, Directors and Senior officials | |
| Salisbury | 18.4 |
| Newbury | 16.8 |
| Falmouth | 16.5 |
| Leamington Spa | 16.1 |
| Banbury | 15.7 |
| 2 + 3. Professionals and Associate Professionals | |
| Oxford | 45.4 |
| Reading | 44.4 |
| Brighton | 43.4 |
| Bristol | 42.1 |
| Basingstoke | 41.5 |
| 5. Skilled Trade | |
| Whitehaven | 20.8 |
| Northallerton | 18.6 |
| Blandford Forum and Gillingham | 18.2 |
| Scarborough | 17.6 |
| Rhyl | 17.4 |
| 6. Caring, leisure and other service | |
| Clacton | 19.7 |
| Lowestoft | 17.9 |
| Haverfordwest and Milford Haven | 15.1 |
| Ayr | 15.0 |
| Wisbech | 14.9 |
| 8. Process plant and machine operatives | |
| Corby | 19.5 |
| Thetford and Mildenhall | 17.2 |
| Wisbech | 16.3 |
| Worksop and Retford | 15.1 |
| Skegness and Louth | 14.3 |
| 9. Elementary Occupations | |
| Wisbech | 23.6 |
| Corby | 21.1 |
| Boston | 18.0 |
| Bridgwater | 17.9 |
| Worksop and Retford | 17.7 |
| Source: Office for National Statistics | |
Download this table Table 6: TTWAs with the highest share of population employed by selected occupation groups, Great Britain, aged 16 to 64, April 2015 to March 2016
.xls (28.2 kB)Salisbury TTWA had the highest proportion of its working population employed in manager, director and senior official roles at 18.4%, compared with 10.4% for the whole of Great Britain. This compares with Thetford and Mildenhall in the East of England where only 5.3% of the working population was employed in these roles.
Nearly half of the working population of Oxford TTWA were employed in professional and associate professional occupations, nearly 3 times the share in Spalding which was the lowest at 16.1%.
Corby and Wisbech TTWAs both had some of the highest shares of their population employed in process plant and machine operatives and elementary occupations. Combined, these professions accounted for approximately 40% of their TTWA’s working population.
Notes for Occupation:
- All estimates are derived from samples of the population and are therefore subject to confidence intervals. The confidence intervals for all estimates can be found on Nomis.
11. Alternative travel to work areas
The travel to work areas (TTWAs) discussed up to this point represent approximate self-contained labour market areas for the working population as a whole. This section introduces alternative TTWAs that have been developed to highlight commuting patterns for different subgroups of the working population. The method used to produce the 2011 TTWAs was applied to origin destination data for subgroups of working people with different population characteristics in the 2011 Census, to create alternative TTWAs by age group, employment type, method of travel to work and highest level of qualification. In other words, a set of TTWAs has been created for each of the subgroups; for example, the 25 to 34 age group TTWAs are calculated only from that subgroup of the population.
Fewer TTWAs for a particular subgroup means the TTWAs are, in general, larger and this indicates that this subgroup has a longer average distance travelled to work. A higher number of TTWAs for a particular subgroup means TTWAs are generally smaller and therefore indicates shorter distances travelled to work.
The alternative TTWAs for each subgroup can be viewed on this interactive map. The Alternative TTWA boundaries in these maps have been generalised but have not been cleaned and, in some places, fragments of TTWAs may appear within others. This reflects the consistent application of the algorithm based methodology. For the main TTWA map, a secondary process was employed to “clean” the results of the algorithm process to ensureeach TTWA is a separate self-contained area with no overlapping or fragmentation. For these alternative TTWAs, this secondary process has not been carried out as the resources required would have been prohibitive. However, they remain an interesting resource that gives some useful additional information on travel patterns to that available from the main TTWA map alone. Our advice, when viewing the maps, is to focus on the more prominent areas as opposed to the occasional small fragments. In general, fragmentary boundaries are mainly in areas where few of that subgroup live or work, for example, areas remote from railways in the analysis of people travelling to work by train.
Alternative TTWAs have been produced for England, Scotland and Wales only.
Age group
Table 7 gives the number of TTWAs for selected age groups. The 25 to 34 age group has the lowest number of TTWAs, suggesting this age group tends to travel the greatest distance to work. For age groups above this, the number of TTWAs increases with age, with the 75 plus category having the highest number of TTWAs of all age groups at 294. This suggests the distance travelled to work falls with an increase in age amongst the older age groups.
Table 7: Number of TTWAs in Great Britain by age group, Census 2011
| Age Group | Number of TTWAs |
|---|---|
| 16 to 24 | 237 |
| 25 to 34 | 163 |
| 35 to 49 | 184 |
| 50 to 64 | 249 |
| 65 to 74 | 264 |
| 75 plus | 294 |
| Source: Office for National Statistics | |
Download this table Table 7: Number of TTWAs in Great Britain by age group, Census 2011
.xls (26.1 kB)London generally forms one large TTWA for the 16 to 24, 25 to 34 and 35 to 49 age groups; however, for the older age groups London is divided into smaller TTWAs. Figure 13 illustrates another example of this pattern for the TTWAs around Cambridge. The TTWA for the 25 to 34 age group borders the TTWA for London, stretching almost to Luton and Chelmsford in the south and Bedford in the west and it is considerably larger than the equivalent Cambridge TTWA for 50 to 64 year olds, overlaid on the map below.
Figure 13: TTWAs for 25 to 34 and 50 to 64 age groups, Cambridge, 2011
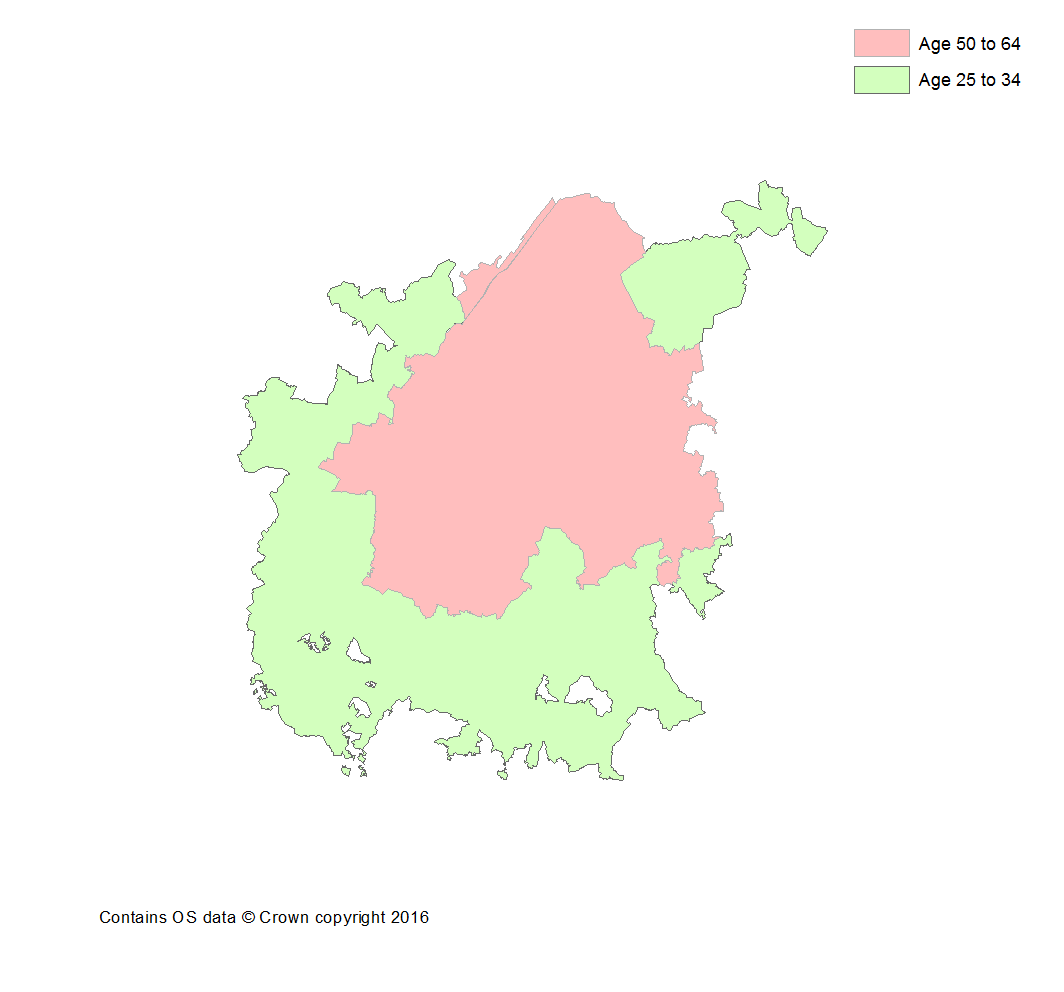
Source: Office for National Statistics
Download this image Figure 13: TTWAs for 25 to 34 and 50 to 64 age groups, Cambridge, 2011
.png (22.4 kB)
Employment type
The number of TTWAs for different employment types is shown in Table 8. Full-time employees generally commute further distances than part-time employees, with almost 2 and a half times the number of TTWAs for full-time employees than part-time employees. This difference is noticeable throughout the country, although TTWAs in Wales appear to show less of a difference in size between TTWAs for full-time employees and part-time employees. London is captured in one TTWA for full-time employees, however is split across 4 TTWAs for part-time employees. Similarly, in Manchester there are 10 TTWAs for part-time employees covering a similar area to a single TTWA for full-time employees.
Table 8: Number of TTWAs in Great Britain by employment type, Census 2011
| Employment type | Number of TTWAs |
|---|---|
| All full time employed | 158 |
| Full time females | 170 |
| Full time males | 166 |
| All part time employed | 390 |
| Source: Office for National Statistics | |
Download this table Table 8: Number of TTWAs in Great Britain by employment type, Census 2011
.xls (26.1 kB)Method of travel to work
Travel to work by train has the fewest and therefore largest TTWAs, with 16 TTWAs covering Great Britain. As a result of numerous parts of the country having very few people commuting by train, these TTWAs include a large amount of fragmentation away from those major cities where rail commuting is substantial. The largest TTWA for train users covers close to the entire East and South East of England. There are 4 other TTWAs for travel to work by train which also have boundaries similar to English regions; they are in the North East, North West, Yorkshire and the Humber and the West Midlands.
Table 9: Number of TTWAs in Great Britain by method of travel to work, Census 2011
| Method of travel | Number of TTWAs |
|---|---|
| Bus | 184 |
| All car users | 134 |
| Car drivers | 131 |
| Car passengers | 225 |
| Train | 16 |
| Source: Office for National Statistics | |
Download this table Table 9: Number of TTWAs in Great Britain by method of travel to work, Census 2011
.xls (26.1 kB)TTWAs for travel by car vary between car passengers and car drivers. Car drivers have fewer TTWAs and therefore generally commute greater distances than passengers. TTWAs for car users are relatively evenly sized throughout Great Britain.
Following car passengers, bus users commute the second smallest distances to work with 184 TTWAs for this method of travel. Bus travel to work is more varied between different parts of Great Britain, with clusters of smaller TTWAs around London and the South East and larger TTWAs in the more rural East of England and Scotland.
Qualifications
The size of TTWAs, and therefore the distance travelled to work, increases with a higher level of qualification. The number of TTWAs for those with a low level of qualification1 (416) is over 2 and a half times the number of TTWAs for those with a high level of qualification (153).
Table 10: Number of TTWAs in Great Britain by highest level of qualification Census 2011
| Level of Qualification | Number of TTWAs |
|---|---|
| High | 153 |
| Medium | 304 |
| Low | 416 |
| Source: Office for National Statistics | |
Download this table Table 10: Number of TTWAs in Great Britain by highest level of qualification Census 2011
.xls (26.1 kB)Figure 14 illustrates the difference between TTWAs for the different qualifications groups by showing the size of each of these alternative TTWAs overlaid and centred on Brighton. The far greater size of the TTWAs for those with high qualifications compared with low qualifications is clearly visible.
Figure 14: TTWAs for low, medium and high qualifications, Brighton, 2011
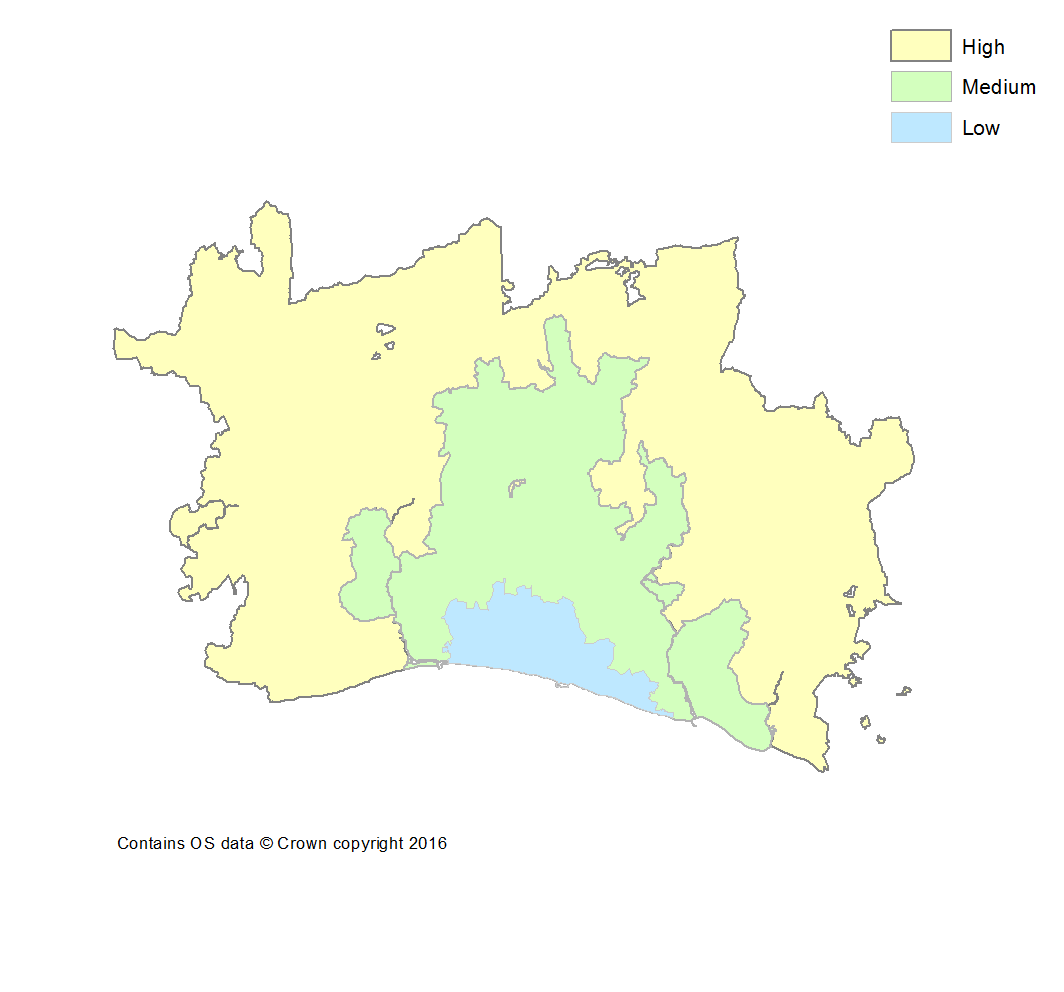
Source: Office for National Statistics
Download this image Figure 14: TTWAs for low, medium and high qualifications, Brighton, 2011
.png (24.2 kB)
The distinction between the size of the TTWAs for high-skill and low-skill workers gives a visual illustration of the point that, on average, high-skill workers commute longer distances than low-skill workers.
Notes for Alternative travel to work areas:
- High qualifications include level 4 qualifications or above (degree level), medium qualifications include level 2 and 3 qualifications and low qualifications include level 1 qualifications or below.