1. Introduction
Automation is of increasing importance to society, reflecting that the job market is changing composition. This article describes the methodology used by the Office for National Statistics (ONS) for producing estimates of the probability of automation for 2011 and 2017. We describe previous studies that have examined the impact of automation, before outlining the ONS approach. We present analysis of the probability of automation by demographic variables and highlight the skills and tasks that are at risk of automation within jobs.
Back to table of contents2. Previous studies
Frey and Osborne, 2013
The 2013 Oxford University study by American academics Frey and Osborne (PDF, 1.09MB) provides a blueprint for examining the impact of automation. Other studies either build on this approach or try to replicate its methodology. Frey and Osborne used the O∗NET, an online database of US job descriptions, to develop a machine learning algorithm that estimates the “probability of computerisation” for different occupations. The algorithm was fed with 70 occupations, which were labelled in the following way.
Artificial intelligence experts assigned 1 to those that they agreed were fully automatable, else assigned 0. This was aided by answering: “can the tasks of this job be sufficiently specified, conditional on the availability of big data, to be performed by state of the art computer-controlled equipment”.
Frey and Osborne then assigned scores corresponding to the levels of, as they call it, “engineering bottlenecks”. This refers to the tasks that cannot be substituted by machines in the near future. Perception and manipulation, creativity, and social intelligence are all considered more robust to computerisation. So, for example, you would expect that jobs that involve performing open heart surgery, composing music or looking after children are less likely to be automatable. The “probability of computerisation” indicates the likelihood of an occupation being automated, based on these inputs. Frey and Osborne estimate that 47% of jobs in the US are at high risk of being automated within 10 to 20 years. Transferring this methodology to UK data generates an estimate of 35% of jobs.
Organisation for Economic Co-operation and Development (OECD) study (Arntz and others, 2016)
The OECD study by Arntz, Gregory and Zierahn (PDF, 1013KB) was motivated by a sensible criticism. Automation aims at certain tasks, rather than whole occupations and by taking an occupation-based approach, the Frey and Osborne study doesn’t account for the fact that different jobs within an occupation vary considerably in their task make-up. Junior consultants spend more time doing admin and less time advising clients than more senior consultants. However, these are the same occupations with the same O∗NET descriptions and so they are given identical risk ratings by Frey and Osborne.
Arntz, Gregory and Zierahn’s task-based approach uses the OECD’s Survey of Adults Skills (PIAAC), which contains individual-level data on the task composition of jobs. By transferring Frey and Osborne’s findings to more granular data, and using this to estimate the automatability of workplace tasks, they overcome this criticism. Critically, their predictions are based on the task composition of jobs both across and within occupations.
The OECD study estimate is more conservative than Frey and Osborne: across 21 OECD countries, only 9% of jobs are at high risk of automation. The potential for automating entire occupations is said to be much lower because certain parts of these “bundles of tasks” are very difficult to automate. For example, Frey and Osborne estimate retail assistants are highly automatable, yet only 4% perform their jobs without social interaction.
Arntz, Gregory and Zierahn predict that more jobs are likely to experience change than be automated. In the UK, this is 25% and 10% respectively. Change is likely when 50 to 70% of tasks are automatable, automation is likely when more than 70% of tasks are automatable.
PwC and McKinsey’s studies
In what might bring the debate full circle, PwC offer a technical criticism of the OECD study (PDF, 1.09MB). PwC agree with their substantive objection but suggest their model over-estimates the difference a task-based approach makes. In an appendix, they show that by using a different set of predictive features, with improved performance metrics, the results more closely match the occupation-based approach. PwC estimate that 38% of US and 30% of UK jobs are at high risk of automation.
McKinsey’s task-based approach appears to corroborate the OECD study. They use the same data and a similar methodology to Frey and Osborne but disaggregate occupations into tasks and capabilities before getting input from experts. The result: fewer than 5% of all occupations are at risk of full automation. However, this is based on a threshold of being at high risk of automation set at 100% rather than the 70% adopted by the other studies. If changed to 70%, their model suggests around 30% of jobs are automatable, a figure similar to PwC.
Back to table of contents3. The Office for National Statistics (ONS) approach
We apply a modified version of the Organisation for Economic Co-operation and Development (OECD) methodology, which accounts for the fact that high risk occupations contain a share of tasks that would be difficult to automate.
The initial data sources used are the UK Programme for the International Assessment of Adult Competencies (PIAAC data) and the Frey and Osborne probabilities of automation (converted to UK SOC2010 codes). The UK PIAAC data is a sample of 8,892 individuals and each individual has a probability of automation assigned using the Frey and Osborne probabilities. However, the PIAAC data contains two digit occupation codes, and the Frey and Osborne probabilities are at four digit occupation code level. Therefore, each individual in the PIAAC data is assigned multiple probabilities of automation.
The first step is to regress the automation probability y on the N job characteristics x. For each replication j of individual i:
We are estimating the β values in the above equation, to determine the influence of each job characteristic on the probability of automation. We then use these parameters to predict the probability of automation y ̂i for each individual. By comparing the automation probabilities yij " in the first step" with the new probabilities, we estimate the likelihood that yij is the true automation probability. This algorithm is run until the weights converge and we arrive at a final probability of automation for each individual.
The next stage is to map our results to the Annual Population Survey (APS). The APS has a larger sample size than PIAAC. This is advantageous as it allows us to complete demographic analysis at a much more granular level. However, the APS doesn’t include the task variables which are crucial to the analysis. We therefore predict the probability of automation for individuals on the APS using observed characteristics common to APS and PIAAC datasets. Another regression is run, this time predicting the relationship between demographic variables on PIAAC and the probability of automation. The resulting β values are then mapped onto the APS and used to predict an individual’s probability of automation.
The variables in this mapping model, ordered by their significance (though all with p values less than 0.05), are:
major occupation group
education level
whether responsible for supervising staff
five-year age band
gender
industry sector
full or part time
public or private sector
firm size
region
As mentioned in the review of previous studies of automation, the OECD approach focuses attention on the tasks carried out within occupations rather than the whole occupation approach adopted by Frey and Osborne. This gives a very different distribution of the probabilities of automation for both approaches, as shown in Figure 1.
Figure 1: The distribution of probabilities of automation for different approaches
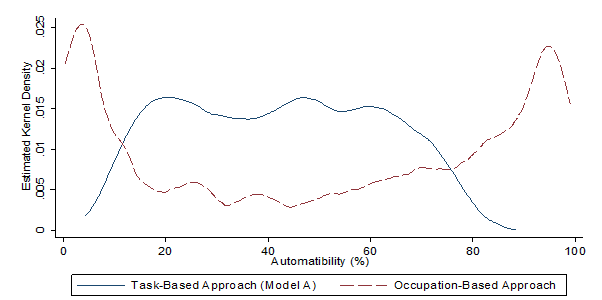
Source: Arntz et al. (OECD paper)
Notes:
- Chart taken from page 15 of the OECD paper referenced in footnote number 2
Download this image Figure 1: The distribution of probabilities of automation for different approaches
.png (7.6 kB)
The occupation-based Frey and Osborne approach produces results at the extreme ends of the probability distribution due to the way that probabilities are assigned to whole occupations. The task-based OECD approach results in more probabilities centred around the middle of the distribution, as there are fewer occupations at very low and very high risk, reflecting the fact that occupations have tasks within them that are more or less susceptible to automation.
We have replicated both the Frey and Osborne and OECD approaches using APS data. In our publication and in this article we produce estimates based on the OECD approach only. The disadvantage of this approach is we are only able to produce estimates for England, due to the small sample sizes in the PIAAC data for Scotland and Wales. However, estimates for these countries can be produced using the Frey and Osborne methodology (though not discussed here).
Our analysis included just under 20 million occupations in England in 2017; due to our methodology, this does not equal the total working population, or the total number of jobs, in England in 2017. Due to the statistical modelling techniques used, any observations with a missing value for any characteristics could not be included in the regression analysis. Distributional analysis was undertaken to test that our remaining population of 20 million observations closely matched the distribution of the total population.
Back to table of contents4. Findings from the Office for National Statistics (ONS) approach
The calculation of probabilities of automation for individuals on the Annual Population Survey (APS) allows us to produce detailed demographic breakdowns, by taking the average probability of automation within each demographic group. To produce probabilities of automation at four digit occupation level on the APS, we created a pooled dataset of seven years of APS data (2011 to 2017), to ensure the sample sizes were large enough to calculate a probability for each four digit occupation code.
We then group the probabilities of automation in three categories: low risk of automation for probabilities lower than 30%, medium when the probability falls between 30 and 70%, and high risk if the probability is greater than 70%.
In 2017, out of the 19.9 million jobs analysed in England, 7.4% (1.5 million) people were employed in jobs at high risk of automation; a fall in absolute terms of 46,000 employees, 0.7% fewer when compared with 2011. Conversely, the number of employees that were in jobs at low risk of automation in 2017 was 5.5 million, equating to 27.7% of all employees, a rise of 2.4% since 2011.
Figure 2: Proportion of main jobs at risk of automation
England, 2011, 2014 and 2017
Source: Annual Survey Population, UK Survey of Adult Skills (PIAAC) and Frey and Osborne
Download this chart Figure 2: Proportion of main jobs at risk of automation
Image .csv .xlsIf we isolate the 20 occupations with the highest probability of automation, we would expect employment to decrease in these occupations as automation starts to take place. However, this is not the case across all occupations – some have experienced an increase in employment between 2011 and 2017. On the contrary, occupations where the employment share has decreased slightly may show that automation could have, to some extent, already occurred within these occupations.
Figure 3a: Percentage increase in employment (main job) for the occupations at highest risk of automation
England, 2011 to 2017
Source: Annual Survey Population, UK Survey of Adult Skills (PIAAC) and Frey and Osborne
Notes:
- We have taken the 20 occupations with the highest risk of automation and calculated the employment growth from 2011 to 2017.
Download this chart Figure 3a: Percentage increase in employment (main job) for the occupations at highest risk of automation
Image .csv .xls
Figure 3b: Percentage decrease in employment (main job) for the occupations at highest risk of automation
England, 2011 to 2017
Source: Annual Survey Population, UK Survey of Adult Skills (PIAAC) and Frey and Osborne
Notes:
- We have taken the 20 occupations with the highest risk of automation and calculated the employment growth from 2011 to 2017.
Download this chart Figure 3b: Percentage decrease in employment (main job) for the occupations at highest risk of automation
Image .csv .xlsWhen looking at those in jobs with a high risk of automation, women account for 70.2% of employees in those jobs. This compares with women accounting for 42.6% of employees in jobs at low risk of automation.
Figure 4: Proportion of main jobs at risk of automation by sex
England, 2017
Source: Annual Survey Population, UK Survey of Adult Skills (PIAAC) and Frey and Osborne
Download this chart Figure 4: Proportion of main jobs at risk of automation by sex
Image .csv .xlsPeople in part time positions account for 69.9% of all employees in jobs at high risk of automation. This compares with just 11% of jobs at low risk of automation being held by part time employees.
Figure 5: Proportion of main jobs at risk of automation by working pattern
England, 2017
Source: Annual Survey Population, UK Survey of Adult Skills (PIAAC) and Frey and Osborne
Download this chart Figure 5: Proportion of main jobs at risk of automation by working pattern
Image .csv .xlsOverall, in 2017, younger people were proportionally more likely to be working in jobs at high risk of automation since over 45% of the high risk jobs were held by people between the ages of 20 and 30 years. More specifically, young people aged 20 to 24 years have the highest proportion of jobs at high risk of automation of all age bands, 15.7%. However younger workers are often in high risk roles temporarily, moving to roles at a lower risk of automation as their careers develop. In general, the labour market is very dynamic with people moving between jobs frequently.
The share of people in jobs at high risk of job automation then decreases as workers get older – due possibly to workers gaining experience and skills – and the probability of automation is lowest for workers between 35 and 39 years. Just 1.3% of people in this age bracket are at high risk of automation. The risk then increases from the age group 40 to 44 years upwards.
Figure 6: Proportion of main jobs at risk of automation by age band
England, 2017
Source: Annual Survey Population, UK Survey of Adult Skills (PIAAC) and Frey and Osborne
Download this chart Figure 6: Proportion of main jobs at risk of automation by age band
Image .csv .xlsIn 2017, 36.4% (7.3 million) of employees in their main job were educated to degree level, 8.6% (1.7 million) to higher education, 43.2% (8.6 million) to A level or GCSE and 11.8% (2.3 million) to lower than GCSE level.
From the jobs at low risk of automation, 87% were held by employees with a degree, while employees with lower education than GCSEs and those with A level or GCSEs made up most of the jobs at high risk of automation, 59.8% and 39% respectively. These results show there is some correlation between risk of automation and the level of education.
Figure 7: Proportion of main jobs at risk of automation by education
England, 2017
Source: Annual Survey Population, UK Survey of Adult Skills (PIAAC) and Frey and Osborne
Download this chart Figure 7: Proportion of main jobs at risk of automation by education
Image .csv .xlsThe probability of automation has a linear relationship with the proportion of employees in high-skill jobs. As the proportion of employees in high-skill occupations increases, the probability of automation decreases. For those industries where half of the workforce or more are high-skill their probability of automation is at least under 35%.
Figure 8: Probability of automation by the proportion of employees in high-skill jobs for industries
England, 2017

Source: Annual Survey Population, UK Survey of Adult Skills (PIAAC) and Frey and Osborne
Notes:
- Note that some industries have been removed due to small sample sizes.
Download this image Figure 8: Probability of automation by the proportion of employees in high-skill jobs for industries
.png (73.6 kB) .xlsx (17.8 kB)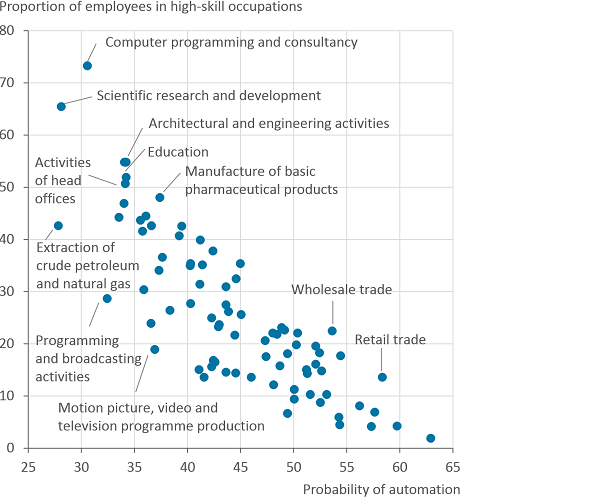
When considering where people work, most regions with a low probability of automation are concentrated in the South East of England and London, with an increase in the number of areas with a low probability of automation across the country in 2017 compared with 2011.
Figure 9: Probability of automation by place of work, England, 2011 and 2017
Embed code
Notes
- These maps exclude Isles of Scilly due to small sample sizes.
5. Skills and tasks at risk of automation
The next phase of the analysis was to identify the skills that are at risk of automation, rather than the occupations. We isolate the 50 occupations at the highest and lowest risk of automation, and look at the skills and tasks involved in these roles.
The skills and tasks for each occupation were taken from the 2010 Standard Occupational Classification (SOC) manual, which describes the typical tasks involved in each four digit SOC (see Annex A for an extract). Using natural language processing, the most common skills and tasks in the SOC descriptions were identified, for occupations at both high and low risk of automation.
Skills at high risk of automation
Figure 10 shows the 20 most frequently occurring words in the task descriptions of occupations at high risk of automation and how frequently they occur.
Figure 10: Words associated with occupations at high risk of automation
Source: Annual Survey Population, UK Survey of Adult Skills (PIAAC) and Frey and Osborne
Download this chart Figure 10: Words associated with occupations at high risk of automation
Image .csv .xlsThe most frequently occurring words reflect fairly routine and manual occupations, which is to be expected. These words in isolation aren’t particularly informative – that is, describing “operate” as a task that is at high risk of automation doesn’t tell you a great deal, for example, you can operate various types of machinery, equipment, or processes that are at varying degrees of automability. The tasks and skills give the impression of manufacturing and manual occupations when considered as a group of words, rather than singular words.
Skills at low risk of automation
Figure 11 shows the 20 most frequently occurring words in the task descriptions of occupations at low risk of automation.
Figure 11: Words associated with occupations at low risk of automation
Source: Annual Survey Population, UK Survey of Adult Skills (PIAAC) and Frey and Osborne
Download this chart Figure 11: Words associated with occupations at low risk of automation
Image .csv .xlsWords relating to management, planning and advisory skills are seen to be the most prevalent in tasks involved in low risk occupations. Health related words such as patient and treatment also appear frequently. These words reflect working with people and represent the value added by humans in these roles, which is difficult to computerise.
Back to table of contents6. Acknowledgements
The authors are grateful to Joshua Rawlings, Vahé Nafilyan, and Fero Hajnovic for their contributions and advice throughout this analysis.
Back to table of contentsContact details for this Article
Policy.Evidence.Analysis@ons.gov.uk
Telephone: +44 (0)1633 651663