1. Main points
In the first calendar quarter (January to March) of 2019, the number of people in employment in the UK increased by 99,000 on the quarter to 32.70 million.
The number of UK nationals aged 16 years and over who were in employment increased by 190,000 to 28.9 million.
The unemployment rate for men decreased by 0.2 percentage points to 3.9% and that for women decreased by 0.1 percentage points to reach a record low of 3.7%.
The growing number of vacancies, together with the falling number of unemployed people, indicate further tightening of the labour market.
The number of self-employed workers increased by 90,000 to reach a record high of 4.93 million in the three months to March 2019.
2. Economic overview
The UK’s departure from the EU was extended to the end of October 2019, but it might happen earlier than that if there is an agreement before that date. The extension was granted to enable the UK government to agree on an exit deal from the EU. The Bank of England reported that shifting expectations about EU exit are leading to volatility in the economy and, on 2 May 2019, the Bank’s Monetary Policy Committee voted unanimously to keep the bank rate unchanged. It also reported that the uncertainty associated with EU exit is adversely impacting on business investment.
The latest gross domestic product (GDP) figures show that in the first calendar quarter (January to March) of 2019, the economy grew by 0.5%, which is 0.3 percentage points higher than in the fourth calendar quarter (October to December) of 2018. The production sector grew by 1.4% and the manufacturing sector grew by 2.2%.
In the full financial year to the end of March 2019, public sector net debt (excluding public sector banks) constituted 83.1% of GDP. On the trade front, the UK’s total trade deficit (goods and services) increased by £8.9 billion to £18.3 billion in the three months to March 2019. The trade in goods deficit increased by £1.7 billion to £25.7 billion with EU countries and by £4.7 billion to £17.6 billion with non-EU countries. The widening deficit indicates that imports increased faster than exports.
Growth in UK retail sales accelerated to 1.6% on the quarter in the first calendar quarter of 2019. On a year-on-year basis, retail sales increased by 6.7% in March 2019. Nearly 20% of the sales were conducted online. The growth in online retail sales may be contributing to the closure of stores on the high street. Employment in the retail sector is dominated by women and the closure of stores may disproportionately affect female workers.
Broadly, the UK labour market continues to perform well, with growing employment and declining unemployment and economic inactivity.
Back to table of contents3. Employment, unemployment and inactivity
Employment
The latest Labour Force Survey (LFS) estimates show that in the first calendar quarter (January to March) of 2019, the seasonally-adjusted number of people in employment in the UK increased by 99,000 on the quarter to 32.7 million. Over the same period, the employment rate increased by 0.2 percentage points to 76.1%.
The increase in employment was driven more by the increase in the number of women (114,000) to 15.42 million. The number of employed men decreased by 15,000 on the quarter to 17.28 million. This was the first such decrease since the period August to October 2017.
The employment rate for women increased by 0.4 percentage points to a joint record high of 71.8% in the first calendar quarter of 2019. That for men was largely unchanged, at 80.3%.
People in employment can be classified as employees or as self-employed. This classification excludes people classified as unpaid family workers and those in government-sponsored training programmes. The number of employees increased by 3,000 on the quarter to 27.59 million. In the year to March 2019, the number of employees increased by 168,000.
The number of women who were employees increased by 96,000 on the quarter to reach 13.71 million. The number of men who were employees reduced by 93,000 on the quarter to 13.88 million.
The number of self-employed workers increased by 90,000 on the quarter to reach a record high of 4.93 million. This was the largest quarterly increase since the period March to May 2016. The increase in the number of self-employed workers was driven by men who increased by 78,000 on the quarter to reach a record high of 3.31 million. The number of self-employed women increased by 12,000 on the quarter to reach 1.62 million.
The number of self-employed people has been growing over time. Figure 1 shows the percentage of self-employed workers in total employment. It shows that the proportion of the workforce who are self-employed has trended upward since 2000.
Figure 1: The percentage of self-employment in total employment had an upward trend since 2000
Percentage of self-employment in total employment, UK, seasonally adjusted, March to May 1992 to January to March 2019
Source: Office for National Statistics – Labour Force Survey
Download this chart Figure 1: The percentage of self-employment in total employment had an upward trend since 2000
Image .csv .xlsFigure 1 shows that the percentage of self-employment in total employment increased steadily between 2000 and 2014, from an annual average of 11.9% to 14.8%. Between 2015 and the first calendar quarter of 2019, it averaged 14.8%. In the three months to March 2019, the percentage of self-employed workers in total employment was 15.1%. We analyse self-employment in greater detail later.
Employment by nationality
The UK labour market is quite diverse and employs people of different nationalities. The Office for National Statistics publishes data on employment by nationality. The data must not be used as a source of migration data.
The latest estimates show that the number of UK nationals aged 16 years and over who were in employment in the first calendar quarter of 2019 increased by 190,000 to 28.9 million. The number of non-UK nationals aged 16 years and over who were in employment increased by 178,000 to 3.7 million.
The non-UK nationals can be grouped into EU nationals and non-EU nationals. EU nationals constituted 64% of non-UK nationals in employment.
In the three months to March 2019, the employment rate of UK nationals increased by 0.5 percentage points to 76.1%. The employment rate for non-UK nationals increased by 1.2 percentage points to 75.3% over the same period.
The employment rate of non-UK nationals can be disaggregated by country of nationality as shown in Figure 2. The latest data show that the nationalities that had the highest employment rates were South Africans (91.4%), Australians and New Zealanders (82.7%) and the nationals of the United States (78.3%).
Workers with Bangladeshi and Pakistani nationalities had the lowest employment rate (50.9%). A 2018 report by the Department for Work and Pensions (DWP) on ethnicity facts and figures shows the same outcome for Bangladeshi and Pakistani nationalities relative to other ethnic minorities. An earlier study by the DWP (in 2006) on employment barriers faced by Pakistanis and Bangladeshis in Britain examined the reasons for the skewed labour market outcomes.
Figure 2: The nationals of Bangladesh and Pakistan had the lowest employment rates
Employment rates of non-UK nationals, not seasonally adjusted, January to March 1997 to January to March 2019
Source: Office for National Statistics – Labour Force Survey
Download this chart Figure 2: The nationals of Bangladesh and Pakistan had the lowest employment rates
Image .csv .xlsThere are several possible reasons for the differences in employment rates of different nationalities. For instance, people from countries where the English language is the main language of communication tend to have higher employment rates. Education, skills and cultural integration may also influence the employment rates of different nationalities. Cultural integration can increase networks that are important for securing employment. In some cases, discrimination and prejudice may result in lower employment rates, especially among ethnic minorities. A research report by the DWP on discrimination in recruitment practice (PDF, 324KB) analysed the different types of ethnic minority penalties in the UK labour market.
Unemployment
Unemployment in the UK has been declining steadily since 2011. In the three months to March 2019, the number of people who were unemployed decreased by 65,000 to 1.3 million. This was the largest quarterly decrease since September to November 2016.
The unemployment rate decreased by 0.2 percentage points to reach 3.8%. This represents continuing firming of the labour market. The unemployment rate for men decreased by 0.2 percentage points to 3.9% and that for women decreased by 0.1 percentage points to reach a record low of 3.7%.
As with employment, we can disaggregate unemployment by nationality. The latest Labour Force Survey data show that the number of UK nationals who were unemployed in the year to March 2019 decreased by 124,000 to 1.1 million. The number of unemployed non-UK nationals increased by 1,000 to 185,000 over the same period.
Categorising non-UK nationals as EU nationals and non-EU nationals shows that the number of unemployed EU nationals fell by 3,000 to 86,000 and that of non-EU nationals increased by 4,000 to 99,000. EU workers had a lower unemployment rate (3.5%) than UK nationals (3.7%) and non-EU nationals had the highest unemployment rate (7.0%).
Economic inactivity
Economic inactivity is one of the three labour market statuses. People who are economically inactive are outside the labour force (that is, they are neither employed nor unemployed). The latest Labour Force Survey data show that in the three months to March 2019, the number of people in the UK who were economically inactive decreased by 23,000 to 8.61 million. Over the same period, the inactivity rate fell by 0.1 percentage points to 20.8%.
The inactivity rate can be disaggregated by sex to show that men’s economic inactivity rate increased (by 0.2 percentage points to 16.3%) and women’s inactivity rate decreased (by 0.3 percentage points to a joint record low of 25.3%) in the first calendar quarter of 2019. The last time that the inactivity rate for men increased was in the three months to August 2018.
The people who were economically inactive can be categorised by reason for inactivity. There are seven categories: students, the long-term sick, the temporarily sick, discouraged workers, those looking after family or home, the retired, and those who were inactive for “other” reasons. In the three months to March 2019, the numbers of students, the long-term sick and the temporarily sick decreased. Over the same period, the numbers of those who retired, those looking after family or home, the discouraged, and those that were inactive for “other” reasons all increased.
The structure of economic inactivity in the three months to March 2019 is illustrated in Figure 3.
Figure 3: Students constituted the largest proportion of economically inactive people
Reasons for economic inactivity, UK, seasonally adjusted, January to March 2019

Source: Office for National Statistics – Labour Force Survey
Download this image Figure 3: Students constituted the largest proportion of economically inactive people
.PNG (25.4 kB) .xls (5.1 kB)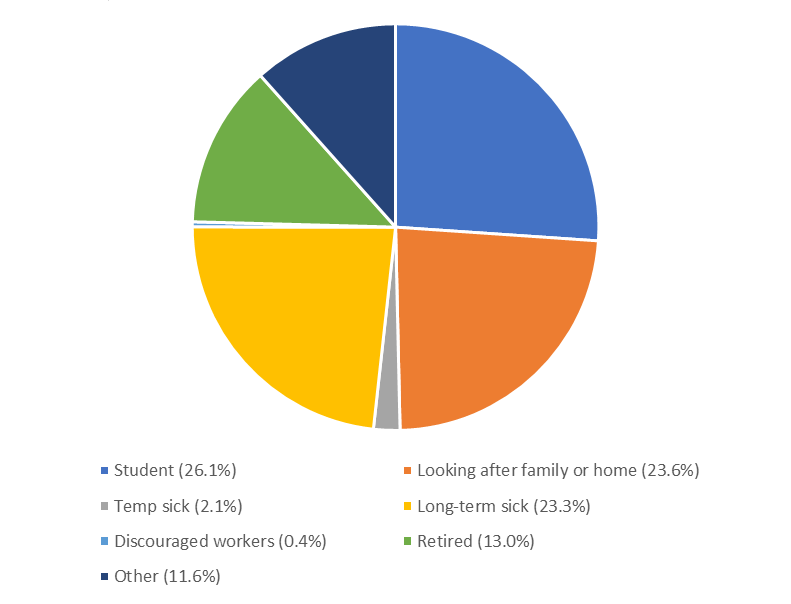
Figure 3 shows that students constituted the largest group of economically inactive people, followed by those looking after home or family and those on long-term sickness. The smallest two groups were discouraged workers and the temporarily sick.
Back to table of contents4. Vacancies and redundancies
The UK economy has been characterised by a growing trend of vacancies and a declining trend of redundancies.
The Labour Force Survey data show that in the first calendar quarter (January to March) of 2019, there were 850,000 vacancies in the economy. Most of the vacancies were in the services sector (752,000).
The sectors that had vacancies greater than 60,000 were:
wholesale and retail trade, repair of motor vehicles and motor cycles, with 139,000 vacancies
human health and social work activities, with 134,000 vacancies
accommodation and food, with 92,000 vacancies
professional, scientific and technical activities, with 80,000 vacancies
manufacturing, with 61,000 vacancies
The lowest numbers of vacancies were in water supply, sewerage, waste and remediation activities (4,000), electricity, gas, steam and air conditioning supply (3,000) and mining and quarrying (1,000).
Figure 4 plots the trends of unemployment and vacancies. The growing number of vacancies, together with falling unemployment, may be an indication that firms are increasingly facing challenges in recruiting suitable workers.
Figure 4: The gap between unemployment and vacancies has been narrowing
Vacancies and unemployment levels, UK, seasonally adjusted, April to June 2001 to January to March 2019
Source: Office for National Statistics – Labour Force Survey
Download this chart Figure 4: The gap between unemployment and vacancies has been narrowing
Image .csv .xlsIf we take the number of unemployed people to indicate the supply of labour and the number of vacancies to indicate the demand for labour, Figure 4 shows that there has been a narrowing of the gap between labour demand and labour supply.
Even if vacancies and unemployment numbers equal each other, there will always be a certain level of friction and mismatch in the labour market. For example, the gap between the demand and supply of labour (that is, there will always be a certain number of unemployed people) is a result of labour market friction associated with job changes. People in long-term unemployment lose part of their human capital and networks, and some unemployed people lack the skills required in existing jobs.
Despite the growing number of vacancies, some employers are making their workers redundant. For instance, latest data show that 1,000 workers were made redundant to bring the total number of redundancies to 92,000 in the three months to March 2019.
Disaggregating redundancies by sex shows that the number of men who were made redundant increased by 9,000 to 57,000 and that of women fell by 8,000 to 36,000.
There are many reasons why firms make workers redundant. For example, the closure of retail outlets on the high street, uncertainly of the business operating environment and the winding-up of business operations all contribute to redundancies.
Back to table of contents5. Earnings
The latest data on average weekly earnings for Great Britain indicate that nominal total average weekly pay (which includes bonus payments) increased by 3.2% on the year to reach £528 in March 2019. Over the same period, nominal regular average weekly pay (which excludes bonus payments) increased by 3.3% on the year to reach £498.
The private sector, which employed 82% of the workforce, experienced accelerating total average weekly pay growth (of 0.2 percentage points) in the year to March 2019. Pay growth is described as accelerating (decelerating) if the growth rate in the year to March 2019 was higher (lower) than the growth rate in the year to March 2018.
The services sector, as a whole, experienced accelerating total average weekly pay growth as, in particular, did the finance and business services sector. However, average weekly pay growth decelerated in manufacturing, construction, and the wholesale, retailing, hotels and restaurants sectors.
Average weekly pay growth accelerated in the public sector including financial services but once financial services are excluded, the public sector saw a reduction in pay growth.
The variation in total average weekly pay growth was driven by the differences and changes in bonus payments across sectors of the economy. We can exclude the impact of bonuses on pay by focusing our analysis on regular average weekly pay. In the year to March 2019, regular average weekly pay growth accelerated in the private sector, driven by accelerated growth in total services, finance and business services, and wholesale, retailing, hotels and restaurants sectors. Regular average weekly pay growth decelerated in the public sector (both including and excluding financial services) and in the manufacturing and construction sectors. Public sector bonus payments are driven by the financial services component of the sector.
Comparative analysis of sectoral regular average weekly pay shows that the wholesale, retailing, hotels and restaurants sector was paying below the economy’s average (that is, £334 compared with £498). Low pay in the sector has adverse impact on the living standards of the workers in that sector.
Four sectors paid above the economy’s regular average weekly pay. These were:
public sector excluding finance (£527)
manufacturing (£585)
finance and business services (£601)
construction (£603)
6. Self-employment in the UK
The people in employment can be categorised as employees (if they receive wages or salaries from employers) or as self-employed (if they work for themselves). This categorisation excludes unpaid family workers and people on government-supported training and employment programmes. In this section, we focus on self-employed workers.
In general, self-employed workers face higher risks and uncertainty about the stability and flow of their incomes than employees. Self-employed workers tend to earn less than employees doing similar work, and they also tend to work longer hours. However, self-employed workers have greater control over their work-life balance and have greater work flexibility. They can choose to work on a part-time or full-time basis. People who have other responsibilities beyond work (for example, childcare or pursuing a passion) may choose to become self-employed because self-employment allows them to allocate their time as they desire.
Self-employment increased significantly between 1980 and 1995, and again from 2000 onwards. Our analysis of long-term trends in UK employment in the April 2019 Economic review examined the changes to the self-employment rate since 1861. The analysis indicated that self-employment decreased during the inter-war period and reached the lowest rate of 7% in 1945. The percentage of self-employment in total employment first exceeded 14% in 2012 and in 2018, it averaged 15%.
The analysis pointed out that the growth in self-employment is partly explained by changes in technology. For instance, the rise of the “gig economy” in recent times has been driven by new technology platforms that make it easier for people to become self-employed. The technology has decoupled jobs from location and people can now work from anywhere, any time.
The structure of self-employment is broad. It includes the conventional situation of people who work for themselves or independent contractors (for example, builders and plumbers) and people who work through online platforms (classified as the “gig” economy). The last group of workers constitutes the supply of labour to what is known as task-based demand for labour.
Self-employment can also be disaggregated into non-dependent and dependent self-employment. Dependent self-employment is when own-account workers generally have one dominant client. Non-dependent self-employment is when own-account workers do not have a dominant client. The UK-published statistics do not make this distinction, but the Organisation for Economic Co-operation and Development (OECD) does.
The latest data show that the number of people who were self-employed in the first calendar quarter of 2019 (January to March) increased by 90,000 on the quarter to reach a record high of 4.93 million. Between March 2018 and March 2019, the number of self-employed people increased by 180,000.
A larger proportion of self-employed people worked on a full-time basis (71%) than on a part-time basis (29%). Of the self-employed that worked on a full-time basis, 78% were men and 22% were women. Of those that worked on a part-time basis, 60% were women and 40% were men.
If we analyse each sex category separately, we observe that more men worked on a full-time basis (83%) than on a part-time basis (17%). For women, part-time working (53%) dominated full-time working (47%). These statistics show that women who were self-employed tended to work on a part-time basis, while men tended to work on a full-time basis. This may not be surprising as women are more involved in providing childcare, which requires flexibility, than men. In general, fewer men than women engage in caring activities in the home.
There are different concentrations of self-employment in different industries in the economy. If we classify industries into primary (consisting of agriculture, forestry and fishing), secondary (consisting of manufacturing, construction, electricity, gas and air-conditioning supply, and water supply, sewerage and waste), tertiary (consisting of all the services sectors) industries, we can show which industries have higher concentrations of self-employment as illustrated in Figure 5.
Figure 5: Self-employment was concentrated in the tertiary industry category’
Self-employment in different industries, UK, seasonally adjusted, January to March 2019
Source: Office for National Statistics – Labour Force Survey
Download this chart Figure 5: Self-employment was concentrated in the tertiary industry category’
Image .csv .xlsThe latest data show that in the first calendar quarter of 2019, the majority of self-employment, 71%, was in the tertiary industry. Self-employment in the primary industry constituted 3.8% of all self-employment, and 25.2% was in the secondary industry.
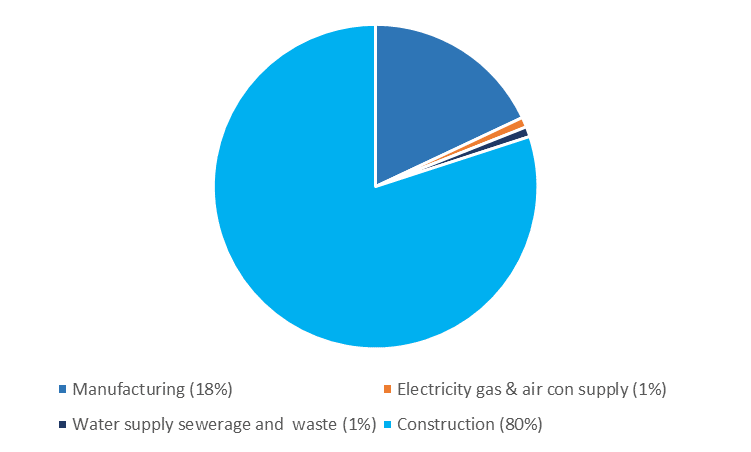
We can further disaggregate the secondary industry category into its component sectors as shown in Figure 6. The largest sub-sector of the secondary industry category in terms of self-employment was construction, followed by manufacturing.
Figure 6: Construction sector self-employment was the highest in the secondary industry
The self-employment structure of the secondary industry, UK, seasonally adjusted, January to March 2019
Source: Office for National Statistics – Labour Force Survey
Download this image Figure 6: Construction sector self-employment was the highest in the secondary industry
.png (19.0 kB) .xls (4.6 kB)
Looking at the economy as whole, we observe that self-employment in the construction sector dominated that in all other sectors. In the three months to March 2019, construction was the largest employer of self-employed workers (20.3%), followed by the professional, scientific and technical activities sector (12.8%), distribution (7.9%), administration and support services (7.3%) and transport and storage and health and social work (6.5% apiece).
The construction sector is very important to the UK economy because of its contribution to output and to employment. A report by the former Department for Business, Innovation and Skills in 2013 examined the structure and contribution of the sector to the UK economy (PDF, 423KB).
The report identified construction activities as consisting of contracting and service activities. The contracting activities include the construction of buildings, civil engineering and specialised activities like plumbing and electrical installations. The service activities include architectural and quantity surveying, wholesale of wood, construction materials, plumbing and heating equipment. The skills requirements, which vary from elementary to advanced, determine the structure and level of self-employment in the sector. Based on the published data, it is not possible to tell which of the different activities drive(s) the growth of self-employment in the sector.
Although the construction sector had the most self-employed workers, the growth of self-employment was higher in other sectors. Figure 7 plots indices of employment in the six largest sectors by self-employment since 2006.
The figure shows that self-employment in the administration and support services, and the professional, scientific and technical services sectors grew the most between 2006 and 2019. Self-employment in the distribution sector declined between November 2017 and November 2018 but increased thereafter to slightly below its June to August 2006 level. In the first calendar quarter of 2019, the following happened to self-employment:
construction sector self-employment increased by 9,000 to 999,000
distribution sector self-employment increased by 30,000 to 389,000
transport and storage self-employment increased by 18,000 to 323,000
professional, scientific and technical services self-employment increased by 43,000 to 633,000
administration and support services self-employment increased by 3,000 to 362,000
health and social work activities self-employment decreased by 2,000 to 318,000
Figure 7: Self-employment grew fastest in the administration and support, and the professional, scientific and technical services sectors
Self-employment indices in the top six sectors by self-employment, UK, seasonally adjusted, June to August 2006 to January to March 2019
Source: Office for National Statistics – Labour Force Survey
Download this chart Figure 7: Self-employment grew fastest in the administration and support, and the professional, scientific and technical services sectors
Image .csv .xlsDisaggregating industrial self-employment numbers by sex shows that there were more men than women in all sectors except in health and social work, education, household employment, and other service activities sectors.
The average ratio of the number of men to women in self-employment is two men for every woman. There are six sectors in which the ratio is greater than the average. These are manufacturing (3), finance and insurance (3), agriculture, forestry and fishing (4), information and communication (4), transport and storage (11) and construction (25). The higher the ratio, the more male-dominated the sector is.
There are several possible explanations for the dominance of men in the transport and storage, and construction sectors. Historically, the two sectors have been male-dominated and this alone may discourage some women from joining. Women may experience prejudice when they join the sectors. For instance, in the construction sector, some of the reasons why women may be fewer include bullying and harassment (especially in manual trades)1, improperly adapted safety equipment (PDF, 547KB) and the general cultural belief that women may not be able to perform physical work as well as men.
In the transport sector, there is less representation of women in technical jobs (for example, drivers and pilots), which may be because of barriers from both the employer and employee perspectives.
The European Commission (2018)’s report on the ‘business case to increase female employment in transport (PDF, 3.87MB)’ tabulated the types of barriers faced by women, from an employee perspective. These include:
discrimination and stereotyping (for example, gender discrimination and stereotypes)
working conditions (for example, work-life balance, safety and sexual harassment)
shortages of competences (for example, physical demands and investment needs for education and training)
Notes for: Self-employment in the UK
- Tessa Wright (2013) Uncovering sexuality and gender: an intersectional examination of women’s experience in UK construction, Construction Management and Economics, 31:8, 832-844, DOI: 10.1080/01446193.2013.794297