1. Main points
Between October to December 2018 and October to December 2019, the level of employment increased by 336,000 (or 1.0%) to a record high of 32.93 million.
Over the same period, the level of unemployment reduced by 73,000 (or 5.4%) to 1.29 million.
For the first time since March 2008, real regular average weekly earnings exceeded the highest level reached before the economic downturn (2008 to 2009).
The private to public sector ratio of total pay was 0.99 in December 2019, indicating near-equalisation between the sectors' total pay.
The job finding rates from unemployment and from economic inactivity had upward trends from 2011 onwards but flattened between 2016 and 2019.
2. Overview of the UK labour market
The UK labour market remains robust. Between October and December 2019, employment increased by 336,000 (or 1.0%) compared with the same period a year ago. This took the level of employment to a record high of 32.93 million. Over the same period, unemployment reduced by 73,000 (or 5.4%) to 1.29 million, and economic inactivity reduced by 155,000 (or 1.8%) to 8.48 million. The Bank of England's (BoE's) Monetary Policy Report (MPR) for January 2020 argued that the robust employment growth together with low unemployment and economic inactivity mean the economy is facing a future of falling labour market slack and rising unit labour costs.
While the labour market remains robust, economic growth between October to December 2018 and October to December 2019 was subdued. The latest gross domestic product (GDP) figures show that there was no growth between October and December 2019. Growth in the services and construction sectors was offset by a fall in production, resulting in 0.0% GDP growth. The BoE's MPR for January 2020 indicated that economic growth slowed in 2019 because of Brexit-related uncertainties and weak global growth. The weak global growth was a product of growing protectionism and trade uncertainty. However, global growth has stabilised, partly because of easing trade tensions between the US and China. The return of global growth is very important for the UK's manufacturing and exporting sectors. Improving international trade conditions can boost business confidence and employment in the economy.
The most recent external economic indicators' reports highlighted that Brexit-related uncertainty and political uncertainty reduced. Business expectations became more positive after the general election on 12 December 2019, according to the IHS Markit and CIPS UK Manufacturing Purchasing Managers' Index (PMI) report for February 2020. However, the BoE's latest survey of UK business, taken after the 2019 general election, suggested that uncertainty remains elevated, especially because of:
the possible introduction of tariffs and other trade barriers
the possible border disruptions
labour mobility restrictions
the potential cliff-edge at the end of 2020 if there is no agreed trade deal
All these factors impact on labour market outcomes in the economy. They may cause firms to hire fewer people and reduce the number of vacancies. In the year to November 2019 to January 2020, the number of vacancies decreased by 50,000 to 810,000 vacancies. The decrease in the number of vacancies mainly occurred in the manufacturing and the information and technology sectors, which experienced reductions of 10,000 vacancies each.
The MPR for January 2020 stated that in 2019, job-to-job moves and demand for new recruits declined even though fewer people were being made redundant. Between October and December 2019, redundancies fell by 10,000 to 109,000. There was a larger reduction in redundancies (of 14,000 to 45,000) among women than among men (who experienced an increase of 4,000 to 63,000).
External indicators show improving hiring conditions
The KPMG and REC UK report on jobs pointed to a brighter future than the MPR. The report stated that there was the strongest increase in permanent placements for over a year in January 2020, and vacancies (especially for permanent staff) increased at their quickest pace since March 2019. Permanent vacancies rose in the private sector but fell slightly in the public sector. There was weak growth in temporary placements. However, pay growth was weaker, with "permanent starting salaries rising at the softest pace for three-and-a-half years". The report highlighted concerns over the current low unemployment, which indicates shrinking labour supply and will likely worsen skills shortages and increase unit labour costs. This view is supported by the British Chambers of Commerce's (BCC's) Quarterly Recruitment Outlook, which suggested that the recruitment difficulties being experienced by the BCC's members may be a result of persistent skills shortages in the labour market, which contributes to low productivity.
The IHS Markit and CIPS UK Manufacturing PMI report for February 2020 stated that the UK manufacturing sector stabilised at the beginning of the year after persistent declines in 2019. The improvement in the manufacturing sector raised employment and business confidence and stopped the nine-month trend of sectoral employment losses. As a result, manufacturing vacancies increased by 4,000 in the three months to November 2019 to January 2020. The services sector also showed strong recovery because of rising demand. The IHS Markit and CIPS UK Services PMI Business Activity Index reported that business activity increased and firms were more willing to employ additional staff, with job creation in the sector at its strongest since mid-2019. Between November 2019 and January 2020, the number of vacancies in the transport and storage; education; and arts, entertainment and recreation sectors increased by 5,000 each.
Back to table of contents3. Latest labour market estimates
The changes in the labour market continued to be mainly driven by women
In our labour market economic commentary for September 2019, we highlighted the transformation of the women's labour market. This continues to be the case with the number of women in employment increasing by 150,000 in the three months to October to December 2019 to a record high of 15.61 million. The employment rate for women increased by 0.6 percentage points to reach a record high of 72.4%. Although the number of men who were in employment increased (by 30,000 to a record high of 17.33 million), the rate of increase was slower. The annual increase in the number of employed men of 39,000 between October to December 2018 and October to December 2019 was the lowest since February to April 2012.
Women have been driving the growth in full-time employment, as shown by selected indicators in Figure 1. Figure 1 shows the indices of full-time employment (which consists of employees and self-employed workers) and of employees disaggregated by sex. It shows that the full-time employment growth rate for women has consistently been stronger than that of men, particularly from 2015 onwards.
Figure 1: The number of women in full-time employment increased at a faster rate than that of men
Indices of full-time employment and employees (2012=100), UK, seasonally adjusted, between October to December 2012 and October to December 2019
Source: Office for National Statistics – Labour Force Survey
Download this chart Figure 1: The number of women in full-time employment increased at a faster rate than that of men
Image .csv .xlsBetween October to December 2012 and October to December 2019, the number of women in full-time employment increased by 17.8%, while that of men increased by 9.2%. These changes resulted in the ratio of women to men in full-time employment increasing from 0.57 in 2012 to 0.62 in 2019. The change was partly associated with more women than men leaving part-time employment and joining full-time employment and more men joining part-time employment.
The number of women who worked as employees increased by 1.26 million to 13.80 million in the seven years to October to December 2019. That of men increased by 1.09 million to 13.93 million. In 2019, the number of women who were employees grew by 0.11% while that of men declined by 0.03%.
More women than men left economic inactivity
Women have also been joining the labour force at a faster rate than men. The number of economically inactive women reduced by 122,000 between July to September 2019 and October to December 2019 to a record low of 5.16 million. The economic inactivity rate for women reduced to a record low of 24.8%. Over the same period, the number of economically inactive men reduced by 16,000 to 3.32 million, with an economic inactivity rate of 16.1%. The gap between the inactivity rates of men and women has been falling, from around 13 percentage points in 2008 to around 9 percentage points in 2019. This has been driven by a falling economic inactivity rate for women compared with a relatively flat economic inactivity rate for men. Various factors could have contributed to this shift, including the increase in the State Pension age and the equalisation of State Pension ages for men and women. The changes to the welfare and childcare system may also have persuaded more women than men to join the labour market.
There are fewer unemployed women than men
Although the fall in the level of unemployment between July to September 2019 and October to December 2019 was driven by men (which reduced by 24,000 on the quarter to 707,000), the number of unemployed women (582,000) was lower than that of men between 1992 and 2019 (except in the period November 2017 to January 2018). In addition, the unemployment rate for women (at 3.6%) was lower than that of men (at 3.9%).
Back to table of contents4. Average weekly earnings
Average weekly earnings can either be total pay (including bonuses) or regular pay (excluding bonuses). In the year to December 2019, nominal total pay (not adjusted for change in prices) grew by 2.9% to £544. Nominal regular pay grew by 3.2% to £512 over the same period. The recorded growth rates show that wage growth is decelerating.
For the first time since March 2008, real regular average weekly earnings exceeded the highest level reached before the economic downturn
Average weekly earnings can be adjusted for inflation to obtain their real values. Real pay is indexed to 2015 prices. In December 2019, real total pay increased by 1.4% on the year to £503.
Real regular pay increased by 1.8% to £474 between December 2018 and December 2019. This was the first time that real regular pay exceeded the pre-downturn peak of £473 recorded in March 2008. However, the annual rate of growth of both total and regular pay slowed down in recent months.
Public sector average weekly earnings growth was higher than private sector average weekly earnings growth
In the public sector, regular average weekly earnings grew by 3.4% to £548 between December 2018 and December 2019. Over the same period, private sector earnings grew by 3.2% to £504. The ratio of private to public sector regular average weekly earnings was 0.92, indicating that public sector regular average weekly earnings are 9% higher than private sector earnings.
Total average weekly earnings for the public sector increased by 3.3% to £550 in the year to December 2019. Those for the private sector grew by 2.7% to £542. The ratio of private sector total pay to public sector total pay was 0.99, which indicates greater equalisation between the sectors than indicated by regular pay.
Back to table of contents5. The flows of labour between employment, unemployment and economic inactivity
People in the labour market fall under one of the three statuses of employment, unemployment and economic inactivity. The employment status can be disaggregated into "employee" status and "self-employment" status. There is constant churning of people between the three labour market statuses. The behaviour of labour flows between labour market statuses drives the quarterly changes of the headline labour force survey aggregates.
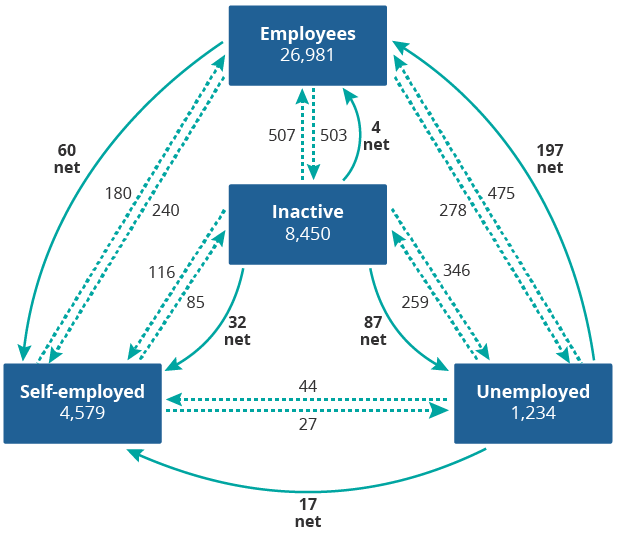
The flows between labour market statuses are illustrated in Figure 2. The straight arrows between economic statuses indicate the direction of flows into and out of the respective economic statuses, and curved arrows indicate the direction of net flows. The employees, inactive, self-employed and unemployed figures indicate the stocks of people who did not change their labour market statuses in the last two quarters of 2019, between July and December 2019.
Figure 2 shows that there was a net flow of 60,000 from employee status to self-employment status. One of the possible reasons for this is that older workers easing themselves into retirement do so mainly by becoming self-employed.
Figure 2: Quarterly flows between economic status (thousands)
Not seasonally adjusted, age 16 to 64 years, UK, between July to September 2019 and October to December 2019
Source: Office for National Statistics – Labour Force Survey
Notes:
- The methodology used to produce weights for the longitudinal labour force survey (LFS) datasets from which flows data are produced has been reviewed to achieve greater consistency with the cross-sectional LFS estimates. The changes were applied to data from April to June 2012 onwards. Further details on the changes are discussed in our article 'Improvements to the weighting methodology used in the Labour Force Survey longitudinal datasets'.
Download this image Figure 2: Quarterly flows between economic status (thousands)
.png (39.6 kB)
Figure 2 shows that more people left employee status (1,021,000) than any other stock. This was closely followed by inactivity, which saw 969,000 movers. Unemployment saw gross outflows of 778,000, while the self-employment status saw gross outflows of 292,000. Gross flows indicate the volume of movement from a particular labour market status.
The employee status saw the largest net flow (141,000) followed by self-employment (108,000). Both unemployment and economic inactivity experienced net outflows of 126,000 and 123,000 respectively.
Labour market flows and the business cycle
The intensity of flows of workers between the three labour market statuses differs with the business cycle fluctuations. When the economy is growing or recovering from a downturn, employment grows as people move from unemployment and inactivity into employment. As the economy grows further and earnings begin to rise, more people tend to leave economic inactivity to join the labour force.
Periods of economic contraction are often characterised by job losses with people becoming unemployed or economically inactive. The duration of job search tends to be lengthy; together with rising unemployment, this may lead some workers to become discouraged workers.
An important variable associated with labour market churning is the job finding rate
The job finding rate is defined as the fraction of unemployed workers in one period who find jobs in the consecutive period. The rate measures how easy (or difficult) it is to find jobs in the economy. There are also people who join employment from being economically inactive. Another part of the job churning equation is people who move from one job to another in consecutive periods. While job-to-job moves do not increase the employment rate, such moves are important because they indicate the confidence level in the labour market. They also contribute to pay growth.
We publish labour market flows hazard rates, some of which can be interpreted as the job finding rates when there is a change of status. The hazard rate measures the probability distribution of the transition mechanism from one labour market status to another. It estimates the relative "risk" of an event occurring (in this case, the transition from one status to another). Where the hazard rate and the job finding rate are the same, they both estimate the relative probability of a transition occurring from any of the three labour market statuses to employment. This means we can calculate the probability of finding employment while one is employed – alternatively called the job-to-job rate. We therefore calculate the trends of three job finding flows as follows:
the job finding rate from unemployment in one quarter to employment in a consecutive quarter
the job finding rate from economic inactivity in one quarter to employment in a consecutive quarter
the rate of moving from one job in one quarter into another job in a consecutive quarter
The job finding rate from unemployment has been increasing
Figure 3 shows the increasing probability of workers moving from unemployment to employment over time. The increasing probability of unemployed people becoming employed is consistent with the growing level of employment and the declining level of unemployment in the economy.
Figure 3 shows that the job finding rate from unemployment reached a peak of 31.7% between July and September 2005. It generally decreased between 2005 and 2010, when it reached its lowest value of 19.9% between January and March 2010. The job finding rate has had an upward trend since then, with a sharp increase between April to June 2018 and October to December 2019.
Figure 3: The job finding rate from unemployment increased sharply from mid-2018 onwards
The job finding rate from unemployment, not seasonally adjusted, UK, October to December (2001 to 2019)
Source: Office for National Statistics – Labour Force Survey
Download this chart Figure 3: The job finding rate from unemployment increased sharply from mid-2018 onwards
Image .csv .xlsThere are several possible explanations why unemployed people are increasingly likely to become employed. The fall in unemployment has been driven by more women than men joining employment. Another possible reason for people joining employment from unemployment is the change to the social benefits system that a Resolution Foundation report described as having become less generous. The changes may have caused some people to seek employment. In addition, the tightening labour market over recent periods has caused firms to spend more on recruitment.
The job finding rate from economic inactivity has trended upward since 2013
There is generally a high concentration of households where nobody has a job in the economic inactivity status. Our recent publication on working and workless households in the UK showed that between July and September 2019, 13.5% of UK households were classified as workless and 86.2% of them were economically inactive. Jobless households often experience income insecurity and poverty. The movement from economic inactivity to employment is therefore an important step towards improving household incomes and exiting poverty. However, Joseph Rowntree Foundation (JRF) reported that despite the rise in employment, in-work poverty has increased, in part because of changes to the benefits system. This indicates that adequate employment compensation is necessary for income security and for poverty reduction.
Since the beginning of 2013, the probability of economically inactive people becoming employed had an upward trend, as shown in Figure 4.
Figure 4: The job finding rate from economic inactivity had a positive trend from 2013 onwards
Job finding rate from economic inactivity, not seasonally adjusted, UK, October to December (2001 to 2019)
Source: Office for National Statistics – Labour Force Survey
Download this chart Figure 4: The job finding rate from economic inactivity had a positive trend from 2013 onwards
Image .csv .xlsThe job finding rate from economic inactivity is lower than that from unemployment because inactive people do not actively look for jobs. The direct transitions from economic inactivity to employment occur within the quarter when economically inactive people transition into unemployment and get employed before the survey. With the labour market continuing to tighten, firms may now be intensifying their efforts to reach people who are marginally attached to the labour market.
There are several possible reasons why people leave economic inactivity for employment. First, a large proportion (over 25%) of economically inactive people are students, who frequently change their labour market status. Secondly, some of the reasons for people moving from economic inactivity to employment are like those for moving from unemployment to employment. Some factors that may cause people to leave economic inactivity for the labour force therefore include attractive average wages, reforms to the social welfare system, and better health. Improved provision of childcare services, especially the introduction of 30 hours free childcare for some 3- and 4-year-olds in 2016, makes it possible for stay-at-home parents to join the labour market. Changes to the social benefits system may have caused some people to join the labour force too.
In some regions of the UK, local administrations have interventions to boost employment. For example, in 2015, the administration in Northern Ireland developed the 'Enabling Success' strategy for reducing economic inactivity and unemployment. The strategy targeted the main limiting factors that kept people out of the labour force. The strategy had six themes:
to improve engagement and support
improve employment opportunities
address wider barriers to employment
break the cycle of economic inactivity
improve information flow
strategically manage the partnership between the different stakeholders
Women have been driving the changes in all labour market statuses
A notable feature of the labour market over the past 10 years has been the remarkable growth of women's participation in the labour market. The movements from unemployment and economic inactivity discussed earlier have been largely driven by women. The Institute for Fiscal Studies' (IFS's) study, 'The rise and rise of women's employment in the UK, examined some of the reasons why more women are getting employed.
More women than men have been leaving economic inactivity to join the labour force. Two of the reasons for the movement are increasing employment flexibility and improved childcare provision, which allowed women to join the labour market. Examples of flexible working that may have attracted more women into employment include flexible working arrangements, such as job sharing, part-time working, working from home, flexitime working and annualised hours. The Employment Rights Act 1996 allowed workers to apply for flexible working from their employers, the effect of which continues to increase in the economy.
Women still dominate some categories of economic inactivity, including looking after family or home (1.66 million women compared with 225,000 men), long-term sick (1.11 million women compared with 964,000 men), and retired (621,000 women compared with 501,000 men). However, there has been a steady decrease in the number of women looking after family or home, from 2.13 million between January and March 2012 to a record low of 1.66 million between October and December 2019. The decrease is partly a result of more men (3,000 between 2012 and 2019) taking up caring responsibilities in the home and increasing labour market opportunities for women.
Job-to-job moves as part of the job finding rate was broadly flat between 2016 and 2019
Another component of churning in the labour market is the movement of workers from one job to another. We publish the job-to-job moves of people aged 16 to 69 years. Job-to-job moves increase when there are many vacancies available. A market with many unfilled vacancies can be labelled a sellers' market because workers would be having more control (market power) over where they want to work. The opposite is a buyers' market, where there are very few unfilled vacancies and employers have a large pool of workers to choose from and can therefore become very selective.
Figure 5 shows the trend of the ratio of job-to-job moves in total employment. In the UK, the number of job-to-job moves decreased during the economic downturn (2008 to 2009) and has been on an upward trend since mid-2009. However, between 2016 and 2019, job-to-job moves were relatively flat, making up an average of 2.5% of employment.
Figure 5: The trend of job-to-job moves was broadly flat between 2016 and 2019
Job-to-job moves of people aged 16 to 69 years as a proportion of total employment, not seasonally adjusted, UK, October to December (2001 to 2019)
Source: Office for National Statistics – Labour Force Survey
Download this chart Figure 5: The trend of job-to-job moves was broadly flat between 2016 and 2019
Image .csv .xlsIn recent periods, job-to-job moves have been pushing up earnings growth, as highlighted in the Bank of England's (BoE's) Monetary Policy Report (MPR) for January 2020. This could be a sign that the tightening of the labour market, which is characterised by a shrinking reserve pool of labour, is pushing up employment costs and is causing labour shortages.
Back to table of contents