1. Main points
The UK unemployment rate decreased by 0.2 percentage points to 4.3% in the three months to September 2017, compared with the three months to June 2017.
Although the employment rate decreased (by 0.1 percentage points) in the three months to September 2017, it is still up by 0.6 percentage points compared with a year ago.
The inactivity rate increased by 0.3 percentage points to 21.6% in the three months to September 2017.
Real wages decreased by 0.5% (excluding bonuses) and by 0.4% (including bonuses) in the three months to September 2017 compared with a year earlier.
An examination of the relationship between wages and industrial composition shows that between 2016 and 2017, two service sectors: accommodation and food (I) and transport and storage (H), were major contributors to employee jobs, but both were associated with relatively weak performance in median wage.
2. Main labour market indicators
UK unemployment rate still at joint lowest since 1975 but employment falls slightly
Latest estimates from the Labour Force Survey show that the number of unemployed people fell by 59,000 to 1.42 million in the three months to September 2017 (Figure 1) compared with the three months to June 2017. The UK unemployment rate declined by 0.2 percentage points to 4.3% in the three months to September 2017, compared with the three months to June 2017. By age category, unemployment decreased across all age groups except for those aged 65 and over.
Figure 1: Unemployment rate and changes in employment level
UK, seasonally adjusted, July to September 2001 to July to September 2017
Source: Office for National Statistics, Labour Force Survey
Download this chart Figure 1: Unemployment rate and changes in employment level
Image .csv .xlsFigure 1 shows that the number of people in work decreased for the first time since August to October 2016. In the three months to September 2017, the total employment level fell by 14,000 on the previous quarter to 32.06 million. For men, employment fell by 37,000 in the three months to September 2017 compared with the previous quarter, whereas for women it increased by 23,000 during the same period.
In the three months to September 2017, the number of employees decreased by 10,000 on the previous quarter whereas the number of self-employed increased by 4,000. By age category, employment increased for three age groups: 25 to 34, 50 to 64 and 65 and over, while employment decreased for three age groups: 16 to 17, 18 to 24 and 35 to 49. For women aged 25 to 34 years, employment was at a record high in the three months to September 2017. Although the employment rate decreased by 0.1 percentage points in the three months to September 2017, on the previous quarter, it is still up by 0.6 percentage points compared with a year ago.
In the three months to September 2017, a slight fall in employment was accompanied by an increase in the inactivity level of 117,000. The inactivity rate increased by 0.3 percentage points in the three months to September 2017 on the previous quarter to 21.6%. Total weekly hours decreased by 5.3 million to 1.03 billion. Average actual weekly hours for all workers decreased by 0.2 to 32.1 hours. The average hours for part-time workers remained at 16.3 hours.
The number of vacancies was up slightly compared with May to July 2017 and up 24,000 compared with a year earlier. There were 780,000 job vacancies for August to October 2017. The industrial sector showing the largest vacancy rate was accommodation and food (I) with 4.1 vacancies per 100 filled employee jobs.
Nominal earnings increased by 2.2% (excluding and including bonuses) in the three months to September 2017 compared with a year earlier, however, it fell by 0.5% (excluding bonuses) and 0.4% (including bonuses) in real terms. This is because its rate of increase was less than that of the higher underlying inflation (Consumer Prices Index including owner occupiers’ housing costs (CPIH) which has risen to 2.8% in September 2017).
Back to table of contents3. Wages and unemployment
Improvements in labour market indicators such as employment and unemployment rates are signals of relatively well performing labour markets and the economy overall. One puzzling exception has been the sluggish rise in wages. While wage growth typically rises as unemployment falls, more recently this relationship didn’t seem to materialise. One argument as to why this may be the case over the past year is that the unemployment rate does not adequately capture the true extent of spare capacity in the economy. In other words, it has been argued that developments in labour supply may have lowered the “natural” rate of unemployment.
Therefore, most analysis so far focused on estimating the potential slack in the labour market, for example, by trying to understand the degree of underemployment, the nature of inactivity as well as magnitude and direction of flows between employment, unemployment and inactivity. Less emphasis has been placed on the compositional effects on wage growth. Hence, the rest of the analysis in this commentary focuses on the relationship between the industrial composition of the UK economy and wages.
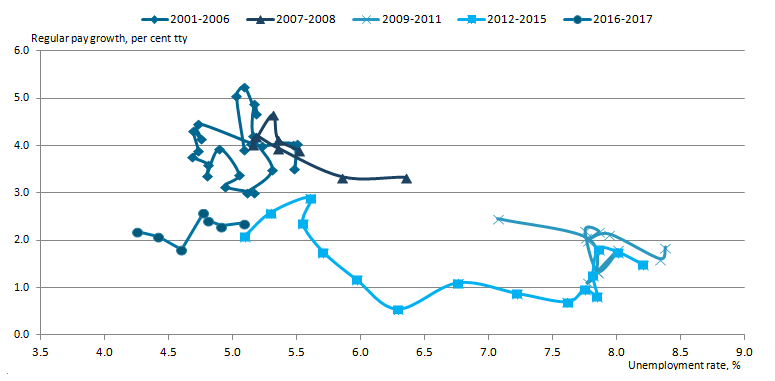
Figure 2 represents the wage Phillips curve, which illustrates the relationship between unemployment and wage growth. Standard economic theory, as depicted by the Phillips curve, proposes that there is a trade-off between wage growth and unemployment. Wage growth increases when the unemployment rate falls and vice versa.Figure 2 illustrates this relationship broken into five time periods (2001 to 2006, 2007 to 2008, 2009 to 2011, 2012 to 2015 and 2016 to 2017). However, during the most recent period (2016 to 2017), as shown in Figure 2, the expected relationship between unemployment and nominal wage growth has been muted.
In the last two years unemployment has returned and outperformed its pre-downturn rates, however, nominal wage growth appeared far weaker compared with its pre-downturn growth trend recorded between 2001 and 2007. Based on the relationship between unemployment and pay growth between 2001 and 2007, nominal wage growth should currently lie somewhere between 3% and 5%. This is notably higher than current nominal wage growth, which stands at 2.2%.
Figure 2: Wage Phillips curve
UK, seasonally adjusted, January to March 2001 to July to September 2017
Source: Office for National Statistics, Labour Force Survey and Monthly Wages and Salaries Survey
Notes:
- Regular pay growth only includes employees 1 in Great Britain.
Download this image Figure 2: Wage Phillips curve
.png (21.3 kB) .xlsx (13.6 kB)
Figure 2 indicates that the Phillips curve appears to have shifted left in 2016 and 2017. It also seems to have changed its shape; far from being vertical in the long run, in more recent times it appears to have resembled more of a horizontal line or a kinked line. However, between 2001 and 2007 a low unemployment rate (below 5.6%) corresponded with higher regular pay growth of 3%, whereas during 2007 to 2008 when unemployment rose to 6.4% in the three months to December 2008, wage growth fell to 3.3% during the same period.
Between 2009 and 2011, unemployment increased above 7% (except for November to January 2011 and December to February 2011 when it was lower than 7%) but wage growth remained between 1% and 3.1%. Between 2012 and 2015, unemployment began to fall and nominal wage growth reached 2.9% in the three months to June 2015.
Notes for: Wages and unemployment
- Due to data limitations all the analysis in this commentary covers employees only and excludes self-employed.
4. Wages and industrial composition
An important question is what explains the more recent observed relationship between wages and unemployment? A related question is whether there may be a compositional effect affecting this relationship? The compositional effect relates to the idea that wage growth can be affected by the characteristics of those in employment. For example, new workers joining the workforce may have lower wages than existing workers. In this case average wages in the economy will be pushed down.
Total compositional effect is often measured as an effect of a range of workers’ characteristics such as: education, job tenure, age and the type of job the employee is doing. Less often the compositional effect is analysed in the context of the structural change in the economy where, in particular, more jobs may have been created in low-pay industries (this would exert downward pressure on the average wage).
Moreover, most analysis of the relationship between wages and unemployment uses the average earnings, which may exaggerate the stickiness of low wage inflation. Analysis in the next section aims to address these gaps. It uses alternative wage series from the Annual Survey of Hours and Earnings (ASHE) based on median wages, which should therefore suffer less from composition effects. It should be noted that ASHE is a survey of employers that covers 1% of employees, hence it lacks information on the self-employed. Please bear this in mind in particular when interpreting results for industries that have a relatively high number of self-employed.
Figure 3 shows year-on-year (June 2016 to June 2017) employee jobs growth by sector in the private economy1 . Accommodation and food (I) and transport and storage (H) saw the largest gains in employee jobs (positive 73,000 and 59,000 respectively), whereas real estate (L) and wholesale and retail trade (G) saw a decrease in employee jobs (negative 26,000 and 1,000 respectively).
The more interesting dynamics emerge when industries that are traditionally associated with foreign demand are considered. Accommodation and food services (I), associated with the tourism sector, saw marked gains in employee jobs, while manufacturing, associated with potentially greater export demand from the recent depreciation of sterling, marked a more modest increase (positive 22,000).
Figure 3: Change in employee jobs by industry
UK, seasonally adjusted, June 2016 to June 2017
Source: Office for National Statistics
Download this chart Figure 3: Change in employee jobs by industry
Image .csv .xlsMedian weekly pay grew by 2.3% in the year to April 2017 for all employees, matching growth in 2016, but a rise in inflation meant that the real wage growth fell by 0.6%. Beyond the underlying trend for the whole economy, Figure 4 shows some marked sectoral differences in median and mean pay growth for employees.
In the year to April 2017, the median wage in transport and storage (H) (the second largest contributor to employee jobs) decreased by 0.1%, whereas this sector’s mean wage increased by 1.2% (Figure 4). This suggests that the overall wage increase in this sector was driven by those employees earning higher than the average wage. Figure 4 also shows that the highest growth in median wage was recorded in financial and insurance (K) and accommodation and food (I) (6.2% and 4.9% respectively). Despite the relatively large increase in median wage in accommodation and food (I), it should be noted that this growth stems from a low base.
Figure 4: Change in median and mean weekly wages by sector
UK, April 2016 to April 2017
Source: Office for National Statistics, Annual Survey of Hours and Earnings
Download this chart Figure 4: Change in median and mean weekly wages by sector
Image .csv .xlsThe median wage for Accommodation and food (I), the largest contributor to employee jobs, was £2443, which is about half of the total economy median weekly wage. In April 2017, Transport and storage (H), which contributed the second largest number of employee jobs between 2016 and 2017, paid a median wage of £529 per week, which was higher than the total economy median weekly wage of £449 (Figure 5).
In addition, Construction (F), Manufacturing (C), Financial and insurance (K) and Professional, scientific and technical services (M) all paid higher than the total economy median wage (£560, £545, £672 and £592 respectively) and contributed to employee jobs creation between 2016 and 2017. The highest 10% of earners in Financial and insurance (K) earned about twice as much as the highest 10% of earners among all employees, whereas the bottom 10% of all employees earned more than twice as much as the bottom 10% of employees in Accommodation and food (I).
Figure 5: Box plot of distribution of pay by industry
UK, April 2017

Source: Source: Office for National Statistics, Annual Survey of Hours and Earnings
Download this image Figure 5: Box plot of distribution of pay by industry
.png (15.0 kB) .xlsx (11.3 kB)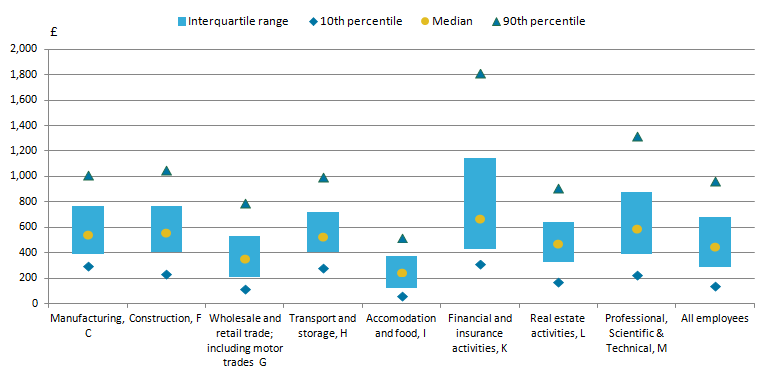
In summary, the two sectors that contributed the largest number of employee jobs between April 2016 and April 2017 were accommodation and food (I) and transport and storage (H). Although the median wage in accommodation and food (I) increased by 4.9% from 2016 to 2017, this increase stems from a low base. The median wage in transport and storage (H) actually decreased between 2016 and 2017. These findings suggest that, over the past year, most jobs have been created in the two sectors with relatively weakly performing median wage.
The results are, however, partially offset by the performance in construction (F) and manufacturing (C) (the second and the third largest contributors to employee jobs), which both saw an increase in employee median wage. These results suggest that industrial composition does matter for pay.
Notes for: Wages and industrial composition
In addition to public sector, analysis also excludes agriculture, forestry and fishing (A), mining and quarrying (B) and electricity, gas and water supply (E) due to the relatively low number of employees in these three sectors.
Changes in mean wage based on ASHE should be interpreted with caution given sampling variability between periods.
Figures for median and mean wage are rounded to the nearest pound (£).