1. Summary
Estimates of the number of employment contracts that do not guarantee a minimum number of hours are derived from our experimental biannual survey of businesses. They are complemented by estimates from the Labour Force Survey (LFS), a survey of households, presenting the number of people who report that they are on a “zero-hours contract” in their main job. This report includes the latest figures from the LFS for October to December 2017, first published in February 2018, as well as new estimates from the survey of businesses for November 2017.
The results from the November 2017 survey of businesses indicated that there were 1.8 million contracts that did not guarantee a minimum number of hours, where work had actually been carried out under those contracts. This represented 6% of all employment contracts. The equivalent figures for November 2016 were 1.7 million and 6%. The number of contracts that did not guarantee a minimum number of hours has increased on the year; however, their share of total contracts used is unchanged. The comparison between November 2016 and November 2017 needs to be treated with caution as the survey was changed from a voluntary survey to a compulsory survey between these two periods.
According to the LFS, the number of people employed on “zero-hours contracts” in their main job, during October to December 2017 was 901,000, representing 2.8% of all people in employment. This latest estimate is 4,000 lower than that for October to December 2016 (905,000 or 2.8% of people in employment).
People on “zero-hours contracts” are more likely to be young, part-time, women or in full-time education when compared with other people in employment. On average, someone on a “zero-hours contract” usually works 25.2 hours a week. Just over one-quarter of people (25.3%) on a “zero-hours contract” want more hours, with most wanting them in their current job, as opposed to a different job that offers more hours. In comparison, 7.3% of other people in employment wanted more hours.
Back to table of contents2. Introduction
This article updates previous analysis on “zero-hours contracts” published on 19 September 2017. It contains the latest figures from the Labour Force Survey (LFS), which cover the period October to December 2017, published in February 2018, and the latest results from the survey of businesses relating to November 2017.
What are “zero-hours contracts”?
There is no single agreed definition of what “zero-hours contracts” are. While some contracts are explicitly called “zero-hours contracts”, there are other definitions available and used in published statistics. The common element to the definitions is the lack of a guaranteed minimum number of hours.
When developing the survey of businesses, we consulted on the definition to be used and decided on the lack of any guaranteed hours. To provide clarity and prevent confusion with the other estimates of “zero-hours contracts” the remainder of this article refers to estimates from the Office for National Statistics (ONS) business survey as no guaranteed hours contracts.
When comparing figures from the ONS business survey with the LFS estimates, a number of issues need to be considered:
the LFS counts people who report that their main employment is a “zero-hours contract”
the estimate from businesses is counting contracts; this will be greater than the number of people as people can have more than one contract
estimates from businesses will include contracts that cover a variety of working arrangements; this will include instances where people in their main employment are working a regular number of hours a week (although these hours are not guaranteed by their contract) as well as those who work on an irregular basis due to personal choice, availability of work or to fit in around their main employment
employers are likely to be more aware of their employees’ formal contractual arrangements and this may differ from the perception of employees if their normal working hours are relatively stable or if changes in hours are mainly because of personal choice
there may be multiple contracts for each job in the business survey
3. How many no guaranteed hours contracts (NGHCs) are there?
This section looks at the latest estimates from the Labour Force Survey (LFS) for the period October to December 2017, published in February 2018, and the business survey for November 2017. Estimates from surveys are, due to sampling error, subject to a degree of uncertainty. Where available, an indication of the level of uncertainty is provided in Annex 1.
Labour Force Survey
The LFS samples around 40,000 households per quarter and collects information about people’s employment status. One of the questions on the LFS, asked of people in employment, relates to special working arrangements that vary daily or weekly. Respondents can choose up to three different arrangements from a list of eight options, one of which is “zero-hours contracts” defined as “where a person is not contracted to work a set number of hours, and is only paid for the number of hours that they actually work”.
As the LFS is based on respondents’ views about their working arrangements, and counts people rather than contracts, it is likely that any estimate of “zero-hours contracts” from the LFS will be less than an estimate obtained from businesses. The number of people the LFS classes as being on a “zero-hours contract” will be those who:
are employed (have done at least one hour of paid work in the week before they were interviewed or reported that they were temporarily away from their job)
report that their working arrangements in their main employment include some form of flexibility
recognise that the flexibility of their working arrangements is a result of being on a “zero-hours contract”
Therefore, the people identified by the LFS as being on a “zero-hours contract” will be those in employment who are aware that their contract allows for them to be offered no hours. This might exclude some people who select another option, such as on-call working, although they have the opportunity to report a “zero-hours contract” as well.
The latest estimate from the LFS shows that 901,000 people reported that they were on a “zero-hours contract” in the period October to December 2017, representing 2.8% of people in employment. This is 0.5% lower than the reported figure from the same period in 2016 (905,000 or 2.8% of people in employment). This fall in the number of people reporting to the LFS that they were on a “zero-hours contract” breaks the upward trend that was observed since 2011. The upward trend that we saw between 2011 and 2016 was likely to have been affected by greater awareness and recognition of the term “zero-hours contract”.
Figure 1 shows the number of people in employment on a “zero-hours contract” from 2000 to 2017. Comparisons with 2012 and earlier years are complicated by a large increase between 2012 and 2013 that appeared to be due mainly to increased recognition and awareness of “zero-hours contracts”. This change was covered in a previous ONS report published on 30 April 2014.
Figure 1: Number (thousands) of people in employment reporting they are on a zero-hours contract, October to December 2000 to October to December 2017
UK
Source: Labour Force Survey (LFS) - Office for National Statistics
Notes:
- The number of people who are shown as on a “zero-hours contract” at any point in time will be affected by whether people know they are on a “zero-hours contract” and will be affected by how aware they are of the concept.
- Estimates presented in Figure 1 are non-seasonally adjusted so comparisons of change should be made based on the same period each year. Additionally, estimates from surveys are subject to a degree of uncertainty.
Download this chart Figure 1: Number (thousands) of people in employment reporting they are on a zero-hours contract, October to December 2000 to October to December 2017
Image .csv .xlsWhen looking at the length of time in current job, the fall in “zero-hours contracts” on the year is driven by the fall in three categories (less than 12 months, 2 years but less than 5 years, and 5 years but less than 10 years); this is only partially offset by increases on the year in the number of people who were in their job for 1 year but less than 2 years and for 10 years or more (Figure 2).
Figure 2: Number (thousands) of people on zero-hours contracts by length of time with current employer, October to December 2017 and change since October to December 2016
UK
Source: Office for National Statistics
Notes:
- Total includes those that did not state their time with current employer.
Download this chart Figure 2: Number (thousands) of people on zero-hours contracts by length of time with current employer, October to December 2017 and change since October to December 2016
Image .csv .xls4. ONS business survey
The business survey for November 2017 asked a sample of 5,000 businesses how many people were employed on contracts that do not guarantee a minimum number of hours and received approximately 2,737 responses. The estimates from the business survey indicate that there were 1.8 million contracts that do not guarantee a minimum number of hours (NGHCs) where work was carried out in the fortnight beginning 13 November 2017 (6% of all contracts). This total excludes contracts that do not guarantee a minimum number of hours where work was not carried out in the reference period.
Table 1: Contracts with no guaranteed minimum number of hours (NGHCs), January 2014 to November 2017, UK
| Millions and % | |||||
|---|---|---|---|---|---|
| Reference period | Total NGHCs where work was carried out (millions) | Percentage of contracts that are NGHCs (%) | Percentage of businesses making some use of NGHCs (%) | ||
| Jan-14 | 1.4 | 5 | 13 | ||
| Aug-14 | 1.8 | 6 | 11 | ||
| Jan-15 | 1.5 | 6 | 11 | ||
| May-15 | 2.1 | 7 | 11 | ||
| Nov-15 | 1.7 | 6 | 10 | ||
| May-16 | 1.7 | 5 | 8 | ||
| Nov-16 | 1.7 | 6 | 7 | ||
| May-17 | 1.4 | 5 | 6 | ||
| Nov-17 | 1.8 | 6 | 6 | ||
| Source: Office for National Statistics Business Survey | |||||
Download this table Table 1: Contracts with no guaranteed minimum number of hours (NGHCs), January 2014 to November 2017, UK
.xls (36.9 kB)As well as the number of contracts, the business survey also estimated that 6% of businesses make some use of NGHCs. However, the share of businesses using NGHCs varies between industries and business sizes.
Figure 3 shows the share of businesses using NGHCs by size of business. It shows that 28% of businesses with employment of 250 and over make some use of NGHCs, compared with 5% of businesses with employment of less than 10.
Figure 3: Percentage (%) of businesses making some use of contracts that do not guarantee a minimum number of hours (NGHCs) by size of business, November 2017
UK
Source: Office for National Statistics
Download this chart Figure 3: Percentage (%) of businesses making some use of contracts that do not guarantee a minimum number of hours (NGHCs) by size of business, November 2017
Image .csv .xlsThe share of total employees on NGHCs across industries varies considerably (Figure 4). In administration and support services, 23% of employees were on a NGHCs in November 2017, compared with public administration where only 1% of employees were on NGHCs.
Figure 4: Percentage (%) of all employees on contracts that do not guarantee a minimum number of hours (NGHCs), by industry, ranked highest to lowest, November 2017
UK
Source: Office for National Statistics
Notes:
- Education classification will include a large number of local authorities. This is due to the possibility that the majority of employment in a local authority could belong to education; this would then classify the main activity of that local authority to education.
Download this chart Figure 4: Percentage (%) of all employees on contracts that do not guarantee a minimum number of hours (NGHCs), by industry, ranked highest to lowest, November 2017
Image .csv .xls5. What are the characteristics of people employed on “zero-hours contracts”?
The Labour Force Survey (LFS) can provide additional information about the type of people who report that their main employment is on a “zero-hours contract”.
Who are they?
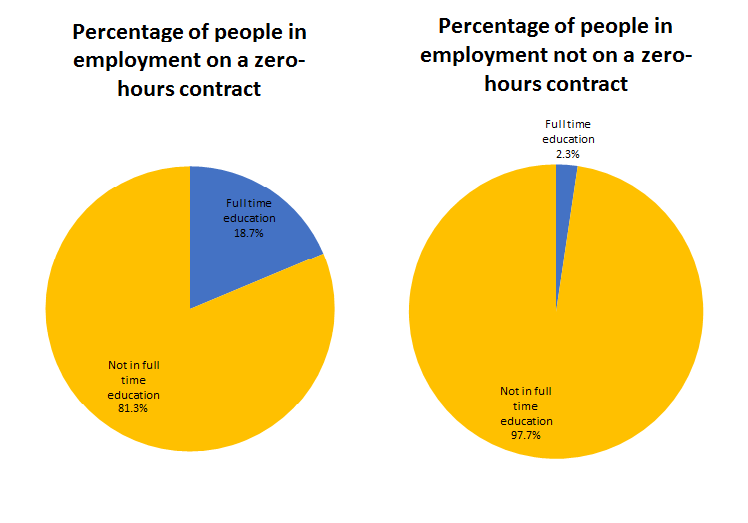
Looking at the type of people who report that they are employed on a “zero-hours contract” compared with other people in employment shows that there are differences in the type of people on “zero-hours contracts” (Figures 5a, 5b, 5c and 6) and the industries in which they work (Figures 7a and 7b). For October to December 2017:
women make up a bigger share of those reporting working on “zero-hours contracts” (54.7%), compared with their share in employment not on “zero-hours contracts” (46.8%)
people who report being on a “zero-hours contract” are more likely to be at the younger end of the age range; 36.0% of people on “zero-hours contracts” are aged 16 to 24 years, compared with 11.4% for all people in employment not on a “zero-hours contract”
18.7% of people on “zero-hours contracts” are in full-time education, compared with 2.3% of other people in employment
66.0% of people on “zero-hours contracts” are working part-time when compared with 25.3% of people who are in employment not on a “zero-hours contracts”
22.6% of people in employment on a “zero-hours contract” are in the accommodation and food industry
11.8% of people employed in the accommodation and food industry are on a “zero-hours contract”
Most of these characteristics have shown little change over recent years, with the patterns partly reflecting the groups most likely to find the flexibility of “zero-hours contracts” an advantage, for example, young people who combine flexible working with their studies.
Figure 5a: Comparison of percentages (%) of people who are in employment on a zero-hours contract and who are not on a zero-hours contract by sex, October to December 2017
UK

Source: Office for National Statistics
Download this image Figure 5a: Comparison of percentages (%) of people who are in employment on a zero-hours contract and who are not on a zero-hours contract by sex, October to December 2017
.png (19.0 kB) .xlsx (8.8 kB)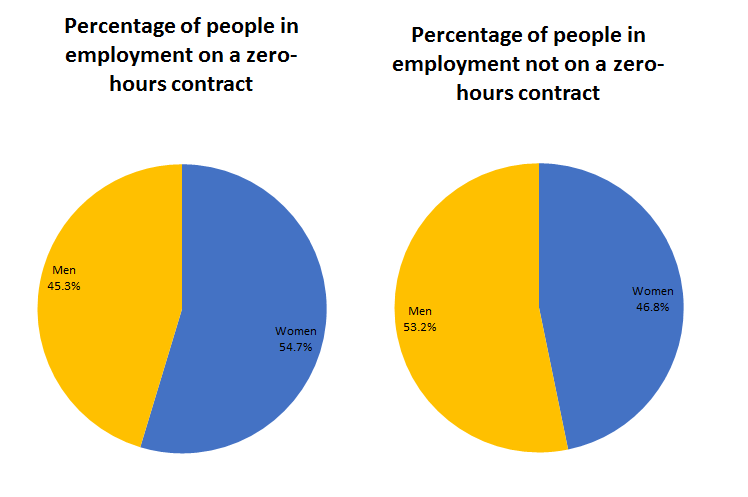
Figure 5b: Comparison of percentages (%) of people who are in employment on a zero-hours contract and who are not on a zero-hours contract by educational status, October to December 2017
UK
Source: Office for National Statistics
Download this image Figure 5b: Comparison of percentages (%) of people who are in employment on a zero-hours contract and who are not on a zero-hours contract by educational status, October to December 2017
.png (19.8 kB) .xlsx (8.8 kB)
Figure 5c: Comparison of percentages (%) of people who are in employment on a zero-hours contract and who are not on a zero-hours contract on full-time and part-time basis, October to December 2017

Source: Office for National Statistics
Notes:
- Sum of percentages do not equal 100 this is because the total includes missing cases that did not specify their employment status
Download this image Figure 5c: Comparison of percentages (%) of people who are in employment on a zero-hours contract and who are not on a zero-hours contract on full-time and part-time basis, October to December 2017
.png (22.4 kB) .xlsx (9.8 kB)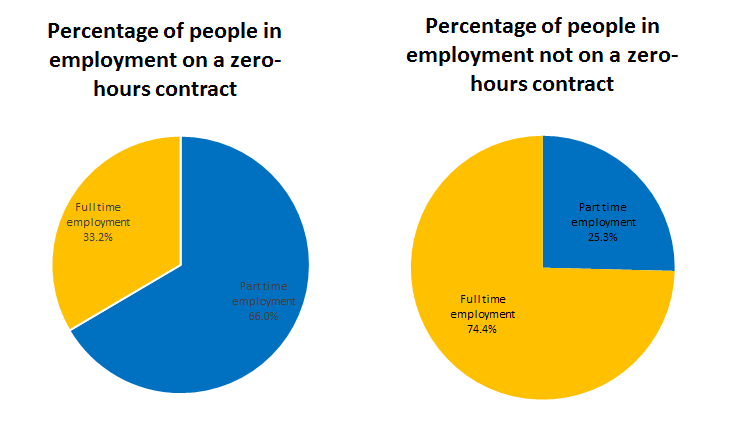
Figure 6: Comparison of percentages (%) of people who are in employment on a zero-hours contract and who are not on a zero-hours contract by age, October to December 2017
UK
Source: Office for National Statistics
Download this chart Figure 6: Comparison of percentages (%) of people who are in employment on a zero-hours contract and who are not on a zero-hours contract by age, October to December 2017
Image .csv .xls
Figure 7a: Percentage (%) of people on a zero-hours contract by industry, ranked highest to lowest, October to December 2017
UK
Source: Office for National Statistics
Download this chart Figure 7a: Percentage (%) of people on a zero-hours contract by industry, ranked highest to lowest, October to December 2017
Image .csv .xls
Figure 7b: Percentage (%) of all people in employment in each industry who are on a zero-hours contract, ranked highest to lowest, October to December 2017
UK
Source: Office for National Statistics
Download this chart Figure 7b: Percentage (%) of all people in employment in each industry who are on a zero-hours contract, ranked highest to lowest, October to December 2017
Image .csv .xls6. Hours worked and flexibility
The actual hours recorded are the hours worked by an individual during the survey reference week. The majority of people on “zero-hours contracts” (66.0%) reported that they worked part-time, compared with 25.3% of other workers. This means that the average actual weekly hours worked in their main job, by someone on a “zero-hours contract”, is lower at 21.8 hours per week compared with the average actual weekly hours for all workers at 31.6. This shows a similar pattern to usual hours worked, that is, the weekly hours usually worked throughout the year, which were 25.2 and 36.4 hours respectively.
In October to December 2017, there were 16.0% of people on “zero-hours contracts” who worked no hours in the week before their Labour Force Survey (LFS) interview, compared with 11.1% of other workers.
Comparing usual and actual hours, Figure 8 shows the differences between actual and usual hours worked for people on “zero-hours contracts” and other workers. For October to December 2017:
37.5% of people on “zero-hours contracts” worked their usual hours compared with 55.3% of other workers
33.5% of people on “zero-hours contracts” worked less than their usual hours compared with 29.8% of other workers
20.1% of people on “zero-hours contracts” worked more than their usual hours compared with 11.6% of other workers
Figure 8: Actual hours minus usual hours, October to December 2017, UK
Source: Office for National Statistics
Download this chart Figure 8: Actual hours minus usual hours, October to December 2017, UK
Image .csv .xlsThere are two different ways in which the percentage of people wanting more hours can be calculated. It can be calculated as a percentage of the total people on a “zero-hours contract”, which includes people who did not specify whether they want more hours, or it can be calculated as a percentage of people who have stated their preference for more hours. The two approaches produce different values but the underlying messages are unchanged.
Under the first calculation approach, just over one-quarter (25.3%) of people on “zero-hours contracts” want more hours compared with 7.3% of people in employment not on a “zero-hours contract”, though this could be linked to a higher proportion of “zero-hours contract” jobs being part-time. Looking in more detail, 5.3% of people on “zero-hours contracts” would like a different job with more hours compared with 0.7% for other people in employment (the remainder would like more hours in their current job or an additional job) (Figure 9).
Under the second calculation approach, just under one-third (29.9%) of people on “zero-hours contracts” want more hours compared with 9.1% of people in employment not on a “zero-hours contract”, though this could be linked to a higher proportion of “zero-hours contract” jobs being part-time. Looking in more detail, 6.3% of people on “zero-hours contracts” would like a different job with more hours compared with 0.9% for other people in employment (the remainder would like more hours in their current job or an additional job).
Figure 9: Percentage (%) of people looking for another job or more hours, October to December 2017
UK
Source: Office for National Statistics
Download this chart Figure 9: Percentage (%) of people looking for another job or more hours, October to December 2017
Image .csv .xls7. Future of the experimental business survey
The figures in this release include those from the latest survey of businesses. After reviewing the survey, we intend to discontinue the business survey, retaining the data from the Labour Force Survey (LFS). The following section outlines reasons behind the decision.
History of the business survey
The business survey was set up in Autumn 2013 to provide another estimate of “zero-hours contracts” on a similar basis to statistics from other bodies (for example, CIPD). The original intention was to add a question to an existing survey of businesses. However, initial scoping work showed that this approach would take significant time and presented a risk to existing data collection.
To deliver the new data in an acceptable timeframe, a bespoke telephone survey of businesses was set up and the first results were published in April 2014. Since then, the survey has continued every six months with results showing relatively similar levels. Results from the business survey can be broken down by industry and size of business.
LFS data
The LFS data on “zero-hours contracts” has been collected on the survey since 2000 and measures those people who are employed on a “zero-hours contract” in their main job. The data rely on LFS respondents recognising the term “zero-hours contract” and being able to apply it to their situation. Data from the LFS can be subdivided in a number of ways that are of interest (for example, gender, age, occupation, wanting to work more hours and so on). The only breakdown not available from the LFS that is on the business survey is by size of business (industry is available on the LFS but is self-reported and may not be consistent with that used by business surveys).
A historical concern with the LFS was a low awareness among respondents of “zero-hours contracts”, potentially leading to under-reporting. The data from the LFS were initially below the level of other estimates of “zero-hours contracts”. However, the increased publicity around the latter half of 2013 caused a step change in the figures. The latest data (October to December 2017) show that 901,000 people were employed on a “zero-hours contract”, around 2.8% of the total number of employed people.
Rationale for discontinuing the business survey
The business survey remains a separate survey and it has never been integrated with other business surveys. It is still an experimental statistic.
The business survey has faced a number of challenges, such as:
- the sample size is relatively small, with some 5,000 businesses; while the LFS samples individuals, we gather data from around 40,000 households and around 90,000 individuals per quarter
- there have been difficulties stemming from the separate nature of the business survey, with a challenge in ensuring a good sampling frame, chasing responses and undertaking quality assurance
- the telephone nature of the survey causes difficulties with collecting the data from businesses as the respondent may not be able to supply the data immediately or may not be the right point of contact
- in part reflecting the practical challenges, there have been methodological changes meaning that despite running for four years, the results over this short period are not strictly comparable
- the results from the survey have been relatively stable, which has raised questions about the quality of responses from businesses; on the other hand, the discrepancy between the LFS and the business survey has decreased due to increased awareness of LFS respondents
The LFS measures people while the business survey measures contracts. Due to the nature of “zero-hours contracts”, people can have more than one “zero-hours contract”, which makes the number of contracts a less meaningful concept than the number of people on “zero-hours contracts” captured by the LFS. The LFS also provides the breakdowns that attract most interest when the data are released.
Given the issues highlighted, maintaining the business survey does not appear to be adding sufficient value. Integrating the questions into an existing survey or moving the existing survey to a similar basis to other surveys would require significant investment, which would need to be prioritised alongside other developments in Office for National Statistics (ONS). Therefore, on balance, we have decided to stop the current business survey as the LFS is now in a position to meet a wide variety of needs in terms of information on “zero-hours contracts”.
Back to table of contents8. Annex 1: Measures of uncertainty
Labour Force Survey
The estimate of 901,000 people employed on “zero-hours contracts” has a 95% confidence interval of plus or minus 69,000, which means the true figure is likely to lie between 832,000 and 970,000.
ONS business survey
The November 2017 estimate of 1.8 million contracts that do not guarantee hours and where work was carried out has a 95% confidence interval of plus or minus 173,032, which means the true figure is likely to lie between 1.6 million and 2.0 million.
Back to table of contents