Table of contents
- Key points
- Summary
- Regional (NUTS1) estimates
- Sub-regional (NUTS2) estimates
- Local area (NUTS3) estimates
- Component analysis
- Variation within regions
- Economic context
- About this release
- Domestic (UK) use of regional GDHI estimates
- European use of disposable household income estimates
- Future work plans
- Interactive map
- Background notes
- Methodology
1. Key points
Figures quoted in this statistical bulletin are at current prices, which include the effects of price changes (inflation)
It should be noted that these estimates relate to totals for all individuals within the household sector for a region rather than to an actual average household or family unit. GDHI per head estimates give values for each person, not each household
In 2012 London had the highest GDHI per head, where the average person had £21,446 available to save or spend. Northern Ireland had the lowest, with the average person only having £13,902 (see Table 1)
Of the 37 NUTS2 sub-regions, in 2012 Inner London had the highest GDHI per head, where the average person had £24,940 available to save or spend. The West Midlands sub-region had the lowest, with the average person only having £13,300 (see Table 2)
Of the 139 NUTS3 local areas, in 2012 Inner London - West had the highest GDHI per head, where the average person had £36,963 available to save or spend. Nottingham had the lowest, with the average person only having £11,411 (see Table 3)
Between 2011 and 2012, GDHI per head of population increased in all NUTS1 regions. The North East had the strongest growth at 4.0%, followed by Wales at 3.8%. Northern Ireland had the weakest growth at 2.7%
2. Summary
This bulletin presents the latest estimates of Gross Disposable Household Income (GDHI) for regions (see Table 1), sub-regions and local areas of the UK. GDHI is the amount of money that all of the individuals in the household sector have available for spending or saving after income distribution measures (for example taxes, social contributions and benefits) have taken effect.
It should be noted that these estimates relate to totals for all individuals within the household sector for a region rather than to an actual average household or family unit. GDHI per head estimates give values for each person, not each household.
The statistics are presented for areas according to the European classification of Nomenclature of Units for Territorial Statistics (NUTS) (see background note 1).
Table 1: Regional Gross Disposable Household Income, 2012
| NUTS1 Regions | GDHI per head (£) | GDHI per head growth on 2011 (%) | GDHI per head index (UK=100) | Total GDHI1 (£m) | Total GDHI growth on 2011 (%) | Share of UK total GDHI (%) |
| United Kingdom | 16,791 | 3.3 | 100.0 | 1,069,687 | 4.0 | 100.0 |
| North East | 14,393 | 4.0 | 85.7 | 37,456 | 4.2 | 3.5 |
| North West | 14,939 | 3.4 | 89.0 | 105,836 | 3.8 | 9.9 |
| Yorkshire and The Humber | 14,575 | 3.3 | 86.8 | 77,490 | 3.9 | 7.2 |
| East Midlands | 15,206 | 3.2 | 90.6 | 69,456 | 3.9 | 6.5 |
| West Midlands | 14,744 | 3.0 | 87.8 | 83,192 | 3.7 | 7.8 |
| East of England | 17,630 | 3.2 | 105.0 | 104,149 | 4.0 | 9.7 |
| London | 21,446 | 3.4 | 127.7 | 178,183 | 4.7 | 16.7 |
| South East | 19,126 | 3.2 | 113.9 | 166,870 | 4.1 | 15.6 |
| South West | 16,914 | 3.0 | 100.7 | 90,313 | 3.7 | 8.4 |
| England | 17,066 | 3.3 | 101.6 | 912,946 | 4.1 | 85.3 |
| Wales | 14,623 | 3.8 | 87.1 | 44,953 | 4.2 | 4.2 |
| Scotland | 16,267 | 3.3 | 96.9 | 86,437 | 3.5 | 8.1 |
| Northern Ireland | 13,902 | 2.7 | 82.8 | 25,352 | 3.2 | 2.4 |
| Source: Office for National Statistics | ||||||
| Notes: | ||||||
| 1. Figures may not sum to totals as a result of rounding. | ||||||
Download this table Table 1: Regional Gross Disposable Household Income, 2012
.xls (23.6 kB)Of the 12 NUTS1 regions, in 2012 regional GDHI per head was above the UK average (£16,791) in four regions: London (£21,446); the South East (£19,126); East of England (£17,630); and the South West (£16,914). The lowest GDHI per head was in Northern Ireland (£13,902) (see Map 1).
London’s GDHI per head was 27.7% above the UK average while Northern Ireland was 17.2% below.
Map 1: Regional GDHI per head UK map, 2012

Download this image Map 1: Regional GDHI per head UK map, 2012
.png (318.7 kB)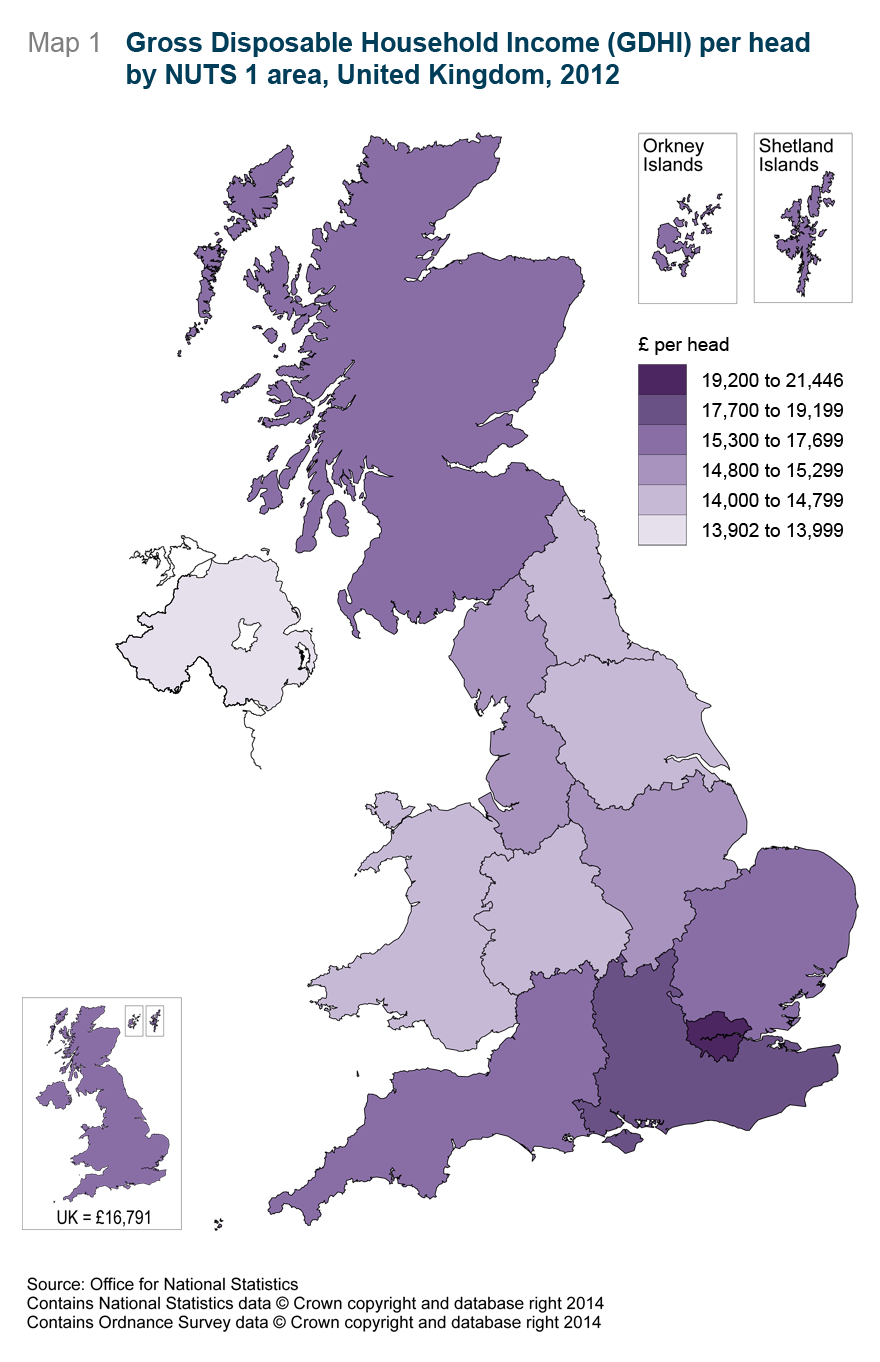
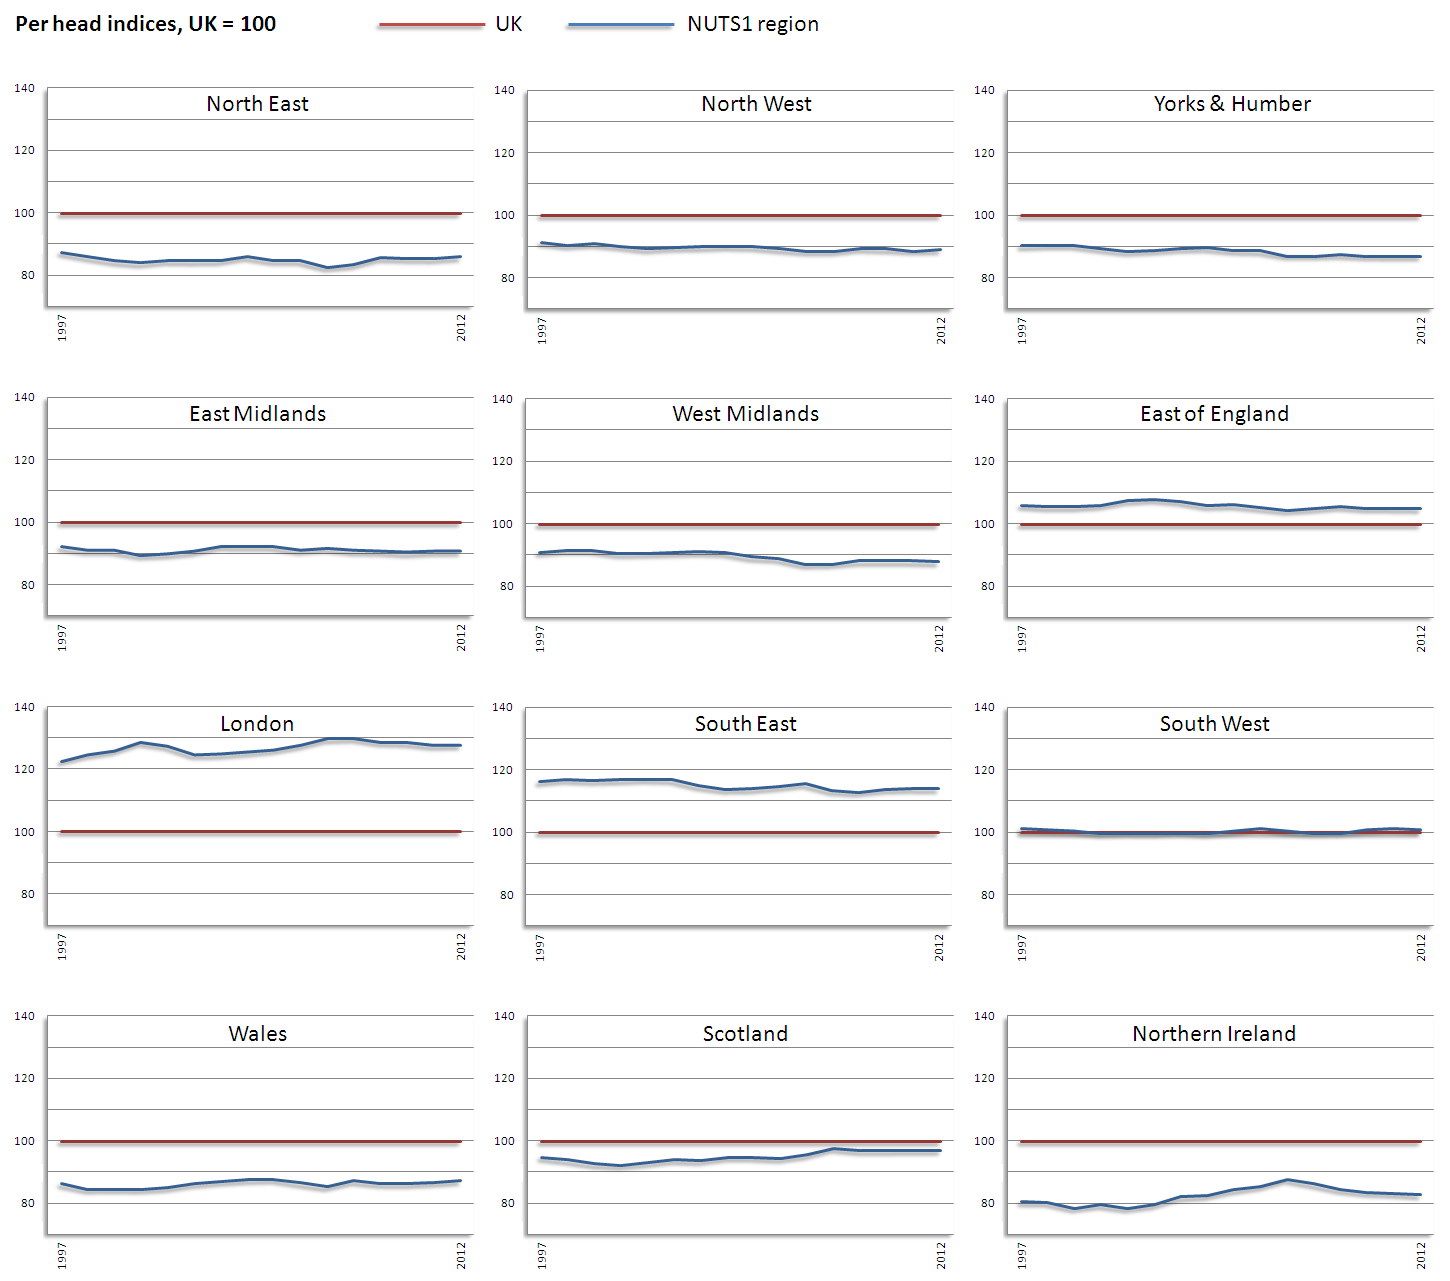
Per head indices allow a comparison of regional data with the UK average. With the UK being indexed at 100, Figure 1 presents a comparison of the GDHI per head for each NUTS1 region, from 1997 to 2012. Click to enlarge the chart.
Figure 1: NUTS1 regions' GDHI per head indices, 1997-2012
Source: Office for National Statistics
Download this image Figure 1: NUTS1 regions' GDHI per head indices, 1997-2012
.png (112.0 kB) .xls (181.2 kB)
3. Regional (NUTS1) estimates
GDHI per head of population (NUTS1)
In 2012 the highest growth in Gross Disposable Household Income (GDHI) per head was in the North East at 4.0%, followed by Wales at 3.8%. The lowest growth was in Northern Ireland at 2.7%.
In 2012 the rate of GDHI per head growth was higher than in 2011 in all regions (see Figure 2). The rate of annual growth increased most in the North East (from 1.9% in 2011 to 4.0% in 2012) and London (from 1.3% in 2011 to 3.4% in 2012).
Figure 2: NUTS1 GDHI per head growth on previous year, 2010, 2011 and 2012
Source: Office for National Statistics
Download this chart Figure 2: NUTS1 GDHI per head growth on previous year, 2010, 2011 and 2012
Image .csv .xlsIndex values allow a direct comparison with the UK average value (UK=100) in any given period.
Between 1997 and 2012 four regions' per head indices increased compared with the UK average (see Figure 3). These were London, which increased from 122.4 to 127.7; Northern Ireland from 80.5 to 82.8; Scotland from 94.7 to 96.9; and Wales from 86.2 to 87.1.
Between 1997 and 2012 Yorkshire and The Humber showed the greatest downward movement away from the UK average, with a decrease from 90.1 to 86.8.
Figure 3: NUTS1 GDHI per head index comparison with UK average, 1997 and 2012

Source: Office for National Statistics
Download this image Figure 3: NUTS1 GDHI per head index comparison with UK average, 1997 and 2012
.png (17.0 kB) .xls (112.6 kB)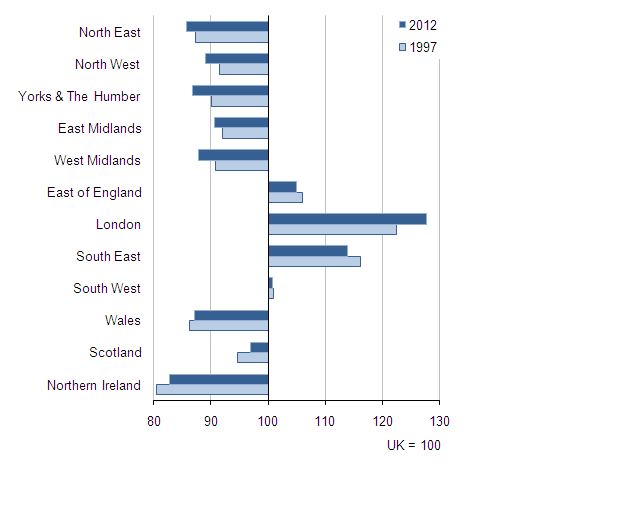
Total GDHI (NUTS1)
In 2012 total GDHI increased in all UK regions. The highest percentage growth since 2011 was in London (4.7%) and the lowest in Northern Ireland (3.2%) followed by Scotland (3.5%). These compare with the total UK growth of 4.0%.
In 2012 the rate of annual growth was higher than that in 2011 in all regions. The rate of growth increased most in the North East (from 2.3% in 2011 to 4.2% in 2012).
Regional shares of total GDHI (NUTS1)
London had the largest increase in regional share of UK GDHI between 1997 and 2012 (from 14.7% to 16.7%) (see Figure 4). The largest decrease in share in this period was in the North West (from 10.7% to 9.9%).
Figure 4: Percentage share of UK GDHI, 2012
Source: Office for National Statistics
Download this chart Figure 4: Percentage share of UK GDHI, 2012
Image .csv .xls4. Sub-regional (NUTS2) estimates
Table 2: NUTS2 Sub-regions top five and bottom five GDHI per head, 2012
| NUTS2 Sub-regions | GDHI per head (£) | GDHI per head growth on 2011 (%) | GDHI per head index (UK=100) | Total GDHI (£m) | Total GDHI growth on 2011 (%) |
| United Kingdom | 16,791 | 3.3 | 100.0 | 1,069,687 | 4.0 |
| Top five GDHI per head | |||||
| Inner London | 24,940 | 3.9 | 148.5 | 81,926 | 5.3 |
| Surrey, East and West Sussex | 20,595 | 3.3 | 122.7 | 56,956 | 4.1 |
| Berkshire, Buckinghamshire and Oxfordshire | 19,948 | 3.1 | 118.8 | 45,793 | 4.0 |
| Outer London | 19,162 | 2.9 | 114.1 | 96,257 | 4.2 |
| Bedfordshire and Hertfordshire | 19,109 | 3.1 | 113.8 | 33,520 | 4.1 |
| Bottom five GDHI per head | |||||
| West Yorkshire | 14,151 | 3.3 | 84.3 | 31,709 | 3.9 |
| Tees Valley and Durham | 14,133 | 4.1 | 84.2 | 16,648 | 4.3 |
| Northern Ireland | 13,902 | 2.7 | 82.8 | 25,352 | 3.2 |
| South Yorkshire | 13,742 | 3.3 | 81.8 | 18,582 | 3.9 |
| West Midlands | 13,300 | 2.9 | 79.2 | 36,744 | 3.7 |
| Source: Office for National Statistics | |||||
| Notes: | |||||
| 1. Data for all NUTS2 sub-regions are included in reference tables 2.1 to 2.3. | |||||
Download this table Table 2: NUTS2 Sub-regions top five and bottom five GDHI per head, 2012
.xls (23.6 kB)GDHI per head of population (NUTS2)
Inner London had the highest GDHI per head (£24,940) in 2012, followed by Surrey, East and West Sussex (£20,595). The West Midlands had the lowest (£13,300), followed by South Yorkshire (£13,742) (see Table 2).
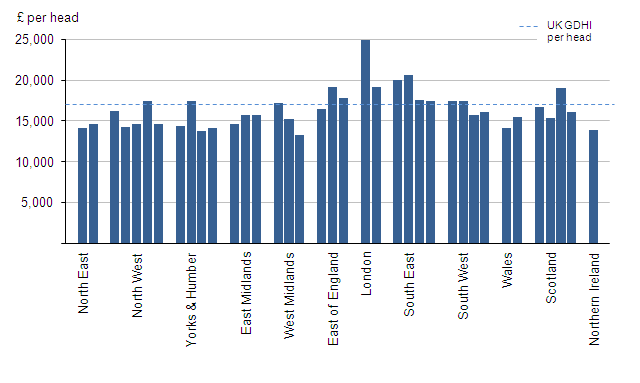
In 2012, of the 37 NUTS2 sub-regions, 14 were above the UK average GDHI per head (£16,791), including all those within London and the South East. In each of the NUTS2 sub-regions within the North East, East Midlands, Wales and Northern Ireland, GDHI per head was below the UK average (see Figure 5).
Figure 5: NUTS2 GDHI per head grouped by NUTS1 region, 2012
Source: Office for National Statistics
Download this image Figure 5: NUTS2 GDHI per head grouped by NUTS1 region, 2012
.png (12.4 kB) .xls (81.4 kB)
Total GDHI (NUTS2)
In 2012 total GDHI grew in all NUTS2 sub-regions, with the highest percentage growth since 2011 in Inner London at 5.3%, followed by East Wales at 4.4%. The lowest percentage growth was in Northern Ireland at 3.2%.
Back to table of contents5. Local area (NUTS3) estimates
Table 3: NUTS3 Local areas top five and bottom five GDHI per head, 2012
| NUTS3 Areas | GDHI per head (£) | GDHI per head growth on 2011 (%) | GDHI per head index (UK=100) | Total GDHI (£m) | Total GDHI growth on 2011 (%) |
| United Kingdom | 16,791 | 3.3 | 100.0 | 1,069,687 | 4.0 |
| Top five GDHI per head | |||||
| Inner London - West | 36,963 | 5.9 | 220.1 | 40,678 | 6.4 |
| Surrey | 23,672 | 3.5 | 141.0 | 27,069 | 4.2 |
| Buckinghamshire CC | 22,503 | 2.9 | 134.0 | 11,510 | 3.9 |
| Hertfordshire | 20,642 | 3.3 | 122.9 | 23,307 | 4.1 |
| Outer London - South | 20,543 | 3.1 | 122.3 | 25,528 | 4.3 |
| Bottom five GDHI per head | |||||
| West and South of Northern Ireland | 12,605 | 1.9 | 75.1 | 5,255 | 2.8 |
| Kingston upon Hull, City of | 12,250 | 3.4 | 73.0 | 3,151 | 3.9 |
| Blackburn with Darwen | 11,582 | 3.6 | 69.0 | 1,711 | 3.6 |
| Leicester | 11,539 | 3.0 | 68.7 | 3,826 | 3.6 |
| Nottingham | 11,411 | 2.5 | 68.0 | 3,523 | 4.1 |
| Source: Office for National Statistics | |||||
| Notes: | |||||
| 1. Data for all NUTS3 local areas are included in tables 3.1 to 3.3. | |||||
Download this table Table 3: NUTS3 Local areas top five and bottom five GDHI per head, 2012
.xls (23.6 kB)GDHI per head of population (NUTS3)
In 2012, of the 139 NUTS3 areas, 42 were above the UK average GDHI per head. Inner London - West had the highest GDHI per head (£36,963), followed by Surrey (£23,672). Nottingham (£11,411) had the lowest, followed by Leicester (£11,539) (see Table 3).
In 2012 GDHI per head increased in every NUTS3 area.
Figure 6 shows the top and bottom five NUTS3 local areas by GDHI per head in 2012. The largest increase in the rate of annual growth of all 139 local areas was in Inner London – West, from -1.2% in 2011 to 5.9% in 2012.
Figure 6a: NUTS3 GDHI per head growth on previous year, 2010, 2011 and 2012
Top 5 areas by GDHI per head
Source: Office for National Statistics
Download this chart Figure 6a: NUTS3 GDHI per head growth on previous year, 2010, 2011 and 2012
Image .csv .xls
Figure 6b: NUTS3 GDHI per head growth on previous year, 2010, 2011 and 2012
Bottom 5 areas by GDHI per head
Source: Office for National Statistics
Download this chart Figure 6b: NUTS3 GDHI per head growth on previous year, 2010, 2011 and 2012
Image .csv .xlsTotal GDHI (NUTS3)
In 2012 total GDHI grew in all NUTS3 areas, with the highest percentage growth since 2011 in Inner London – West at 6.4%. The lowest percentage growth was in Glasgow City at 2.7%.
In 2012 the rate of growth in total GDHI increased most in Inner London – West, from -0.1% in 2011 to 6.4% in 2012. The rate of growth decreased in 20 local areas, with the greatest reduction seen in Aberdeen City and Aberdeenshire, from 5.2% to 3.4%.
Back to table of contents6. Component analysis
The components of Gross Disposable Household Income (GDHI) trace the resources (incomings) and uses (outgoings) of the household and non-profit institutions serving households (NPISH) economic sector. This component analysis will look at the different incomings of this sector. For more information about the make-up of the primary and secondary accounts discussed in this section, please see 'About this release'. Data discussed in this section can be found in reference table 1.2.
Users can perform their own analyses on GDHI data using this interactive tool. The tool contains component level data, at NUTS3 level, for the entire time series.
Household and NPISH sector resources
Resources, or incomings, of the household and NPISH sector can be split into primary resources and secondary resources. The former relates to items such as wages and salaries, rental income and interest on savings. The latter relates to social benefits received and other current transfers, such as monetary gifts and insurance pay-outs.
Primary resources
Primary resources comprise operating surplus, mixed income, compensation of employees and property income and relate to the income earned by the household and NPISH sector as a result of productive activity or the ownership of productive assets. They include wages and salaries, rental income from buildings, income from self-employment and income from the ownership of financial assets, such as interest on savings.
Figure 7 illustrates the proportion of a region's total resources (primary resources plus secondary resources), or incomings, that was made up of total primary resources in 1997, 2007 and 2012.
Figure 7: Primary resources as a proportion of total resources, 1997, 2007 and 2012
Source: Office for National Statistics
Download this chart Figure 7: Primary resources as a proportion of total resources, 1997, 2007 and 2012
Image .csv .xlsIn almost all regions, a pattern can be seen showing an increase in the amount of primary resources earned as a proportion of total household incomings between 1997 and 2007, followed by a decrease between 2007 and 2012. This follows the UK pattern, which increased from 77.6% in 1997 to 78.9% in 2007, followed by a drop to 74.9% in 2012.
The exception to this pattern is the West Midlands, which decreased across both periods, from 76.8% in 1997, to 76.3% in 2007, to 71.6% in 2012.
The economic downturn hit the UK in 2008 quarter 4. The fall in the amount of primary resources earned as a proportion of total household incomings between 2007 and 2012 shows the effect the downturn has had regionally. The largest fall across this period was seen in Yorkshire and The Humber and Northern Ireland, which both decreased by 4.8%. The smallest decrease between 2007 and 2012 was in London, which saw a decrease of 2.3%.
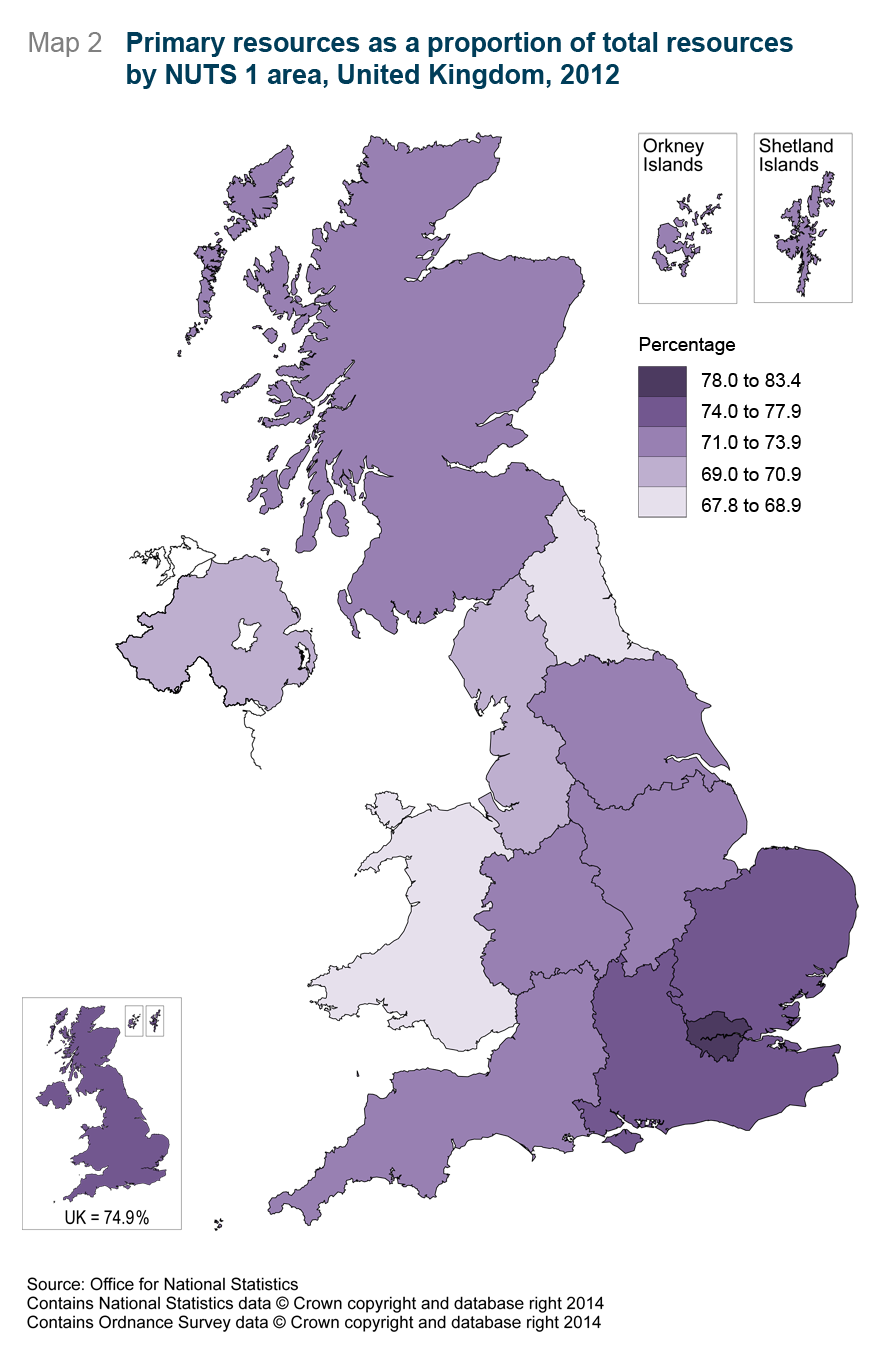
Map 2 allows us to look at primary resources as a percentage of total household incomings for 2012.
Map 2: Primary resources as a proportion of total resources 2012, by NUTS1 region
Download this image Map 2: Primary resources as a proportion of total resources 2012, by NUTS1 region
.png (315.0 kB)
Of the NUTS1 regions Wales received the smallest share of primary resources as a proportion of total household incomings in 2012, at 67.8%. This was followed by the North East at 68.9%. London received the largest proportion at 83.4%, followed by the South East at 77.4%.
In 2012 there were three regions above the UK average of 74.9%: London, the South East and the East of England.
The following section looks at the other incomes earned by the household sector, which are described as ‘secondary resources’.
Social benefits and imputed social contributions
Social benefits and imputed social contributions are the main source of secondary resources, the amount received by the household sector in the redistribution of income. They include national insurance fund benefits, such as state pensions and unemployment allowance, and non-contributory benefits such as Child Benefit and tax credits. Imputed social contributions are those paid directly by employers to current and former employees.
Figure 8 illustrates the proportion of a region's total resources (primary resources plus secondary resources), or incomings, that was made up of social benefits and imputed social contributions in 1997, 2007 and 2012.
Figure 8: Social benefits and imputed social contributions as a proportion of total resources, 1997, 2007 and 2012
Source: Office for National Statistics
Download this chart Figure 8: Social benefits and imputed social contributions as a proportion of total resources, 1997, 2007 and 2012
Image .csv .xlsFigure 8 paints an opposite picture to that expressed in Figure 7. Of the three years, 1997, 2007 and 2012, for most regions the largest amount of incomings earned from social benefits and imputed contributions was in 2012, whereas they made the smallest contribution to household incomings in 2007. The exception was London, where the contribution in 2012 remained below that in 1997.
The largest increase in the amount of social benefits and imputed contributions received as a proportion of total incomings between 2007 (pre-economic downturn) and 2012 was a difference of 4.6% in four regions: Yorkshire and The Humber; East Midlands; West Midlands; and the South West.
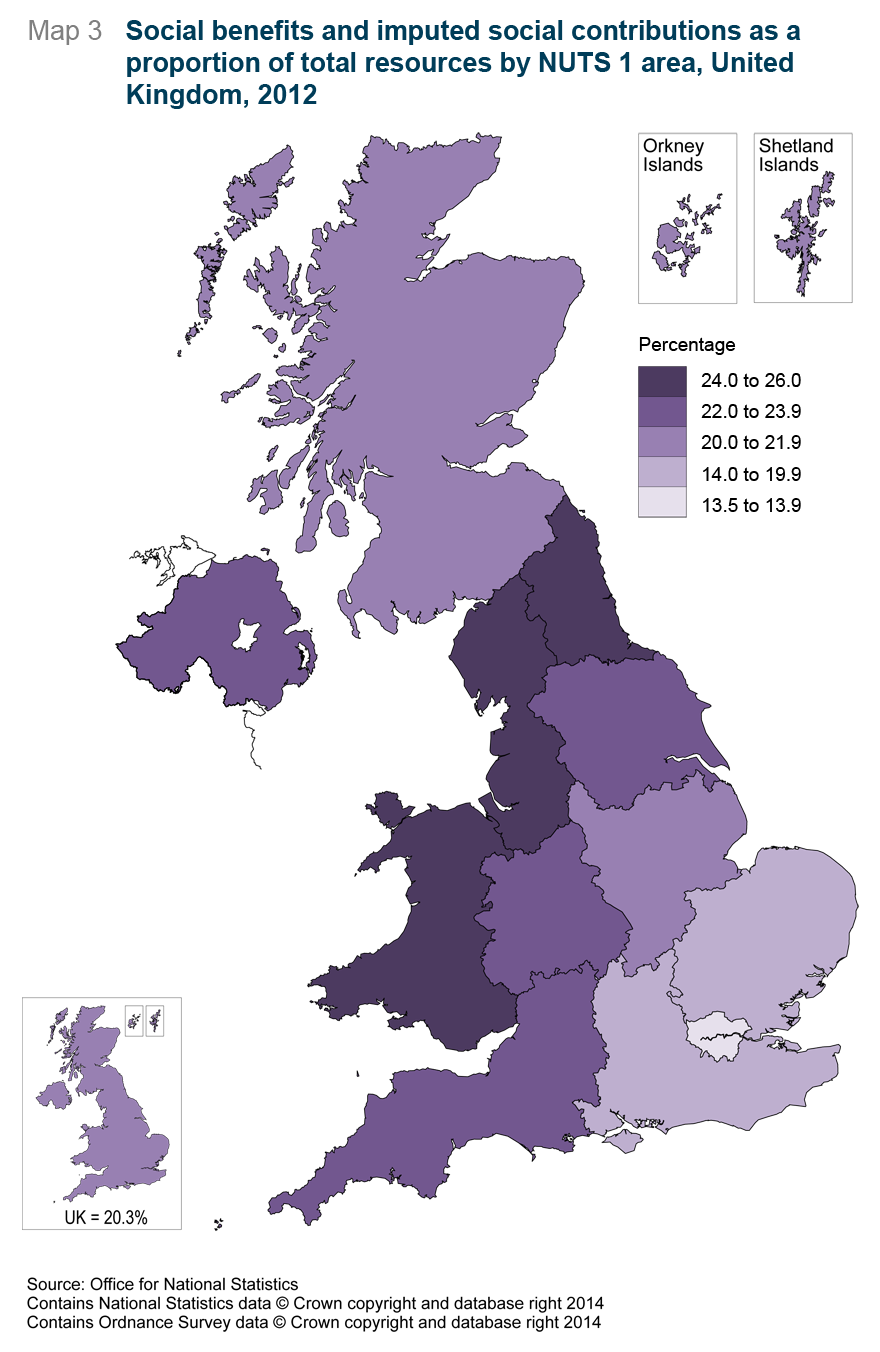
Map 3 shows the proportion of a region's total resources (primary resources plus secondary resources), or incomings, that the household sector in a region received as social benefits and social contributions in 2012.
Map 3: Social benefits and imputed contributions as a proportion of total resources 2012, by NUTS1 region
Download this image Map 3: Social benefits and imputed contributions as a proportion of total resources 2012, by NUTS1 region
.png (314.0 kB)
In 2012, Wales received the largest share of social benefits and social contributions as a proportion of total incomings, at 26.0%, followed by the North East at 25.2%. London received the smallest proportion at 13.5%, followed by the South East at 18.5%.
In 2012 social benefits and social contributions, as a proportion of total incomings, were below the UK average of 20.3% in three regions: the East of England, London and the South East.
Back to table of contents7. Variation within regions
The countries and regions of the UK have differing demographic characteristics, industrial structure and economic performance. There is also a wide variation in the size and population of the regions which makes comparison difficult using cash totals. Estimates on a per head basis allow for the comparison of regions significantly different in absolute size.
Within NUTS1 regions there can be wide variation between the NUT3 local areas contained therein. Figure 9 illustrates variation in the range of GDHI per head at NUTS3 geography, within the NUTS1 regions of the UK.
Figure 9: NUTS3 GDHI per head highest and lowest NUTS3 area within each NUTS1 region, 2012

Source: Office for National Statistics
Download this image Figure 9: NUTS3 GDHI per head highest and lowest NUTS3 area within each NUTS1 region, 2012
.png (36.0 kB) .xls (306.7 kB)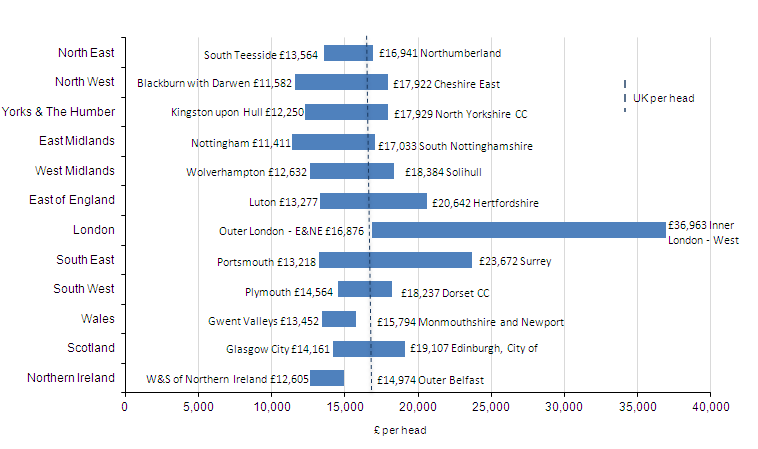
Local areas within close proximity can vary drastically, for example, within the East Midlands NUTS1 region there are 11 NUTS3 local areas, of which neighbouring areas South Nottinghamshire and Nottingham have the highest and lowest GDHI per head respectively within the NUTS1 region.
In 2012 London was the only region where each constituent local area had a GDHI per head above the UK average of £16,791. Wales and Northern Ireland were the only regions in which each local area was below the UK average.
The greatest range between the local areas within a region was in London, the lowest being Outer London - East and North East at £16,876, the highest being Inner London - West at £36,963, more than double the lowest. The smallest range between the local areas within a NUTS1 region was in Wales, where the local area with the lowest GDHI per head was Gwent Valleys at £13,452 and the highest was Monmouthshire and Newport at £15,794.
Back to table of contents8. Economic context
Overall the UK economy is estimated to have seen output increase in real terms by 0.3% in 2012 when compared with 2011. Economic output remained static in Q1 (January - March) and increased in Q3 (July - September), but declined in Q2 (April - June) and Q4 (October - December). The decline in output during Q2 coincided with a change in bank holidays for the Diamond Jubilee and poor weather from April to June, which is likely to have had some impact on certain sectors of the economy. By contrast, the Olympics and Paralympics took place during Q3 2012 which may have helped raise the level of output in that quarter.
The overall increase in GDP in 2012 compared with 2011 was due to real term increases in household final consumption expenditure and general government final consumption expenditure which helped to compensate for a deficit in net trade that weighed down overall growth.
Nominal regional GVA increased in almost all UK regions and countries during 2012, except the East Midlands where GVA was flat. Growth was highest in the South East, where it increased by 3.3% year-on-year, followed by the North West, which was the only other region with a growth rate in excess of 2%.
Throughout 2012 interest rates remained at 0.5% and, although inflation slowed, it stayed above the Bank of England’s target of 2%. The Consumer Price Index (CPI) rose by 2.8% from 2011 to 2012 following a 4.5% rise from 2010 to 2011.
In 2012 the number of births of businesses exceeded the number of deaths in most English regions and Scotland. Business deaths only exceeded business births in Yorkshire and The Humber, West Midlands, South West, Wales and Northern Ireland.
Overall the number of workforce jobs in the UK increased from December 2011 to December 2012, with a 3% increase in jobs in London and a 1% increase in the West Midlands, South East and Wales. The total number of workforce jobs in the North East, East Midlands, East of England and South West declined during this period. The remaining countries and regions saw little change over the period.
In general, unemployment rates fell and employment rates increased from Q4 2011 to Q4 2012, although the change wasn’t statistically significant in most cases. London, however, did experience a statistically significant increase in the employment rate and decrease in the unemployment rate. The other region with a statistically significant increase in the employment rate was the West Midlands. The claimant count rate of Jobseekers Allowance claimants decreased slightly in most of the English regions and Scotland. In the North East and Northern Ireland, however, there was an increase in the claimant rate, whilst Wales and Yorkshire and The Humber saw no change year-on-year.
The total foreign exports of goods from each of England, Wales and Northern Ireland decreased in 2012 compared with 2011 due mostly to declines in exports to the EU. Scotland, however, experienced an increase in total exports (1.6%), helped by a 4.4% increase in non-EU exports. With a reduction of 10.2%, Wales experienced the largest overall decrease in exports in 2012. Of the English regions, the largest decreases in total exports were in London and the South East (-3.4%), while the West Midlands saw the largest increase (6.9%).
Back to table of contents9. About this release
Gross Disposable Household Income (GDHI) is the amount of money that all of the individuals in the household sector have available for spending or saving after income distribution measures (for example taxes, social contributions and benefits) have taken effect.
GDHI does not provide measures relating to actual households or family units.
The household sector comprises all individuals in an economy, that is people living in traditional households as well as those living in institutions such as retirement homes and prisons. The sector also includes sole trader enterprises (the self-employed) and non-profit institutions serving households (NPISH). Examples of the latter include charities and most universities.
A distinction can be made between the two stages of income distribution:
The allocation of primary income account shows the income of households generated from employment and ownership of assets. The balance of primary income is equal to total primary resources less total primary uses.
- Total primary resources: compensation of employees (income from employment), operating surplus (mainly rental, imputed or otherwise), mixed income from self-employment and property income received from financial assets
- Total primary uses: property income paid (for example mortgages, rent on land)
The secondary distribution of income account includes government redistribution of income. The balance of secondary income is equal to total secondary resources less total secondary uses.
- Total secondary resources: social benefits (for example state pensions, Jobseekers Allowance, incapacity benefits) and other current transfers received (such as financial gifts, non-life insurance claims)
- Total secondary uses: current taxes on income and wealth, social contributions paid (employee's pension/social security contributions) and other current transfers paid (for example non-life insurance premiums)
GDHI is derived from the balances of primary and secondary income. It includes consumption of fixed capital (the decline in value of fixed assets due to normal wear and tear, items becoming obsolete and a normal rate of accidental damage).
GDHI = Balance of Primary Income + Balance of Secondary Income
GDHI estimates in this bulletin are available at three geographical levels, in accordance with the Nomenclature of Units for Territorial Statistics (NUTS). See background note 1.
Per head data takes account of the entire resident population of regions, sub-regions and local areas. The working population and the economically inactive are included. These estimates are produced at current prices which include the effects of price changes (inflation).
Revised population data from the 2011 ONS Census have been used in these estimates. The revised data cover 2001-2011.
Regional GDHI estimates for 2012 are released for the first time with revisions back to 1997 (see background note 3). These estimates update those published in April 2013. Estimates for 2012 should be considered provisional until revised next year.
For the years 1997-2010, these estimates are consistent with the National Accounts Blue Book 2013. For the years 2011-2012, the UK estimates for taxes paid (and therefore the component totals/balances) are inconsistent with the data published in Blue Book 2013. This anticipates the correction of an error that will be rectified in Blue Book 2014.
At component level for the period 2009-2012 there has been a notable reduction across all regions in property income received (resources) and property income paid (uses) in the household and NPISH sector. This can be traced to the national estimates for the UK (National Accounts Blue Book 2013), where large falls occurred in the national property income received and paid. These falls can be attributed to the impact of the financial crisis upon the FISIM (Financial Intermediation Services Indirectly Measured) adjustments applied within the household and NPISH sector. An article on this is available on the ONS website (109.8 Kb Pdf) .
10. Domestic (UK) use of regional GDHI estimates
These statistics provide an overview of economic diversity and social welfare at regional, sub-regional and local area levels. They supply information about the availability of disposable income throughout the UK. Disposable income is a concept which can be used to approximate the ‘material welfare’ within the household sector, although the term ‘welfare’ is commonly used in ways that go beyond financial wealth and, as such, cannot be measured by a single statistic.
These estimates are used by the UK Government and the devolved administrations of Northern Ireland, Scotland and Wales to formulate and monitor economic policy and allocate resources.
The Scottish Government uses these statistics within the Scottish National Accounts Project (SNAP) system, in modelling quarterly estimates of Household Distribution and Use of Income and also in the compilation of a Households’ Saving Ratio. The resulting SNAP outputs are widely used by economic commentators and academics in Scotland.
These estimates are not currently used in any of the Scotland Performs National Indicators, however there is an increasing demand for the Scottish Government to provide a wider range of socio-economic indicators alongside Gross Domestic Product. The Scottish Government is considering including Household Income and Households’ Saving Ratio in this suite of national indicators.
The Welsh Government regards the GDHI statistics as a key economic indicator. A current example of this is through the Programme for Government. This identifies the Welsh Government’s commitments and the means by which progress will be measured over the five-year term. Within the Programme for Government, and in relation to Growth and Sustainable Jobs, GDHI per head and Primary Income per head are identified as two of four key outcome indicators for Wales.
The Northern Ireland Executive uses these statistics in conjunction with other economic measures and surveys to give an overall picture of the economy.
Local authorities use these statistics to facilitate evidence-based policy-making. These statistics inform the general public and provide insight into the relative socio-economic picture of the UK and issues such as the ‘North-South divide’. They are used in the House of Commons library to answer enquiries from MPs about regional differences in the income of households.
The ONS Regional Accounts team also receives general enquiries relating to these estimates from a diverse range of bodies including other government departments, local authorities, business analysts, consultancy firms, financial institutions, economists and the media (provincial and national). These statistics also facilitate academic research by individuals and universities within the UK and abroad.
General enquiries about the estimates, compilation methods, quality information or difficulties in finding latest figures can be e-mailed to the Regional Accounts team at regionalaccounts@ons.gov.uk or by telephoning +44 (0)1633 456878.
Back to table of contents11. European use of disposable household income estimates
The production of regional disposable income of households is a legal requirement under the European System of Accounts (ESA 1995). Whereas Gross Disposable Household Income is compiled for UK domestic use, the estimates provided to Eurostat (the statistical department of the European Commission) are net of consumption of fixed capital (see section ‘About this release’) at the NUTS2 level.
Consumption of fixed capital (CFC) is included in the Operating Surplus/Mixed Income (OS/MI) components of the Primary Income Account. The CFC element is estimated and removed from the regional OS/MI, to derive the Net Disposable Household Income (NDHI) estimates.
The European Union (EU) uses these NDHI estimates to inform regional policy and analysis, and to identify disparities in regional welfare across the Member States.
Member States provide estimates of NDHI in their national currencies. Eurostat then converts these using specific purchasing power standards for final consumption expenditure, called Purchasing Power Consumption Standards (PPCS). This process enables meaningful comparisons to be made between the Member States.
Figure 10 illustrates the range of disposable income across EU NUTS2 sub-regions in 2011. The NUTS2 sub-regions with the highest and lowest disposable income per inhabitant (in purchasing power standards (PPS)) are displayed for each EU country. Some EU countries are represented by a single line as they only have one constituent NUTS2 sub-region, for example Estonia.
Of the NUTS2 sub-regions shown on the chart, Luxembourg had the highest disposable income in 2011, followed by Oberbayern in Germany, followed by Inner London in the United Kingdom. This was the first year where Inner London did not have the highest disposable income across the EU since the start of the timeseries in 2000. The sub-region with the lowest disposable income in 2011 was Nord-Est in Romania, followed by Severozapaden in Bulgaria.
Figure 10: Disposable income of private households by NUTS2 regions in PPS per inhabitant, highest and lowest NUTS2 region within each country, 2011 [1,2]
![Figure 10: Disposable income of private households by NUTS2 regions in PPS per inhabitant, highest and lowest NUTS2 region within each country, 2011 [1,2]](/resource?uri=/economy/regionalaccounts/grossdisposablehouseholdincome/bulletins/regionalgrossdisposablehouseholdincomegdhi/2014-06-04/cde39f07.png)
Source: Office for National Statistics
Notes:
- Croatia, Cyprus, Malta and Slovenia data not available.
- Figures are shown in Purchasing Power Standards (PPS) (based on final consumption) per inhabitant.
Download this image Figure 10: Disposable income of private households by NUTS2 regions in PPS per inhabitant, highest and lowest NUTS2 region within each country, 2011 [1,2]
.png (42.7 kB) .xls (371.7 kB)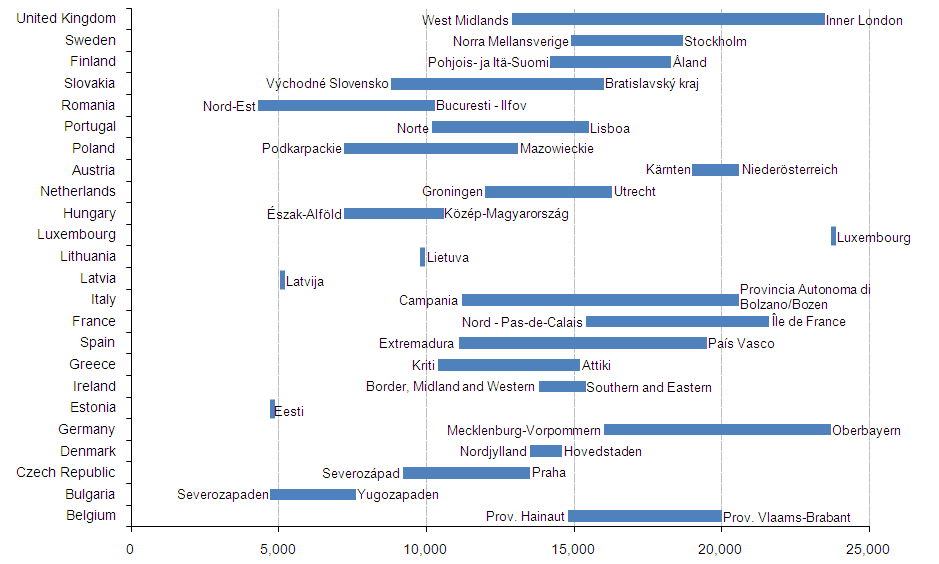
12. Future work plans
The publication of Regional Gross Disposable Household Income (GDHI) estimates for the period 1997 to 2013 is currently planned for spring 2015
ONS plans to publish estimates of regional, sub-regional and local Gross Value Added compiled using the income approach (GVA(I)) for 1997 to 2013, on the 10th of December 2014
A re-release of the GVA(I) data for 1997 to 2012, originally published in December 2013, is planned for the 2nd of July 2014. The re-release will contain GVA per head data updated to incorporate recently published Scottish Census population data. It will be accompanied by additional analyses and analytical tools
On the 18th December 2013 ONS Regional Accounts published experimental estimates of regional real Gross Value Added, compiled using the production approach (GVA(P)). These estimates are in constant prices, deflated to remove the effect of inflation. An update to these estimates is planned for 18th December 2014. During 2014-2015 a regional GVA balancing project will consider the viability of producing a single balanced measure of regional GVA
Changes in NUTS boundaries arising from the 2013 NUTS review will become active in January 2015. These changes will be implemented in the regional GDHI publication scheduled for spring 2015 and the regional GVA(I) and GVA(P) publications scheduled for December 2015. At NUTS2 level, Inner London will be split into two new NUTS2 sub-regions, and Outer London will be split into three. At NUTS3 level, 14 existing NUTS3 local areas in England will be split into 48. More information on these changes can be found here
Relevant methodological changes arising from the introduction of the European System of Accounts 2010 (ESA 2010) will be implemented in the Regional Accounts during the course of 2014 and beyond, in step with the UK National Accounts
During 2014 and beyond, the ONS Open Data Project will improve access to Regional Accounts data on the ONS website and offer greater facility for users to customise datasets
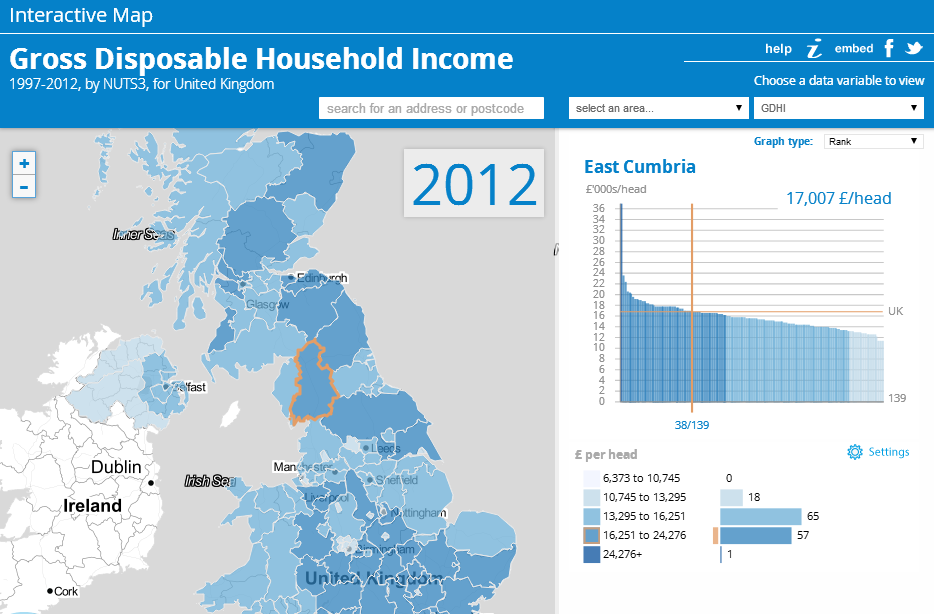
13. Interactive map
This interactive map allows the user to create their own analyses of GDHI per head . Data are broken down into 139 NUTS3 local areas, and each component of household income is listed individually.
Users can select a combination of region, component, and time series and display the data as desired through a range of adjustable settings.
Gross Disposable Household Income
