Table of contents
- Main points
- Things you need to know about this release
- Real households and non-profit institutions serving households (NPISH) disposable income increased at its highest rate since 2001
- What is the saving ratio?
- The households and non-profit institutions serving households (NPISH) saving ratio is at the lowest rate since 2008
- Net lending (+) and net borrowing (-) by sector
- Upcoming changes to this bulletin
- Quality and methodology
1. Main points
In Quarter 2 (Apr to June) 2016, the central government, local government, public corporations, financial corporations and households and non-profit institutions serving households (NPISH) sectors were net borrowers. The private non-financial corporations and rest of the world sectors were net lenders. Compared with the previous quarter, public corporations switched from net lenders to net borrowers. All other sectors remain unchanged.
The level of real households and NPISH disposable income (RHDI) increased by 0.6% in Quarter 2 2016, following an increase of 0.8% in the previous quarter. RHDI in Quarter 1 (Jan to Mar) 2016 has been revised down from growth of 2.0%. RHDI is now 8.8% higher than its pre-downturn peak in Quarter 4 (Oct to Dec) 2007.
For the year 2015, RHDI increased by 3.3% following an increase of 1.5% in 2014. This is the highest annual increase in the RHDI since 2001, when it increased by 4.7%.
In Quarter 2 2016, the households and NPISH saving ratio was 5.1%, compared with 5.6% in Quarter 1 2016. This is the lowest saving ratio since Quarter 3 (July to Sept) 2008, when it was 4.8%. The households and NPISH saving ratio for Quarter 1 2016 has been revised down from 5.9%.
Households and non-profit institutions serving households net borrowing increased in Quarter 2 2016 to £7.4 billion from net borrowing of £4.2 billion in the previous quarter. Households and NPISH have been net borrowers in eight of the ten quarters between Quarter 1 2014 and Quarter 2 2016.
Back to table of contents2. Things you need to know about this release
From January 2017 we are improving the way we publish economic statistics, with related data grouped together under new "theme" days. This will increase the coherence of our data releases and involve minor changes to the timing of certain publications. For more information see 'Changes to publication schedule for economic statistics’.
This bulletin presents the main economic indicators and summary estimates from the institutional sectors of the UK economy: private non-financial corporations, public corporations, financial corporations, central and local government and households and non-profit institutions serving households (NPISH) that are presented in the UK Economic Accounts (UKEA) dataset.
The UKEA provides detailed estimates of national product, income and expenditure, UK sector non-financial and financial accounts and UK balance of payments. The UKEA related to this release can be found at the end of the PDF version of this bulletin.
The data used in this bulletin have a broad range of users. They are widely used by government departments to inform and monitor the effect of policy decisions. The data also aids assessments of the economy: informing the Bank of England’s Monetary Policy Committee (MPC) when setting monetary policy and the Office for Budget Responsibility’s (OBR) forecasts and evaluations of economic growth and public sector finances. The data are also used by businesses and knowledge and research institutions such as think-tanks, lobby groups and universities, and by researchers, analysts, academics, students and trade organisations.
Revisions in this bulletin are made in line with the National Accounts Revisions Policy. The earliest period open for revision in this release is Quarter 1 (Jan to Mar) 2015.
Back to table of contents3. Real households and non-profit institutions serving households (NPISH) disposable income increased at its highest rate since 2001
For the year 2015, real households and non-profit institutions serving households (NPISH) disposable income increased by 3.3% following an increase of 1.5% in 2014. This is the highest annual increase in the level of real households and NPISH disposable income since 2001, when it increased by 4.7%.
The latest annual rise reflects an increase of 3.6% in nominal gross disposable income partially offset by a 0.3% rise in the households and NPISH final consumption deflator. This increase in nominal gross disposable income was predominantly due to rises in wages and salaries of £29.1 billion, net social benefits other than transfers in kind of £13.8 billion, together with a rise in gross operating surplus and mixed income of £10.6 billion. This was partially offset by a rise in taxes on income and wealth of £9.5 billion and a fall in net property income of £3.7 billion.
Strong wages and salaries growth is the result of an increase in the number of people employed across the labour market and an increase in average weekly earnings during the year. The number of people in employment grew by 2.1% in 2015 and average weekly earnings including bonuses increased by 2.3% in 2015.
The £13.8 billion increase in net social benefits other than transfers in kind during 2015 is attributable in part to pension freedoms introduced by the government in April 2015 which enabled people over the age of 55 to draw down their pension pots more easily. Other social insurance benefits, which includes withdrawals made from pension schemes, has increased from £29.7 billion in Quarter 1 2015, the quarter before the reforms were introduced, to £35.4 billion in Quarter 2 (Apr to June) 2016.
Figure 1: Other social insurance benefits (resource)
Quarter 1 (Jan to Mar) 2007 to Quarter 2 (Apr to June) 2016
Source: Office for National Statistics
Download this chart Figure 1: Other social insurance benefits (resource)
Image .csv .xlsThe level of real households and NPISH disposable income increased by 0.6% in Quarter 2 2016, following an increase of 0.8% in the previous quarter (Figure 2).
Figure 2: UK real households and non-profit institutions serving households disposable income, quarter on quarter
Quarter 3 (Jul to Sept) 2012 to Quarter 2 (Apr to June) 2016
Source: Office for National Statistics
Download this chart Figure 2: UK real households and non-profit institutions serving households disposable income, quarter on quarter
Image .csv .xlsThe rise in the latest quarter reflects a 0.9% rise in nominal gross disposable income partially offset by a 0.3% rise in the households and NPISH final consumption deflator. This increase in nominal gross disposable income was driven by a rise in wages and salaries of £2.8 billion, a fall in taxes on income and wealth of £2.2 billion and a rise in gross operating surplus and mixed income of £1.8 billion. This was partially offset by a fall in net property income of £5.2 billion.
The fall in net property income in the latest quarter is primarily the result of a fall in dividend income from corporations of £2.7 billion. This follows an increase in dividend income from corporations of £1.9 billion in the previous quarter which was the largest increase in dividend income from corporations since Quarter 1 2011, when it increased by £2.8 billion.
A number of dividends paid in Quarter 2 2015 were not paid in Quarter 2 2016. Reasons for this include company takeovers and restructures, special dividend payments and the advancement of payments to Quarter 1 2016.
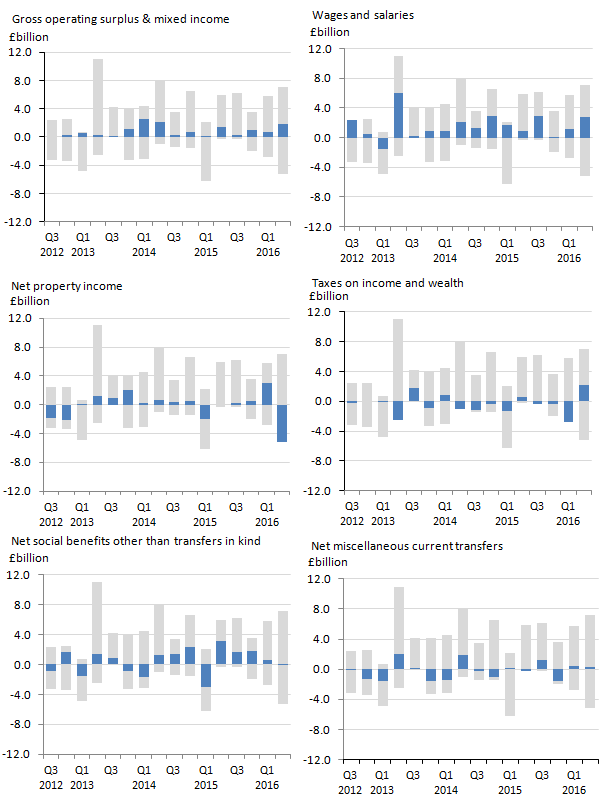
Figure 3 shows the main contributions by transaction to the change in households and NPISH gross disposable income in each quarter. The grey bars show the total contributions of the main transactions. The blue bars highlight the contribution of individual transactions in each quarter.
Figure 3: UK main households and non-profit institutions serving households gross disposable income components
Quarter 3 (July to Sept) 2012 to Quarter 2 (Apr to June) 2016
Source: Office for National Statistics
Notes:
- The blue bars highlight the contribution of individual transactions in each quarter .
Download this image Figure 3: UK main households and non-profit institutions serving households gross disposable income components
.png (37.5 kB) .xls (27.1 kB)
Figure 4: UK real households and non-profit institutions serving households disposable income, quarter on quarter
Quarter 1 (Jan to Mar) 2007 to Quarter 2 (Apr to June) 2016
Source: Office for National Statistics
Download this chart Figure 4: UK real households and non-profit institutions serving households disposable income, quarter on quarter
Image .csv .xlsReal households and NPISH disposable income has been on a broadly upward trend since Quarter 1 2014, increasing by 8.1% during this period. This follows slower growth between Quarter 1 2007 and Quarter 4 (Oct to Dec) 2013, during which time RHDI increased by 4.0%. The 4.7% growth in RHDI in Quarter 2 2009 is attributable to an increase in compensation of employees, a fall in taxes on income and wealth and an increase in net social benefits other than transfers in kind, coupled with a fall in the household and NPISH deflator.
In recent quarters, the relatively low households and NPISH deflator (reflecting low consumer price inflation) has had only a small offsetting effect on gross disposable income growth.
Back to table of contents4. What is the saving ratio?
Gross saving estimates the difference between households and non-profit institutions serving households (NPISH) total available resources (mainly wages received, revenue of the self-employed, social benefits and net income such as interest on savings and dividends from shares, but excluding taxes on income and wealth) and their current consumption (expenditure on goods and services).
All of the components that make up gross saving and total available resources and in fact all sector accounts data apart from real households’ and NPISH disposable income (RHDI), are estimated in current prices (CP). These are sometimes known as nominal prices, meaning that they include the effects of price changes.
The saving ratio is published in the UK Economic Accounts (UKEA) as non-seasonally adjusted (NSA) and seasonally adjusted (SA) formats, with the latter removing seasonal effects to allow comparisons over time. The saving ratio can be volatile and is sensitive to even relatively small movements to its components, particularly on a quarterly basis. This is because gross saving is a small difference between 2 numbers. It is therefore often revised at successive publications when new or updated data are included.
The saving ratio is considered to be an indicator of households and NPISH confidence. A higher saving ratio may be the result of an increase in income, a decrease in expenditure, or some combination of the two. A rise in the saving ratio may be an indication that households are acting more cautiously by spending less.
Conversely, a fall in the saving ratio may be an indication that households are more confident and spending more. Other factors such as interest rates and inflation should also be considered when interpreting the households and NPISH saving ratio.
Back to table of contents5. The households and non-profit institutions serving households (NPISH) saving ratio is at the lowest rate since 2008
Annually for 2015, the saving ratio was 6.1%, compared with 6.8% in 2014. This is the lowest annual saving ratio since 2008 when it was 5.4%. The fall in the saving ratio in 2015 reflects rises in final consumption expenditure of £33.0 billion and taxes on income and wealth of £9.5 billion and a fall in net property income of £3.7 billion. This was partially offset by rises in wages and salaries of £29.1 billion and gross operating surplus and mixed income of £10.6 billion.
In Quarter 2 (Apr to June) 2016, the households and non-profit institutions serving households (NPISH) saving ratio was 5.1%, compared with 5.6% in the previous quarter. This is the lowest saving ratio since Quarter 3 (July to Sept) 2008, when it was 4.8%.
The fall in the saving ratio in Quarter 2 2016 reflects a fall in net property income of £5.2 billion and a rise in final consumption expenditure of £3.7 billion. This was partially offset by rises in wages and salaries of £2.8 billion and gross operating surplus and mixed income of £1.8 billion and a fall in taxes on income and wealth of £2.2 billion.
Figure 5: UK households and non-profit institutions serving households quarterly saving ratio, latest data and previously published data
Quarter 3 (July to Sept) 2012 to Quarter 2 (Apr to June) 2016
Download this chart Figure 5: UK households and non-profit institutions serving households quarterly saving ratio, latest data and previously published data
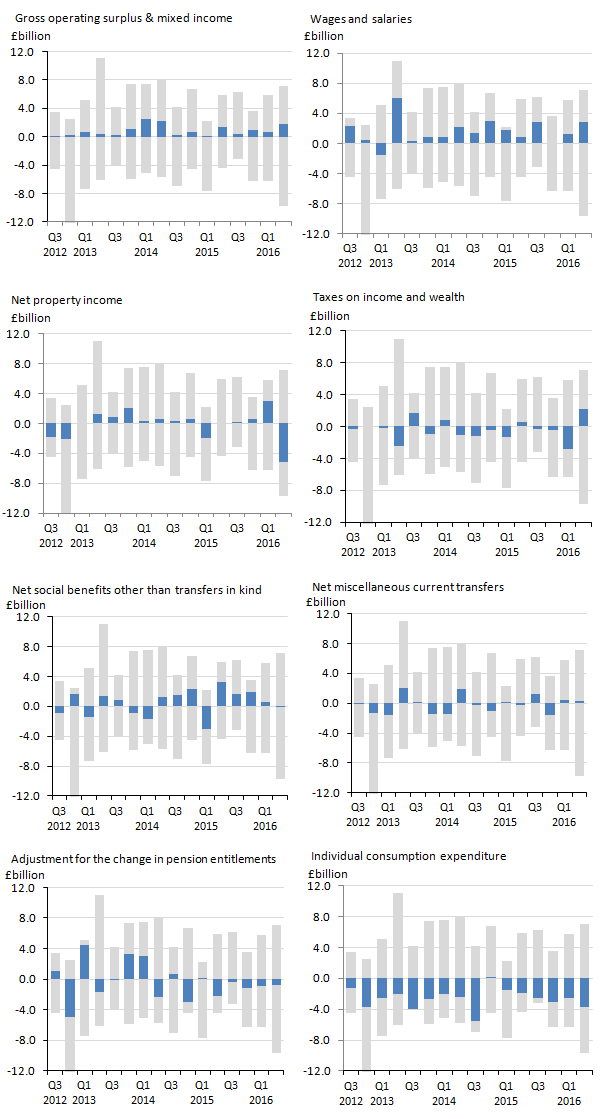
Image .csv .xlsFigure 6 shows the main contributions by transaction to the change in households and NPISH gross saving in each quarter. The grey bars show the total contributions of the main transactions. The blue bars highlight the contribution of individual transactions in each quarter.
Figure 6: UK main households and non-profit institutions serving households saving ratio components
Quarter 3 (July to Sept) 2012 to Quarter 2 (Apr to June) 2016
Source: Office for National Statistics
Notes:
- The blue bars highlight the contribution of individual transactions in each quarter.
Download this image Figure 6: UK main households and non-profit institutions serving households saving ratio components
.png (62.5 kB) .xls (27.1 kB)
Figure 7: UK households and non-profit institutions serving households quarterly saving ratio
Quarter 1 (Jan to Mar) 1997 to Quarter 2 (Apr to June) 2016
Download this chart Figure 7: UK households and non-profit institutions serving households quarterly saving ratio
Image .csv .xlsThe saving ratio was on a broadly downward trend from 1997 until 2008. The saving ratio fell from 10.5% in Quarter 1 (Jan to Mar) 2001 to 4.3% in Quarter 1 2008, prior to the economic downturn.
Between Quarter 2 2009 and Quarter 4 (Oct to Dec) 2010 the saving ratio rose sharply, peaking at 11.5% in Quarter 1 2010. During this time, households experienced greater economic and financial uncertainty which typically results in households decreasing spending and increasing their level of saving.
The saving ratio fell sharply from its post-downturn peak but remained generally stable, averaging 6.6%, between Quarter 4 2012 and Quarter 3 (July to Sept) 2015. Increased growth in household total resources broadly offset increases in consumption expenditure during this period. The falling saving ratio from Quarter 4 2015 to Quarter 2 2016 reflects increases in consumption expenditure outpacing the growth in household total resources.
Back to table of contents6. Net lending (+) and net borrowing (-) by sector
Annually for 2015, the central government, local government, financial corporations and households and non-profit institutions serving households (NPISH) sectors were net borrowers. The public corporations, private non-financial corporations and rest of the world sectors were net lenders.
Compared with 2014, local government and households and NPISH switched from net lenders to net borrowers. All other sectors remain unchanged.
In Quarter 2 (Apr to June) 2016, the central government, local government, public corporations, financial corporations and households and NPISH sectors were net borrowers. The private non-financial corporations and rest of the world sectors were net lenders.
Compared with the previous quarter, public corporations switched from net lenders to net borrowers. All other sectors remain unchanged.
Figure 8: UK net lending (+) / net borrowing (-) by sector
Quarter 1 (Jan to Mar) 2016 to Quarter 2 (Apr to June) 2016
Source: Office for National Statistics
Notes:
- Please note abbreviations are:
CG - Central government
LG - Local government
PC - Public corporations
FC - Financial corporations
PNFCs - Private non-financial corporations
HH and NPISH - Households and non-profit institutions serving households
RW - Rest of the world
Download this chart Figure 8: UK net lending (+) / net borrowing (-) by sector
Image .csv .xls
Table 1: Annual net lending (+) and net borrowing (-) by sector (£billion)
| 2014 to 2015 | ||
| 2014 | 2015 | |
| Central government | -101.9 | -77.3 |
| Local government | 0.1 | -4 |
| Public corporations | 0.9 | 0.9 |
| Financial corporations | -17.9 | -26.1 |
| Private non-financial corporations | 33 | 18.5 |
| Households and NPISH | 0.3 | -10.8 |
| Rest of the world | 85.4 | 101.2 |
| Source: Office for National Statistics | ||
Download this table Table 1: Annual net lending (+) and net borrowing (-) by sector (£billion)
.xls (25.6 kB)
Table 2: Quarterly net lending (+) and net borrowing (-) by sector, £billion
| Quarter 1 (Jan to Mar) 2016 to Quarter 2 (Apr to June) | ||
| Q1 2016 | Q2 2016 | |
| Central government | -13.3 | -13.8 |
| Local government | -3.4 | -1.8 |
| Public corporations | 0.6 | -0.2 |
| Financial corporations | -8.8 | -7.8 |
| Private non-financial corporations | 5.7 | 4.7 |
| Households and NPISH | -4.2 | -7.4 |
| Rest of the world | 26.5 | 29 |
| Source: Office for National Statistics | ||
Download this table Table 2: Quarterly net lending (+) and net borrowing (-) by sector, £billion
.xls (26.6 kB)Central government
Annually for 2015, central government net borrowing was £77.3 billion, following net borrowing of £101.9 billion in 2014. This decrease in net borrowing was mainly due to rises in taxes on income and wealth of £11.4 billion, taxes on production of £7.9 billion, social contributions received of £6.5 billion and net property income of £5.9 billion. This was partially offset by rises in final consumption expenditure of £4.9 billion, social benefits other than transfers in kind of £4.8 billion, subsidies of £1.6 billion and a fall in net capital transfers payable of £1.7 billion.
In Quarter 2 2016, central government net borrowing was £13.8 billion. This was driven by falls in taxes on income and wealth of £2.0 billion and other current transfers of £1.2 billion and a rise in social benefits other than social transfers in kind of £0.4 billion offset by rises in social contributions of £1.9 billion and a rise in net property income of £1.3 billion.
Quarter 1 2016 central government net borrowing decreased to £13.3 billion compared to £18.4 billion for Q4 2015. This is the lowest quarterly central government net borrowing since Quarter 1 2008, when it was £11.6 billion. Central government net borrowing in the first half of 2016 of £27.1 billion is the lowest central government net borrowing in the first half of a year since 2007, when it was £18.6 billion.
Local government
Annually for 2015, local government’s switch to net borrowing was mainly driven by falls in net other current transfers of £3.3 billion and net capital transfers of £0.8 billion, and rises in gross capital formation of £1.2 billion and net social benefits other than transfers in kind of £0.8 billion. This was partially offset by a rise in net other current taxes of £0.9 billion and other smaller changes in other components. 2014 is the only year since 1997 in which the local government sector has been a net lender.
In Quarter 2 2016, local government net borrowing was £1.8 billion, following net borrowing of £3.4 billion in the previous quarter. This decrease in net borrowing was mainly due to rises in net capital transfers of £0.7 billion, net other current taxes of £0.4 billion and social contributions of £0.4 billion and other smaller changes in other components. This was partially offset by a fall in social benefits other than transfers in kind of £0.3 billion and a rise in gross capital formation of £0.2 billion.
Public corporations
Annually for 2015, public corporations’ net lending was £0.9 billion, unchanged from the previous year. This was mainly due to rises in gross capital formation of £0.3 billion and a fall in net property income of £0.2 billion, offset by a rise in net capital transfers of £0.5 billion.
For Quarter 2 2016, public corporations’ switch to net borrowing was mainly driven by a rise in net acquisitions of non-produced non-financial assets of £0.4 billion and falls in gross operating surplus of £0.2 billion and net property income of £0.2 billion.
Financial corporations
Annually for 2015, financial corporations’ net borrowing was £26.1 billion, following net borrowing of £17.9 billion in 2014. This increase in net borrowing was mainly due to a fall in gross operating surplus of £3.7 billion and a rise in gross capital formation of £3.7 billion. This was partially offset by rises in miscellaneous current transfers of £0.6 billion and net property income of £0.4 billion.
In Quarter 2 2016, financial corporations’ net borrowing was £7.8 billion, following net borrowing of £8.8 billion in the previous quarter. This decrease in net borrowing was mainly due to rises in gross operating surplus of £0.7 billion, net property income of £0.4 billion and miscellaneous current transfers of £0.3 billion.
Private non-financial corporations (PNFCs)
Annually for 2015, PNFCs net lending was £18.5 billion, following net lending of £33.0 billion in 2014. This decrease in net lending was mainly due to a fall in net property income of £15.2 billion and rises in gross capital formation of £2.6 billion and taxes on income of £1.2 billion. This was partially offset by a rise in gross operating surplus of £4.7 billion.
In Quarter 2 2016, PNFCs net lending was £4.7 billion, following net lending of £5.7 billion in the previous quarter. This decrease in net lending was mainly due to rises in gross capital formation of £5.1 billion and taxes on income of £0.4 billion and falls in gross operating surplus of £0.7 billion and net capital transfers of £0.5 billion. This was partially offset by a rise in net property income of £5.0 billion.
Households and NPISH
In Quarter 2 2016, households and NPISH net borrowing was £7.4 billion, following net borrowing of £4.2 billion in the previous quarter. This is the highest households and NPISH net borrowing since Quarter 1 2008 when it was £8.1 billion. The increase in net borrowing in the latest quarter was mainly due to a fall in net property income of £5.2 billion and a rise in final consumption expenditure of £3.7 billion. This was partially offset by rises in compensation of employees of £4.4 billion and gross operating surplus and mixed income of £1.8 billion and a fall in taxes on income and wealth of £2.2 billion.
Annually for 2015, households and NPISH switch to net borrowing was mainly driven by rises in final consumption expenditure of £33.0 billion, taxes on income and wealth of £9.5 billion and gross capital formation of £5.2 billion and falls in net property income of £3.7 billion and net miscellaneous current transfers of £1.0 billion. This was partially offset by rises in compensation of employees of £30.8 billion and gross operating surplus and mixed income of £10.6 billion. 2015 is the first year since 2008 during which households and NPISH were net borrowers.
Between Quarter 1 1997 and Quarter 4 (Oct to Dec) 2008, quarterly growth in households and NPISH debt (which includes mortgages, loans and credit cards) averaged 2.2%, outpacing average quarterly growth in gross disposable income of 1.1%. Although households and NPISH increased their holding of unsecured loan liabilities over this period, the increase in loan debt was driven by long-term loans secured on dwellings.
Figure 9: Households and non-profit institutions serving households financial liabilities (loans)
Quarter 1 (Jan to Mar) 1997 to Quarter 2 (Apr to June) 2016
Source: Office for National Statistics
Download this chart Figure 9: Households and non-profit institutions serving households financial liabilities (loans)
Image .csv .xlsHouseholds and NPISH holdings of loan debt stabilised during the economic downturn as a combination of falling household confidence and tighter credit conditions resulted in a sharp reduction in new loans. The stock of households and NPISH unsecured loan debt fell by 4.0% between Quarter 4 2008 and Quarter 1 2012.
In recent quarters, households and NPISH loan liabilities have increased. From Quarter 4 2013 to Quarter 2 2016, unsecured loan liabilities increased by 20.9% driven by a strong increase in other long-term loan debt, whilst debt secured on dwellings has grown by 5.8% over this period.
Figure 10: Households and non-profit institutions serving households financial liabilities (unsecured loans)
Quarter 1 (Jan to Mar) 2007 to Quarter 2 (Apr to June) 2016
Source: Office for National Statistics
Download this chart Figure 10: Households and non-profit institutions serving households financial liabilities (unsecured loans)
Image .csv .xlsThe growth in unsecured loan liabilities from Quarter 4 2013 may have been supported by the recent strength of car sales as consumers take advantage of low interest rates on car dealership finance to purchase new vehicles.
Part of the recent rise in secured debt may be attributable to government “Help to Buy” schemes designed to enable a greater number of households to purchase their first house. The increase in transactions of long-term loans secured on dwellings in Quarter 4 2015 and Quarter 1 2016 coincides with the introduction of a stamp duty surcharge on buy-to-let property purchases from April 2016. The new legislation has increased the stamp duty payable on second homes so many investors may have advanced their property purchases to avoid paying the new higher stamp duty rates.
Rest of the world
Annually for 2015, rest of the world net lending was £101.2 billion, following net lending of £85.4 billion in 2014. This increase in net lending was mainly due to rises in net property income of £13.0 billion and the external balance of goods and services of £2.5 billion. This was partially offset by a fall in net other current transfers of £0.8 billion.
In Quarter 2 2016, rest of the world net lending was £29.0 billion, following net lending of £26.5 billion in the previous quarter. This increase in net lending was mainly due to rises in the external balance of goods and services of £2.7 billion, net capital transfers payable of £0.8 billion and net other transfers of £0.5 billion. This was partially offset by a fall in net property income of £1.6 billion.
For a more detailed briefing on the rest of the world sector, including the impact of the sterling exchange rate depreciation during 2016, please refer to the latest Balance of Payments publication.
Back to table of contents7. Upcoming changes to this bulletin
This bulletin is part of a developmental programme to improve coverage of the sector and financial accounts and we would welcome your feedback. If you would like to get in touch please contact us via email: sector.accounts@ons.gov.uk
From March 2017, this bulletin will be the source for the Sector Accounts commentary and data tables I, J1, J2, J3, K1 and K2 that are currently published in the Quarterly National Accounts.
Back to table of contents8. Quality and methodology
The UKEA provides detailed estimates of national product, income and expenditure, UK sector non-financial and financial accounts and UK balance of payments. The Quarterly Sector Accounts and the UKEA are published at quarterly, pre-announced intervals alongside the Quarterly National Accounts and Quarterly Balance of Payments statistical bulletins. These accounts are the underlying data that produce a single estimate of gross domestic product (GDP) using income, production and expenditure data.
The accounts are fully integrated, but with a statistical discrepancy, known as the statistical adjustment, shown for each sector account. This reflects the difference between the sector net borrowing or net lending from the non-financial account and the identified net borrowing or net lending in the financial accounts, which should theoretically be equal but differ due to different data sources and measurement practices.
An explanation of the sectors described in this article can be found in chapter 2 of the European System of Accounts 2010 (ESA10) manual.
National Statistics are produced to high professional standards set out in the UK Statistics Authority's Code of Practice for Official Statistics. They undergo regular quality assurance reviews to ensure that they meet customer needs. They are produced free from any political interference.
Back to table of contents