1. Main points
In 2016, the value of the UK’s unpaid household service work was estimated at £1.24 trillion – larger in size than the UK’s non-financial corporation sector; overall unpaid household service work was equivalent to 63.1% of gross domestic product (GDP).
The value of unpaid household production per head has grown at a faster rate than GDP per head between 2005 and 2016 – 67% compared with 31% respectively in current prices.
“Extended GDP” (e-GDP) – GDP plus unpaid household service work – grew annually by 3.3% in 2016, compared with 3.9% for GDP.
In 2016, 16.2% of consumer spending was spent on direct costs for providing unpaid work services, mainly spent on fuel, renting and food.
The overall value of unpaid adult care is increasingly being driven by those requiring around the clock full-time care, with continuous care hours accounting for 86.9% of total adult care hours in 2005 and 89.7% of adult care hours in 2016.
Growth in informal childcare output was 1.4% in 2016, lower than 4.3% growth in 2015; this was mainly due to a fall in the rate of growth of childcare prices.
2. Introduction
The UK’s Household Satellite Account accounts for and values unpaid production activity. This includes childcare, adult care, household services, as well as unpaid nutrition, transport, laundry and volunteering services, each of which is an important aspect of people’s lives, and is largely missing from regular economic statistics such as gross domestic product (GDP).
We measure these activities to expand upon the traditional analysis of GDP, which largely accounts for the market production and consumption of activities with a price, and freely-provided government services. As the Independent Review of Economic Statistics by Sir Charlie Bean reports:
“Today, contact with customers increasingly happens via the web. This has significant implications for consumer-facing business like banking, travel agency and insurance. Activities that were previously undertaken in the market economy have instead become part of “home production” instead. But, by convention, home production activities are not counted as part of GDP […] with potentially significant implications for the interpretation of conventional measures of productive activity.” (Bean 2016)
Measuring unpaid production and consumption provides a more complete picture of the activities that affect people’s well-being. Time spent on different activities can affect people’s personal well-being, particularly when considering activities people chose to do against activities seen more as responsibilities. People’s total hours of work (unpaid and paid) are also important for considering stress levels across the population, and the satellite account provides a framework to analyse hours spent on work versus leisure activities.
Measuring unpaid production also allows users to analyse the reciprocating relationship between unpaid work and the economic choices people make; the substitution between unpaid and paid activities is important for considering labour market and social policies together. This is also relevant for considering demographic changes. For example, accounting for adult care provision in an ageing society allows policymakers to consider how care provision interacts with labour market choices, and even poverty, such as in the recent report from Social Metrics Commission. Additionally, policies such as changes to the State Pension age and free childcare hours for working parents can be analysed for their impact on unpaid activities.
Accounting for unpaid activities is also increasingly important in a digital economy. Not only are many alternatives to traditional services increasingly being offered online free of charge (at point of use at least), but new activities and ways of production are being generated, such as online relationship forming and networking, and digital content production such as social media videos and blogs which are free to access. Additionally, with alternative labour market choices such as sharing economy activities, digitally enabled micro-volunteering services and contracting out of expertise, the impacts on household consumption may be generally missing from estimates such as household final consumption expenditure if these goods and services are free to use. Additionally, there may be impacts on the prices of other goods and services consumed by households through advertising funding models of online services, and so accounting for activities as they move between the production boundary is particularly important in economic analysis of impacts from digital production.
Back to table of contents3. Overall results
Figure 1 shows the overall value of unpaid household service work between 2005 and 2016, gross value added, and the contribution from each type of unpaid work captured.
Figure 1: Gross Value Added of Unpaid Household Service Production
Source: Household Satellite Account
Notes:
- Value of unpaid volunteering for 2016 has been estimated using changes in participation rates to extrapolate the 2015 estimate due to change in comparability of the survey data.
Download this chart Figure 1: Gross Value Added of Unpaid Household Service Production
Image .csv .xlsIn 2016, the value of the UK’s unpaid household service work was estimated at £1.24 trillion, equivalent to £18,933 per person. This is larger in size than the UK’s non-financial corporation sector, which was £1.04 trillion in the same period.
Unpaid transport services, such as driving yourself and others to work, accounted for the largest proportion of this total at 28.8%, while childcare services contributed the second-largest amount, equivalent to £5,358 per person in 2016. Over the whole period since 2005, the value of adult care, childcare, laundry, nutrition (cooking to eat at home) and transport services have all grown by over 50%.
Overall, the value of unpaid household service work was equivalent to 63.1% of gross domestic product (GDP) in 2016, down from 64% in 2015, which was the highest ratio since the beginning of this series in 2005. The lower proportion in 2016 is mainly due to the slower-than-GDP growth in the gross value added of unpaid childcare provision, at 0.4% between 2015 and 2016.
Considering “extended GDP” (e-GDP) – the value of household service work plus GDP – its value in 2016 would be £3.21 trillion in current prices. This experimental measure of beyond GDP explicitly accounts for substitution effects between market and non-market production as people switch from paid to own-provided services, and vice versa, so may better reflect society’s well-being. Figure 2 compares the growth of this extended GDP with current price GDP, as well as to the value added by unpaid production, per person, to consider how this alternative measure captures well-being.
Figure 2: Growth rates of GVA of unpaid production, GDP and e-GDP per person
Source: Office for National Statistic
Download this chart Figure 2: Growth rates of GVA of unpaid production, GDP and e-GDP per person
Image .csv .xlsGrowth in the value of unpaid production was faster than GDP in every year over this period except 2006, 2010 and 2016. Although the growth rates of GDP and e-GDP closely follow each other, there are important differences between these two measures that reflect the activities of unpaid work. For example, higher growth in e-GDP between 2007 and 2009 was mostly due to higher than average growths in unpaid transport services (15.8% on average over the period) and in adult care (6.5% on average over the period). Additionally, the 1.0 percentage point difference in 2015 of a higher e-GDP growth was mostly driven by a 3.8% increase in unpaid transport services, which was due in turn to individuals from England (excluding London) taking more longer journeys (defined as over 2 miles) in 2015 relative to 2014.
Another useful way to consider how our unpaid work estimates relate to national accounts data is to relate them to household spending. The production costs of unpaid household service work, termed intermediate consumption, are part of the overall value of goods and services consumers spend money on, reflected in the household final consumption expenditure estimates. Figure 3 shows the ratio of unpaid work’s intermediate consumption to total consumer spending.
Figure 3: Proportion of intermediate consumption of unpaid production to consumer spending
Source: Household Satellite Account
Notes:
- Intermediate consumption excludes the input of household and transport into other services.
Download this chart Figure 3: Proportion of intermediate consumption of unpaid production to consumer spending
Image .csv .xlsOn average between 1997 and 2016, 16.4% of consumer spending was on goods and services used as inputs to unpaid household service work. This is a significant ratio, equivalent to £2,651 spent per person in 2016. In recent years, the proportion has fallen, in 2016 it was a bit less than average, at 16.2%. There has been a decline since 2012 due to slower growth of unpaid work-led consumer spending, particularly reflected in a decline in electricity, gas and other fuel spending after 2013, as well as a slowdown in food purchases.
In 2016, this proportion was a bit less than average, at 16.2%. There has been a decline since 2012 due to slower growth of unpaid work-led consumer spending, particularly reflected in a decline in electricity, gas and other fuel spending after 2013, as well as a slowdown in food purchases.
The increase in the proportion between 2006 and 2012 is also due to higher fuel prices and its impact on food prices, with both rising faster than other goods and services consumed. As most of the services provided are seen as necessary, particularly adult and childcare, this proportion is useful to track the necessary costs households must account for when considering their spending.
Back to table of contents4. Focus on childcare
The gross value added (GVA) of informal childcare in 2016 was £351.8 billion in current prices.
Childcare output and hours
This section breaks down childcare provision by country and age group, considering some of the factors of differences between different children. The data relates to output of childcare, as opposed to GVA, because it is output that can be derived at a more granular level.
Figure 4: Growth rates of total output, prices and hours of informal childcare in the UK, 2014 to 2015 and 2015 to 2016
Source: Household Satellite Account
Download this chart Figure 4: Growth rates of total output, prices and hours of informal childcare in the UK, 2014 to 2015 and 2015 to 2016
Image .csv .xlsFigure 4 shows that the change in output value was driven by price increase in 2015 and by growth in hours in 2016. The price per hour of childcare grew by 3.2% between 2014 and 2015 but then only grew by 0.3% between 2015 and 2016. Total hours of informal childcare received grew by 0.9% between 2014 and 2015 and then by 1.1% between 2015 and 2016.
Figure 5: Output of informal childcare per child by country in 2016
Source: Household Satellite Account
Notes:
- Rounded to the nearest £100
Download this chart Figure 5: Output of informal childcare per child by country in 2016
Image .csv .xlsFigure 5 shows the output per child by country, in 2016 (£). England had the highest informal childcare output by child in 2016, valued at £32,400 per child, while Scotland had the lowest valued at £28,100 per child. The reason for this distinction between the countries is likely to be related to the level of formal care provision.
The link between formal and informal care provision
Taking both formal care time and then time alone and aggregating them, we use the residual hours to create an estimate for the total number of informal care hours received by children in the UK.
The way in which this works is that as children are enrolled in schools, nurseries, after school clubs or holiday clubs, it has an impact on the number of hours that they need to be cared for by parents, grandparents or other friends and family, thus lowering the unpaid informal care provision with increased formal care uptake.
The proportion of time alone per child remains constant between 2005 and 2013 and then has been recalculated using the latest UK time-use dataset for the period 2014 to 2016 (see methodological improvements section for assumed proportion of time alone by age group).
Figure 6: Formal childcare hours and informal childcare hours per child by country in 2016
Source: Household Satellite Account
Notes:
- Rounded to the nearest 10 hours.
Download this chart Figure 6: Formal childcare hours and informal childcare hours per child by country in 2016
Image .csv .xlsFigure 6 shows formal childcare provision in 2016 was highest in Scotland and lowest in England, representing 21% and 12% of total childcare hours per child respectively. Figure 7 shows that a high share of the total formal childcare hours provided by nurseries or playgroups was in Scotland in 2016.
Figure 7: Proportion share of all formal childcare hours by country and type in 2016
Source: Household Satellite Account
Notes:
- Numbers may not sum due to rounding.
Download this chart Figure 7: Proportion share of all formal childcare hours by country and type in 2016
Image .csv .xlsGiven that (a) approximately 7% of the UK child population were Scottish (consistent across age groups) and (b) formal care hours provision was higher than 7% of the total UK formal care hours in five of the seven categories in Figure 7, it suggests that higher uptake of a wide range of formal care services has resulted in less relative informal childcare provision in Scotland in 2016.
Recent changes in childcare provision by country
Figure 8: Annual output growth of informal care by country
Source: Household Satellite Account
Download this chart Figure 8: Annual output growth of informal care by country
Image .csv .xlsFigure 8 shows that growth between 2014 and 2015 was seen across all countries, ranging from 2.9% in Wales to 4.4% in England. Output growth was then lower between 2015 and 2016 across the UK, falling from 4.3% to 1.4%, which as mentioned in the earlier chart was due to a fall in the growth of childcare prices.
In Wales, where output growth was particularly low between 2015 and 2016, the negative growth was likely due to a combination of low price growth and stronger growth in formal hours provision within maintained schools. This is considered to be a cohort effect of more children starting school, particularly in Wales and England (see Table 1 for drivers of change in formal care hours by country). Growth in informal care output was highest for Scotland, with 2.8%, and lowest for Wales, with negative 0.2%, between 2015 and 2016.
Table 1: Drivers in change of formal care provision, 2015 and 2016
| England | Northern Ireland | Scotland | Wales | |||||
|---|---|---|---|---|---|---|---|---|
| 2014 to 2015 | 2015 to 2016 | 2014 to 2015 | 2015 to 2016 | 2014 to 2015 | 2015 to 2016 | 2014 to 2015 | 2015 to 2016 | |
| Schools | 1.0% | 1.2% | 0.4% | 0.5% | -0.0% | -0.1% | -0.2% | 1.4% |
| Other | -0.3% | -0.2% | -0.1% | 0.4% | 0.6% | 1.0% | -0.2% | 0.6% |
| Total growth | 0.7% | 1.0% | 0.3% | 0.9% | 0.5% | 0.9% | -0.4% | 2.0% |
| Source: Household Satellite Account | ||||||||
Download this table Table 1: Drivers in change of formal care provision, 2015 and 2016
.xls (27.6 kB)5. Focus on adult care
The gross value added (GVA) of informal adult care in 2016 was £59.5 billion in current prices.
To value informal adult care, we use the Family Resources Survey to estimate the number of hours of informal adult care received, categorising the care hours by four types of care:
continuous care is defined as the situation where someone requires care around the clock; these people are completely dependent on care 168 hours per week
practical care is where care is not continuous but involves physical help with paper work, financial matters or other practical help such as shopping, laundry, housework, gardening, doing odd-jobs, taking out for a walk, keeping an eye on someone
personal care is classified as help with personal care such as dressing, bathing, washing, shaving, feeding, using the toilet, physical help such as walking, getting up and down the stairs getting into and out of bed, and other sorts of personal help such as preparing meals, giving medicines and change dressings
personal and practical is a mix of the latter two categories, where care hours consist of both types of activity
Figure 9: Informal adult care output in the UK and prices of care by type, 2005 to 2016

Source: Household Satellite Account, Annual Survey of Hours and Earnings, Unit Costs of Health and Social Care
Download this image Figure 9: Informal adult care output in the UK and prices of care by type, 2005 to 2016
.png (12.8 kB)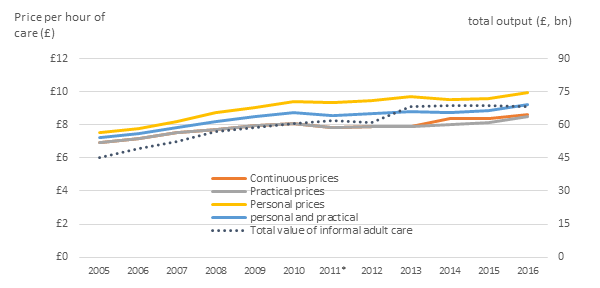
Figure 9 shows the output of adult care reached a peak of £68.7 billion in 2015. Output reduced slightly in 2016 to £68.3bn, despite a slight rise in prices across all types of adult care in the same year. This implies that the fall was due to a reduction in informal adult care hours received.
The 2016 annual price increase for all types of adult care was higher than inflation as measured by the Consumer Prices Index including owner occupiers’ housing costs (CPIH). It should be noted that the continuous prices were estimated using unit costs for adult care from 2014 to 2016 and therefore the comparability of 2013 and 2014 is not recommended. However, even with the change in source data, the continuous care price series movements are not dissimilar to those of the other types of care that are modelled on wage rates for caring professions.
Figure 10: Informal adult care hours in the UK, by type of care, 2005 to 2016
Source: Household Satellite Account, Family Resources Survey
Download this chart Figure 10: Informal adult care hours in the UK, by type of care, 2005 to 2016
Image .csv .xlsFigure 10 shows the hours of adult care received by type of adult care. Total informal adult care provided in 2016 amounted to 7.9 billion hours. This would equate to just over 4,000,000 adult social care workers working every week of the year at their median weekly hours, if they were to provide individual level care. It is evident that care for those who are completely dependent drives changes in the total care received. In 2005 continuous care hours made up 86.7% of all care hours received while in 2016 they made up 89.7%.
Between 2005 and 2016, continuous care hours have grown by 25.2% while the other “non-continuous” care types have all seen a slight fall in total hours received. Between 2005 and 2016 practical care fell by 11.3%, personal care fell by 5.2% and the mixed “personal and practical” category fell by 2.8%.
Figure 11: Number of adults receiving informal adult care, number of hours received and value of care output per adult in the UK in 2014, 2015 and 2016

Source: Household Satellite Account, Family Resources Survey
Download this image Figure 11: Number of adults receiving informal adult care, number of hours received and value of care output per adult in the UK in 2014, 2015 and 2016
.png (13.0 kB)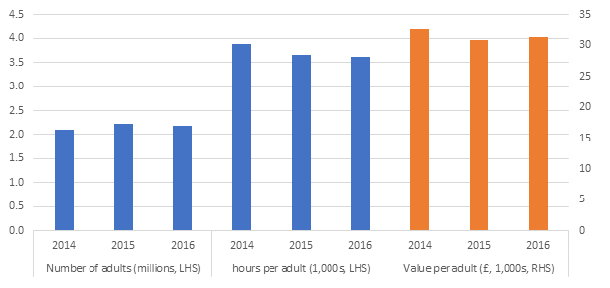
Figure 11 shows that the hours of care per adult, and subsequently the value of care per adult, has fallen slightly between 2014 and 2016. This would have been due to a decreasing proportion of personal and practical care hours.
The number of adults receiving care grew from 2.1 million in 2014 to 2.2 million in 2016.
Back to table of contents6. Upcoming analysis
This bulletin presents some of the main findings from the Household Satellite Account. Our previous full account was published in 2016, and before that, in 2002 based on an international drive. However, the framework allows further analysis, such as previous articles on Changes in the value and division of unpaid volunteering in the UK: 2000 to 2015 and on Leisure time in the UK: 2015. These allow us to better understand how unpaid work is allocated between members of society and how it might impact on economic welfare.
The UK’s Household Satellite Account forms part of our programme for Measuring National Well-being. It is an extension of the Stiglitz, Sen Fitoussi report on going beyond gross domestic product (GDP) in informing the public and policymakers about factors impacting on the economy and its individuals, beyond the traditional measures of economic production. Other measures in this direction include our measures of subjective well-being, personal well-being, including on relationships and loneliness, economic well-being, which focuses on the financial situation of households, and reporting on sustainable development goals.
Forthcoming analytical articles will examine in more depth topics identified as being of interest to policymakers and other users. These include:
regional analysis of unpaid work, in particular childcare
accounting for different types of childcare explicitly, such as supervision time, development time, and primary care
comparisons between unpaid work and market-equivalent industries
breakdowns of unpaid work by age of producer and consumer of the services, which will allow analysis of a sandwich generation providing both informal adult and childcare
7. Revisions analysis
Table 2: Scale of GVA revisions compared to the 2016 article, as a proportion of the previous account values
| Revisions to GVA since previous 2016 publication | ||||||||||||
|---|---|---|---|---|---|---|---|---|---|---|---|---|
| Household housing services | Transport | Nutrition | Clothing | Laundry | Childcare | Adult Care | Voluntary activity | Total | ||||
| 2005 | 11% | -7% | -5% | 0% | -4% | -2% | -3% | 0% | -1% | |||
| 2006 | 11% | 10% | -6% | 0% | -3% | -2% | -3% | 0% | 2% | |||
| 2007 | 12% | -20% | -6% | 0% | -3% | -2% | -6% | 0% | -5% | |||
| 2008 | 12% | -14% | -4% | 0% | -3% | -2% | -5% | 0% | -3% | |||
| 2009 | 19% | 10% | -2% | 0% | -3% | -2% | -2% | 0% | 5% | |||
| 2010 | 23% | 8% | -3% | 1% | -1% | -1% | -4% | 0% | 5% | |||
| 2011 | 28% | -4% | -2% | 0% | -2% | -1% | -1% | 0% | 2% | |||
| 2012 | 29% | 6% | -2% | 0% | -2% | -1% | -13% | 0% | 4% | |||
| 2013 | 31% | 23% | -3% | -9% | -2% | -1% | 5% | 0% | 9% | |||
| 2014 | 29% | 30% | -2% | -28% | -2% | 4% | 6% | -2% | 12% | |||
| Source: Household Satellite Account | ||||||||||||
Download this table Table 2: Scale of GVA revisions compared to the 2016 article, as a proportion of the previous account values
.xls (36.9 kB)
Table 3: Reasons for revisions by area
| Type of unpaid work | Output | Intermediate Consumption | Years affected |
| Childcare | New time alone estimates included – see methods section. Population estimates updated using latest data. | Consumption of a proportion of books purchased now included as intermediate into developmental childcare. | Full series |
| Adult care | Unit costs now used in place of wages for continuous adult care. Calendar years used from 2007 to 2016 in place of financial years. See methods section. | A proportion of out-of-pocket expenditure on therapeutic and pharmaceutical products now included as an intermediate for adult care. | IC – full series |
| Transport | Taxi prices now combined with minicab prices for 2005 to 2012. Sample of major cities taxi fares as set by local authorities now used for prices between 2015 and 2016. All prices smoothed using moving averages to control for volatility due to both changes in survey design and changes to price data sources over series. | Corrections were made in the apportioning of transport output into other unpaid services. | Taxi fares now included in National Transport Survey (NTS) analysis - 2005 to 2012 |
| Household housing services | New time use data was released in 2017 and allowed a new estimate to be created for the reference year 2015. This was implemented and resulted in an upward revision in time cleaning across the series. See methods section. | Corrections were made to the allocation of household housing services as an input into other services. Previously intermediate consumption for the household housing services had been overestimated and as a result GVA was underestimated. This is the main revision to the account as can be seen in the first column of the revisions analysis table. | IC - Full series |
| Volunteering | An improved methodology was implemented to account for scaling results to UK population level. | Not applicable | 2014 only |
| Clothing | None | Revised data on Household Final Consumption Expenditure caused revisions through the series. General improvements were also made the treatment of intermediate consumption. | Full series |
| Laundry | |||
| Nutrition | |||
| Source: Office for National Statistics | |||
Download this table Table 3: Reasons for revisions by area
.xls (29.7 kB)8. Methodological improvements
A range of methodological improvements have been made to the 2018 Household Satellite Account since the last publication in 2016. The main improvements are to the childcare, adult care, transport and household housing services areas of the account. Some improvements have also been made to the intermediate consumption estimates, which represent the value of goods or services that have been paid for and used up in the process of providing the unpaid service.
For original methodology, refer to the 2016 Household Satellite Account publication.
The following sections outline the methodological improvements to each area.
Childcare
In 2017, we commissioned a report (Suh, 2017) to provide a detailed review of our output-based measure of the value of informal childcare using the latest UK time-use data (Gershuny and Sullivan, 2017).
This report revealed a range of improvements we could implement within the methodology for measurement of the value of informal childcare. The first recommended we adjust the amount of time that children of different age groups spend alone (an important aspect of our residual estimations for informal childcare, where formal care time plus time alone leaves the residual time in informal care). The assumed time alone adjustments have been applied to the years 2014, 2015 and 2016 due to the challenges involved with re-processing the childcare back-series. Table 4 outlines the time alone assumptions by age before and after methods change.
Table 4: Time alone assumptions by age, before and after methods change
| United Kingdom, 2015 | |||
|---|---|---|---|
| Previous ONS Measure | ONS Revised Measure | ||
| Unsupervised Time | Child 0-4 years | 0% | 0% |
| Child 5-7 years | 0% | 0% | |
| Child 8-10 years | 0% | 25% | |
| Child 11 years | 0% | 27% | |
| Child 12 years | 10% | 29% | |
| Child 13 years | 20% | 31% | |
| Child 14 years | 30% | 33% | |
| Child 15 years | 40% | 35% | |
| Source: Informal Childcare Provision for Satellite Household Accounts in the UK (Suh, 2017) | |||
Download this table Table 4: Time alone assumptions by age, before and after methods change
.xls (27.6 kB)The second recommendation in the report suggested we should carry out a sensitivity price test. This test would involve applying different prices to proportions of informal childcare time after splitting the childcare hours by type of childcare (developmental versus physical, for example) based on estimated ratios. We plan to carry out this work but separately from this release, to adequately explore the topic before incorporating the results in the final methodology.
Adult care
In the first UK Household Satellite Account, the continuous care hours were valued using an hourly price for residential care sourced from the Care of Elderly People Market Survey 2001 conducted by Laing and Buisson. The exact methodological description states the reason for the choice as:
“The residential rate was chosen because the services provided by a residential home involves daily help with personal and practical care, as well as being on call. We have used this rather than a nursing home fee, as more specialised help is available in a nursing home. Sensitivity tests have been run using the nursing home fee. This residential home fee include meals and accommodation costs and will often include an ‘on call’ charge. When we calculate the value added by informal carers, an adjustment has been made to take into consideration the housing services and meals provided.”
In the 2016 UK Household Satellite Account, a suitable replacement price could not be found, as sensitivity testing revealed large differences when the prices were applied through the back series to overlap with the previous account estimates for reference year 2000. In absence of this price, a wage rate was used in its place. This was consistent with the method used to value non-continuous care but still represented an area where further improvements were earmarked.
In this release, the 2018 UK Household Satellite Account, suitable unit costs have been found in ‘Unit Costs of Health and Social Care’ published by the Personal Social Services Research Unit (PSSRU).
Unit costs for day-care services and residential care services are taken from this report in combination and used to derive a suitable price for continuous adult care hours. By taking an average of both day care and residential care and applying that derived figure to a third of the continuous care hours, the assumption is made that if the care was contracted out, care would be split between day-care centres and around-the-clock residential services during an eight-hour working day. The remaining two-thirds of the time would be valued at the residential rate. Unit costs for different types of care service were weighted by the proportion of those receiving adult care by type of disability.
We have continued to use wage rates for personal and practical care for the same reasons as stated in the original 2002 Household Satellite Account:
“Non-continuous personal care includes help with dressing, bathing, changing dressings and feeding. We have chosen the average wage of an assistant nurse or nursing auxiliary as the most appropriate market rate for valuing this care. This is because a nurse/nursing auxiliary will usually provide this type of specialised care outside the home. For non-continuous practical care we have used the hourly rate of care assistants and attendants in health and related occupations.”
We do not strip out transport costs as an intermediate into adult care, so the price of home care where carers must travel to client is not suitable.
The move back to using prices for continuous care allows a more rigorous methodological approach to be taken, where the output approach to valuing services is: units of service produced * price per unit, minus intermediate consumption.
Transport
In the previous 2016 Household Satellite Account, the price series was erratic and solely based on the price of minicab journeys per mile, as recorded in the National Transport Service between 2005 and 2012 and then updated by the Consumer Prices Index (CPI) for 2013 and 2014.
In this release, the price series has been stabilised by the inclusion of taxi rates per mile for 2002 to 2012, helping to increase the sample of trips within the analysis. Finally, an average price per mile has been taken from a sample of taxi fare rates published by local authorities from 2013 to 2016.
Moving averages have been applied to all the price series for each region in the analysis to smooth the price data further.
Household housing services
Our previous estimates were based on an earlier time-use estimate for the year 2000 and then modelled on changes in frequency or weekly hours reported in stylised type national surveys. The publication of the latest UK time-use survey (Gershuny and Sullivan, 2017) allowed us to benchmark the number of hours that individuals spend cleaning, gardening or doing DIY tasks on a typical day in reference year 2015. Further analysis of the 2017 dataset revealed that the measure was underestimating the total hours and so an upward adjustment has been made to growth across the series.
Intermediate consumption
Improvements have been made to the treatment of the output of unpaid services as input into other unpaid services and as a result there have been some revisions, particularly for household housing services where revisions have been largest across the account. We have also estimated a proportion of household final consumption expenditure (HHFCE), which is likely to be used in the process of providing adult care services and as a result adult care now has intermediate consumption (in addition to the input of housing) taken out of the output to estimate the gross value added.
Back to table of contents9. Acknowledgements
A wide range of people have fed into the development of the Household Satellite Account for this publication. The following are acknowledged for their important contributions to this account:
Edward Giles, Alastair Brown and Ben Hillman for their analysis on the value of informal care, volunteering, transport and nutrition
Dr Jooyeoun Suh (Centre for Time-use Research, University of Oxford) for her paper and recommendations relating to ONS’s informal childcare measurement
The ONS University Working Group from the University of New South Wales for their work to identify new data sources with which to price informal adult care hours
Meera Parmar for her work researching transport prices and her support publishing the account
Gueorguie Vassilev for assistance with article drafting and guidance through the latter stages of the project