Table of contents
1. Acknowledgements
Authors: Sami Hamroush and Michael Hardie
The authors would like to acknowledge contributions from Claire Dobbins, Chloe Gibbs, Daniel Robinson, Rachel Jones, Gill Sanderson and Alannah Breeze
Back to table of contents2. Main points:
Financial engineering is a broad term that encompasses many different corporate practices. This paper focuses on a specific definition of companies re-domiciling their headquarters overseas without relocating their productive capacity. Recent studies have shown that such practices can have an effect on countries’ foreign direct investment (FDI) statistics; in particular, a fall in net FDI earnings and investment position.
Data presented in this paper found little evidence to suggest that companies re-domiciling their headquarters overseas have been having an adverse effect on UK FDI statistics in recent years.
While UK FDI liabilities have risen over recent years, data presented in this paper highlighted that 72.1% of the increase between 2007 and 2014 is attributable to traditional transaction flows such as mergers and acquisitions.
The remainder of the increase is attributable to non-transactional effects such as revaluations and exchange rate effects. If financial engineering was inflating FDI liability values, it would be reflected within this component. Analysis of these non-transactional effects at a company level allowed for the largest 25 multinationals, which have not re-domiciled or had a cross-border change in ownership, to be excluded. Doing so indicates that 92.0% of the rise in FDI liabilities between 2007 and 2014 is attributable to non-financial engineering activities, with the remainder accounted for by unclassified non-transactional effects.
Further analysis into the distribution of rates of return also found no evidence that the rate of return of the most profitable FDI liabilities is rising – an expected outcome if the most profitable multinationals had re-domiciled overseas; instead, the most profitable 20% of FDI liabilities were lower in the periods between 2013 and 2014 compared to any other period since 2007.
Back to table of contents3. Introduction
UK FDI assets and liabilities have both experienced upward trends during the past decades; however, the increase in FDI liabilities since 2008 has been notably larger. A range of factors could be responsible, such as the performance of the UK economy, an open business approach to foreign investors, and a more resilient rate of return compared with other economies. That said, financial engineering has also recently been cited as a potential factor, and this paper analyses the impact of this on UK FDI statistics.
The term financial engineering can be used to describe a large variety of different corporate activities. This paper uses the term to describe companies that have re-domiciled their headquarters overseas for financial gain. Although the authors appreciate that there are a variety of other definitions of financial engineering – such as corporate inversions – this paper aims specifically to measure the effects companies that have re-domiciled their headquarters overseas are having on UK FDI statistics. It is also worth noting that the paper is only focused on re-domiciled companies that maintain existing operational structures in the UK, rather than the effects of multinationals relocating their productive capacity.
Back to table of contents4. Foreign direct investment
Foreign direct investment (FDI) refers to cross-border investments made by residents and businesses from one country into another, with the aim of establishing a lasting interest in the company receiving the investment. Ownership of at least 10% of voting power is the basic criterion used.
FDI statistics produced by the Office for National Statistics (ONS) report on three main headline statistics: positions, which refer to the stock of investment that has been accumulated over time; earnings, which refer to the net profits generated by the underlying positions over time; and flows, which refer to changes in the stock of investment due to investment transactions.
The importance of FDI has grown rapidly in recent decades because of ever-increasing globalisation: establishing lasting links between economies, promoting technological transfers & innovation, and providing investors with access to previously inaccessible markets. The stock of FDI into the UK from overseas (FDI liabilities) increased from 16.6% of gross domestic product (GDP) to 74.1% between 1987 and 2014, while the stock of investment undertaken by the UK overseas (FDI assets) has grown from 22.7% to 75.9% over the same period, as shown in Figure 1.
Figure 1: UK FDI Positions as a Percentage of GDP, 1987 to 2014
Source: Office for National Statistics
Download this chart Figure 1: UK FDI Positions as a Percentage of GDP, 1987 to 2014
Image .csv .xlsWhile both FDI assets and liabilities increased, the rate of increase in FDI liabilities has broadly outpaced that of assets since 2008. Coupled with a relatively larger decline in the rate of return UK investors generated from their overseas FDI, this has had negative consequences on the direct investment earnings balance since 2011. The drivers behind the decline in net FDI earnings and their impact on the current account have been presented in a number of recent ONS analysis publications (ONS 2015, 2016a, 2016b). While changes in FDI stocks and earnings are related, this paper focuses on the changes in FDI stocks and the impact of financial engineering.
Back to table of contents5. Literature
While the complex nature of FDI makes it difficult to untangle the drivers behind changes in the stocks over time, recent ONS papers suggest that one potential driver behind the increased appetite for UK FDI has been a more resilient rate of return generated by UK-based investments compared to returns UK investors generate overseas (ONS 2015, 2016a, 2016b).
Other factors supporting the appetite for UK-based investments include investors wishing to gain access to a large market (the UK is the fifth largest economy in the world in nominal GDP terms); a stable economic, regulatory and political environment; low and stable inflation; a liberal approach to foreign ownership with few restrictions; and relatively low taxes.
Other analysts have recently suggested that financial engineering may have also contributed to the increase in UK FDI liabilities – a term used in this paper to describe firms that have re-domiciled their headquarters overseas for reasons such as lower taxes.
The suggestion that financial engineering is impacting on UK FDI statistics follows the re-domicile of a number of large multinational companies to the Republic of Ireland. These have had a substantial impact on the Republic of Ireland’s balance of payments statistics (Duffy et al, 2012), as these companies’ overseas operations are now recorded as Irish FDI assets in the international investment position, and the profits from these operations are recorded as FDI credits in the primary income account (Everett, 2014). These changes have also inflated some aggregate economic indicators in the Republic of Ireland’s national accounts figures – such as gross national income – despite little of the productive activities of these firms being relocated to the Republic of Ireland.
While it is true that the UK and Republic of Ireland have both experienced increases in direct investment activity, the increases in FDI liabilities experienced in the UK have been smaller relative to the increases in FDI assets in the Republic of Ireland. UK FDI liabilities rose from 51.5% to 74.1% as a percentage of nominal GDP between 2007 and 2014 according to ONS statistics, while the Republic of Ireland’s FDI assets rose from 55.7% to 255.3% over the same period (UNCTAD, 2016). The sharp increase in the Republic of Ireland’s FDI assets can mainly be attributed to a small number of multinational companies from a number of countries re-domiciling to a territory where the economy is relatively small. The value of FDI assets in the Republic of Ireland stood at $150.1 billion (current prices) in 2007, before rising to $628.0 billion in 2014 (UNCTAD, 2016).
The impact of financial engineering on the Republic of Ireland’s national accounts have led to other analysts suggesting that similar effects may be also affecting UK FDI statistics, albeit in reverse. Lane (2015) attributes some of the recent increase in UK FDI liabilities and falls in net earnings to financial engineering, citing the difference between changes in FDI liabilities and their corresponding flows as an indication of re-domiciling activities. The assumption that FDI liabilities would increase as a result of UK-based firms with large domestic operations re-domiciling their headquarters overseas is valid, since any assets that remain in the UK would be recorded as an FDI liability. Furthermore, the increase in liabilities is unlikely to have any corresponding flows, since flows only capture investment transactions. This paper attempts to answer whether this type of activity is affecting UK FDI liabilities.
Back to table of contents6. Illustrative examples
Before presenting evidence on whether financial engineering is affecting balance of payments statistics, it is useful to consider illustrative examples of financial engineering to assess the likely outcomes of such activities.
Note that the following examples are purely hypothetical and are only used to illustrate the impact of financial engineering on balance of payments using national accounting principles.
Consider a company that is headquartered in the UK and has domestic operations. In addition, the company has operations in overseas territories. Both the domestic and overseas operations generate profits. A further assumption is that the company is fully owned by UK-based shareholders, none of whom owns more than 10% of the voting power.
Should the company decide to re-domicile its headquarters overseas, this would impact on UK balance of payments statistics in a number of ways. First, the UK may lose its FDI assets and credits, since these would no longer be a UK FDI relationship, but rather become an FDI relationship between the territory of the new company headquarters and the investment destinations1. Second, UK balance of payments would now record the UK operations that previously did not feature in the balance of payments as UK FDI liabilities to territory of the new headquarters. Third, since the company would still be owned by UK-based shareholders, none of whom own more than 10% voting power, the company’s overall value would be recorded as portfolio investment assets.
The re-domicile would impact on both the UK’s international investment position and primary income account – a major component of the current account. In terms of the international investment position, the UK’s net FDI position would fall, reflecting a fall in assets and rise in liabilities. While net FDI positions decrease, the increase in the value of portfolio investment assets would likely offset the overall decline in the UK’s net international investment position, assuming all shareholders are UK-based.
The impact of financial engineering on the country’s primary income balance is less clear. Similarly to the investment position, UK net FDI earnings would decline, reflecting a decrease in credits and an increase in debits. The decrease in the primary income balance due to falling net FDI earnings would likely be partly offset by an increase in portfolio investment income – through dividend payments; however, the extent of this would depend on company payout structures. Since it is unusual for companies to distribute all their profits as dividends payments to shareholders, it is expected that the rise in portfolio investment credits would only partly offset the fall in primary income.
Therefore the effects of financial engineering in this illustrative example are:
A decrease in FDI assets and an increase in FDI liabilities, resulting in declines in the net FDI position and the overall international investment position.
A decrease in FDI credits and increase in FDI debits, resulting in declines in net FDI income and the overall primary income balance.
A rise in portfolio investment assets, offsetting the fall in the overall international investment position balance.
An increase in portfolio investment income from abroad, offsetting some of the decline in the overall primary income balance.
This illustrative example presented is a simplistic approach to the effects of a UK company with domestic operations re-domiciling to an overseas territory. The effects these activities can have on official statistics are also influenced by a variety of other factors, including share ownership, company structures, and financing. A more detailed description of the above example and a further two examples can be found in Annex I.
For an outline of the reverse of these effects on the Republic of Ireland, see “Redomiciled PLCs in the Irish Balance of Payments” by the Central Statistics Office (2015). For an insight into the effects of corporate inversions to national accounts in the US, which is distinct from the financial engineering activities described in this paper, see “The Effects of Corporate Inversions on the International and National Economic Accounts” by the Bureau of Economic Analysis (2015).
Notes:
- Note that it is possible for the UK to still record the overseas affiliates as FDI assets if it remains in control of them. In such cases, however, the value of these assets would also be recorded as liabilities to the territory of the new headquarters; therefore, the UK’s net FDI position would fall in either case.
7. FDI accounting
It is useful to understand how FDI statistics are derived in order to identify where financial engineering activities are likely to be recorded within the components of headline statistics.
FDI stocks comprise two components: share capital & reserves, which include quoted and unquoted equity; and intercompany loans and other capital, which include loans to and from the parent company to its subsidiaries, preference shares, and other branch capital.

FDI flows refer to changes in the stock of assets or liabilities that are due to investment transactions by the parent company or its subsidiaries, and comprise three components: reinvested earnings, which refer to earnings that are not distributed to shareholders; equity capital flows, which refer to acquisitions and disposals of quoted & unquoted equity and preference shares; and net changes in intercompany loans and other branch capital, which refer to loans and other capital transactions between the parent companies and subsidiaries.

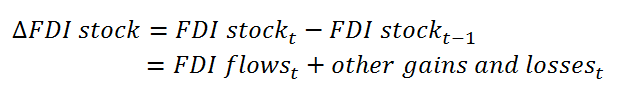
A common query, often raised by users of FDI statistics, relates to the perceived discrepancy between changes in FDI stocks and the associated flows between periods. The reason for these differences is the inclusion of a further component in positions that is not included in flows. This component, referred to as other gains and losses, captures the value of changes in FDI stock values that is due to non-transactional effects.
Examples of the effects included in the other gains & losses component include, but are not limited to:
- company restructures;
- large one-off redundancy payouts and fines;
- profits and losses made during acquisitions & disposals of companies (such as goodwill);
- exchange rate fluctuations;
- revaluation effects.
Therefore changes in the FDI stock values between periods can be expressed as the value of flows in that period plus non-transaction related gains and losses.
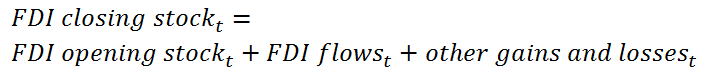
Or, the value of the stock of FDI in any period is equal to the value of the opening stock of FDI in that period, plus flows, plus other gains & losses.
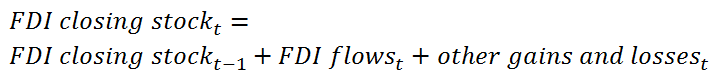
Therefore, in theory, the stock of FDI in any period is equal to the stock of FDI in the previous period, plus flows, plus non-transaction related gains & losses.
In line with international standards, FDI accounting methods result in changes in FDI positions between periods not reconciling with flows. This is because reported FDI stock values reflect the cumulative value of all investment changes due to both investment transactions and non-transactional effects, while flows reflect only changes related to investment transactions. Financial engineering activities would likely be reflected in other gains & losses, since the changes in position values are due to company restructures.
A further reason is that FDI flows relating to other capital transactions are calculated by taking the difference between closing and opening values in any one period. To study the changes in the stock of FDI over time, some assumptions outlined in Annex II must be made to reconcile flows and positions1.
Notes:
- Note that these assumptions result in the intercompany loans & other capital flows presented in this paper differing from official estimates published within Balance of Payments. However, it is important to note that this is done solely to reconcile flows and positions by activity, and should not be treated as an alternative measure of flows.
8. Expected impacts of financial engineering
FDI statistics
It is useful to consider what the potential impacts on FDI statistics may be should financial engineering truly be occurring to an extent that would distort balance of payments statistics. Based on hypotheses raised in literature, FDI accounting principles, and illustrative examples of financial engineering presented earlier in this paper, the areas listed below are believed to be the expected effects financial engineering may have on FDI statistics:
- increases in FDI liabilities occurring alongside increases in portfolio investment assets;
- increases in FDI debits occurring alongside increases in portfolio credits;
- increases in FDI liabilities from specific regions, most notably financial centres;
- increases in FDI liabilities due mainly to changes in other gains & losses, rather than traditional financial flows;
- rates of return of the most profitable UK FDI assets would decline, while the rate of return of the most profitable FDI liabilities would increase.
These effects are studied in later sections to determine the extent to which financial engineering may be affecting FDI liabilities.
None of the expected outcomes listed should be considered in isolation due to the complex and sometimes volatile nature of FDI flows and mergers & acquisitions. Instead, this paper considers all of the listed expected outcomes before determining whether the trends observed in FDI statistics exhibit trends that suggest financial engineering is occurring to an extent that affects Balance of Payments statistics.
National accounts
The effects financial engineering has on FDI statistics would also impact wider national accounts aggregates – particularly those that have primary income receipts as a major component.
Two headline economic indicators that are often of interest are gross domestic product (GDP) and gross national income (GNI). In terms of GDP, the definition of financial engineering used in this paper would have little to no effect, since these statistics only measure output of the domestic economy. The only instance in which financial engineering would directly affect GDP is if the productive capacity of the re-domiciling firm was also relocated.
While having little impact on GDP, financial engineering would generally reduce a country’s GNI. Since GNI measures the income from the production of goods and services of UK-owned labour and capital, financial engineering would reduce GNI by increasing direct investment payments from the UK to the new territory of the re-domiciled headquarters, while also reducing direct investment payments to the UK if any of the re-domiciling companies held overseas subsidiaries before relocating.
While ONS is unable to provide estimates of the effects of financial engineering on GDP and GNI at this time, evidence presented in this paper suggests that financial engineering is not having a major impact on FDI; therefore, one can infer that the impact on aggregate statistics would be very small.
Back to table of contents9. Evidence
The following sections present analysis of FDI statistics to establish whether there is evidence of financial engineering in FDI company survey response data collected by ONS.
The majority of the analysis is conducted using company level microdata. All figures are consistent with those presented in Pink Book 2016 – with the exception of flows due to assumptions used in this paper discussed in earlier sections. Microdata for periods between 2007 and 2011 were from legacy systems that followed older international standards; however, these have had adjustments applied at a company survey response level to ensure consistency with the latest international standards.
Microdata analysed in this paper focuses on periods between 2007 and 2014. This is because data from 2007 is the earliest company level response data available to ONS, while data from 2014 is the most recent data available from the annual FDI survey. Due to the sometimes volatile nature of FDI statistics, the analysis focused on developments over this period, rather than any period in isolation.
Developments in FDI and portfolio investment stocks
A recent development in UK FDI has been the continued growth in FDI liabilities, which have risen every year excluding 2009 for over a decade, and stood at £1,350 billion in 2014, £823 billion higher than in 2004.
While rapid increases in direct investment into the UK reflect increased appetite for UK-based assets, some have suggested that part of the increase may also be attributable to companies choosing to re-domicile their headquarters overseas.
As discussed in previous sections, one would expect an increase in both the stock of FDI liabilities and portfolio assets if financial engineering was occurring to a notable extent, which has been the case for a number of years, as illustrated in Figure 2.
Figure 2: UK FDI liabilities and portfolio investment assets, 2007 to 2014
Source: Office for National Statistics
Download this chart Figure 2: UK FDI liabilities and portfolio investment assets, 2007 to 2014
Image .csv .xlsA further expected outcome of financial engineering would be an increase in FDI debits, as earnings from UK operations are paid to the newly re-domiciled headquarters, and a rise in portfolio investment credits, if any dividend payments are made to UK-based shareholders. Figure 3 presents these two statistics, and indicates that the expected trends do not necessarily hold in terms of primary income. FDI debits have indeed risen from £45.1 billion to £57.9 billion between 2010 and 2014; however, portfolio investment credits have not offset any of this increase, instead following a downward trend since 2011 from £53.9 billion to £44.3 billion in 2014.
Figure 3: UK FDI debits and portfolio investment credits, 2007 to 2014
Source: Office for National Statistic
Download this chart Figure 3: UK FDI debits and portfolio investment credits, 2007 to 2014
Image .csv .xlsWhile aggregate statistics are useful for reporting the overall picture of an economy’s international transactions, they do not offer sufficient information to make judgements regarding whether financial engineering is truly having an impact. Instead, detailed analysis is required, which the following sections aim to provide.
Changes in FDI stocks by geographical region
If financial engineering explained a notable proportion of the increase in FDI liabilities, one would expect the increases to be from specific regions – namely, financial centres. However, data presented in Figure 4 shows that increases in FDI liabilities since 2007 appear to have been broad-based; suggesting a widespread increase in appetite for UK-based investment. The four largest increases in UK FDI liabilities between 2007 and 2014 were from the EU (£197.6 billion), North America (£135.6 billion), non-EU Europe (£104.5 billion), and South & Central America (£99.8 billion)1 .
The broad-based increase suggests that even if financial engineering was occurring, it is coinciding with a real increase in appetite for UK investment from across the world.
Figure 4: UK FDI liabilities by geographical region, 2007 to 2014
Source: Office for National Statistics
Download this chart Figure 4: UK FDI liabilities by geographical region, 2007 to 2014
Image .csv .xlsWhile analysing increases in FDI liabilities is useful for showing that increases in FDI into the UK have been from a broad range of regions and not focussed on specific regions that companies would re-domicile to, the breakdowns may disguise increases in FDI liabilities from areas considered financial centres.
Figure 5 splits UK FDI liabilities between those from financial centres and non-financial centres2. In 2007, the values of FDI liabilities from financial centres and non-financial centres were £312.8 billion and £475.3 billion respectively. FDI liabilities from both these regions have risen by £302.3 billion and £259.3 billion respectively between 2011 and 2014, highlighting that increases in FDI liabilities are not only concentrated to financial centres, but are an international phenomenon.
Figure 5: UK FDI liabilities from financial centres and non-financial centres, 2007 to 2014
Source: Office for National Statistics
Download this chart Figure 5: UK FDI liabilities from financial centres and non-financial centres, 2007 to 2014
Image .csv .xlsIt is also worth noting that large increases from financial centres are not necessarily an indication of the effects of companies re-domiciling, but also the fact that a large amount of multinationals’ investments transit through these centres.
Changes in FDI by activity
As highlighted in the FDI accounting section, changes in FDI stocks reflect changes in flows and other gains & losses. Flows reflect investment transactions such as reinvested earnings, net equity acquisitions and changes in loans & other capital, while other gains & losses reflect changes in stocks due to non-transactional effects, such as revaluations, exchange rate effects and company restructures. Should financial engineering be occurring in the UK, the impact on FDI positions would likely be captured in other gains & losses, since they record changes in stocks due to restructures.
Figure 6 presents a detailed breakdown into how stocks of UK FDI liabilities have evolved over time.
Figure 6: Opening & closing UK FDI Liabilities and changes, 2007 to 2014
Source: Office for National Statistics
Download this chart Figure 6: Opening & closing UK FDI Liabilities and changes, 2007 to 2014
Image .csv .xlsFigure 7 presents the changes in FDI liability stocks over time, and highlights two observations. First, flows appear to be the predominant force in changes in FDI liability stocks over this period, outweighing the effects of financial engineering during five of the seven periods presented. Second, other gains & losses do not appear to show any clear trend, which suggests that re-domiciling is not a phenomenon that is affecting many large multinationals.
Figure 7: Changes in UK FDI liability stocks by flows and other gains & losses, 2007 to 2014
Source: Office for National Statistics
Download this chart Figure 7: Changes in UK FDI liability stocks by flows and other gains & losses, 2007 to 2014
Image .csv .xlsFigure 8 presents the cumulative change in FDI stocks between 2007 and 2014, and suggests that 72.1% of the £561.6 billion increase in FDI liabilities between 2007 and 2014 is explained by flows. The remaining 27.9% increase in FDI liabilities explained by other gains & losses should not be interpreted as the value of FDI liabilities attributable to financial engineering, but rather that, if financial engineering were truly having an impact on FDI statistics, it would be found here.
Figure 8: Cumulative change in UK FDI liability stocks by flows and other gains & losses, 2007 to 2014
Source: Office for National Statistics
Download this chart Figure 8: Cumulative change in UK FDI liability stocks by flows and other gains & losses, 2007 to 2014
Image .csv .xlsExcluding non-financial engineering related other gains and losses
Since the underlying components of other gains & losses – such as revaluation and exchange rate effects – are grouped together into one survey question, it is difficult to accurately classify the changes to certain effects.
This section attempts to classify as much of other gains & losses into other activities unrelated to companies re-domiciling their headquarters overseas. Since a small number of the largest multinational companies account for a large proportion of headline FDI statistics, the largest companies in the FDI survey were manually investigated to determine whether they have re-domiciled their headquarters overseas from the UK during the period in question.
A total of 25 of the largest FDI liability companies3 were investigated. Those that had not re-domiciled their headquarters overseas, and did not experience any cross-border changes in ownership, had the value of their other gains & losses classified as relating to non-financial engineering activities – such as revaluations or exchange rate effects. Those that did were grouped with the remainder of the FDI population’s other gains & losses values and treated as unclassified.
The results of this approach are presented in Figure 9, which shows the cumulative change in FDI liabilities due to flows, other gains & losses from the largest 25 multinationals (excluding those that had re-domiciling activities), and the remainder of unclassified other gains & losses. The results suggest that, of the £561.6 billion increase in FDI liability stocks, £404.7 billion is attributable to investment transactions (flows), £111.7 billion to other gains & losses associated with the largest multinationals that had not re-domiciled, and £45.2 billion to other gains & losses that are unclassified.
Figure 9: Cumulative change in UK FDI stocks by flows, and other gains & losses split into the largest 25 multinationals (excluding banks, bank holding companies, property data and re-domiciled companies) and the remainder, 2007 to 2014
Source: Office for National Statistics
Download this chart Figure 9: Cumulative change in UK FDI stocks by flows, and other gains & losses split into the largest 25 multinationals (excluding banks, bank holding companies, property data and re-domiciled companies) and the remainder, 2007 to 2014
Image .csv .xlsThis method suggests that at least 92.0% of changes in FDI stocks between 2007 and 2014 are related to flows and non-financial engineering related non-transactional effects. These results do not suggest that the remaining 8.0% of the change in FDI liability stocks relates to financial engineering related activities, but rather that this proportion of the change in FDI liabilities relates to other gains & losses that have not yet been classified.
Figure 10: Proportion of change in UK FDI stocks between 2007 and 2014 attributable to flows, other gains & losses of the largest 25 multinationals (excluding banks, bank holding companies, property data and re-domiciled companies) and unclassified other gains & losses
Source: Office for National Statistics
Notes:
- Values shown reflect the percentage of the change in FDI liabilities between 2007 and 2014 that is attributable to flows, other gains & losses of the largest 25 multinationals (excluding banks, bank holding companies, property data and re-domiciled companies) and unclassified other gains & losses.
Download this chart Figure 10: Proportion of change in UK FDI stocks between 2007 and 2014 attributable to flows, other gains & losses of the largest 25 multinationals (excluding banks, bank holding companies, property data and re-domiciled companies) and unclassified other gains & losses
Image .csv .xlsIt is worth noting that, while this analysis is useful in indicating the amount of change in the stock of FDI liabilities by type of activity, the changes are over time and are therefore sensitive to the periods selected. For instance, comparing the results between 2006 and 2014 indicates that 100% of the increase in FDI stocks was due to flows and non-financial engineering related other gains & losses, with the unclassified other gains & losses being negative. Conversely, using the periods between 2009 and 2014 or 2010 and 2014 raises the proportion of the increase in the stock of FDI liabilities over those periods due to the unclassified other gains & losses component to 9% or 25% respectively. This is because period variations become more volatile as the period in question is made smaller. As such, considering cumulative changes over a longer period is believed to be more effective in this exercise.
Rates of return distribution
As suggested in recent studies, financial engineering can result in a fall in FDI credits, and rise in debits, should highly-profitable companies re-domicile overseas (Lane, 2015). Such activity would increase in the rate of return of UK FDI liabilities. Coupled with a rise in the stock of FDI liabilities, this would explain a fall in net FDI earnings.
Should highly-profitable firms be re-domiciling from the UK, one would expect the profitability of UK FDI assets to fall and that of UK liabilities to increase. To investigate this, Figure 11 presents the distribution of rates of return of UK FDI assets by quintile between 2007 and 2014. The figure illustrates the rates of return of UK FDI assets broken down in fifths, where, if the value of total FDI assets was £1,000 billion, the lowest quintile would represent the rate of return of the least profitable £200 billion of FDI assets, whereas the highest quintile would represent the rate of return of the most profitable £200 billion of FDI assets.
If financial engineering were affecting UK FDI assets, one would expect that the rate of return of the most profitable investments would have declined over time. Figure 11 shows that the rate of return of all FDI asset quintiles experienced a fall since 2007, largely reflecting the impact the 2008 economic downturn had on UK overseas assets. Since the 2008 downturn, the rate of return of the most profitable two quintiles recovered; rising from 7.1% and 19.3% in 2008 to 7.6% and 23.1% between 2011 and 2012. In contrast, the rate of return of the bottom three quintiles continued to deteriorate, falling from -5.3%, 1.0% and 3.8% in 2008 to -5.7%, 0.7% and 2.6% between 2011 and 2012. These figures suggest that much of the strength in UK FDI credits up to their peak in 2011 was supported by the most lucrative FDI assets, rather than a broad-based increase.
During the most recent period in Figure 11, the most profitable assets appeared to have declined to levels seen between 2009 and 2010, with the rate of return of the highest two quintiles falling to 7.2% and 20.2%. Furthermore, all other quintiles (excluding the lowest) showed further declines in this period, reaching returns lower than those reported in 2008.
While rates of return of the most profitable assets had indeed fallen since 2007, this appears largely related to the 2008 economic downturn rather than the effects of financial engineering. Returns showed a recovery following 2008, although these appear to have been short lived, with further weakness in recent years. Recent weaknesses are also unlikely to be related to financial engineering, rather reflecting slowdowns in regions and industries that the UK invests in – most notably the slowdown in Europe, falling commodity prices, and, since the second half of 2014, falling oil prices.
Figure 11: Rate of return distribution of UK FDI assets, 2007 to 2014
Source: Office for National Statistics
Notes:
- Excludes FDI assets with negative values.
Download this chart Figure 11: Rate of return distribution of UK FDI assets, 2007 to 2014
Image .csv .xlsIn terms of FDI liabilities, the expected effects of financial engineering would be an increase in the rate of return of the most profitable FDI liabilities.
Figure 12 presents the distribution of rates of return for FDI liabilities. Similarly to FDI assets, rates of return in most quintiles appear to have fallen following the 2008 economic downturn, although the most profitable and least profitable quintiles show extreme behaviour in 2008. In periods following 2008, the most profitable quintile appeared to return to levels experienced prior to the 2008 economic downturn, reaching 24.0% between 2009 and 2010, compared to 24.7% in 2007. However, the rate of return of the most profitable quintile of investments appears to have fallen in periods since then, declining to 17.5% between 2011 and 2012, and further to 16.4% between 2013 and 2014.
In terms of the lower quintiles, while rates of return fell after the 2008 economic downturn, their performance since 2009 and 2010 has been relatively flat, in contrast to the same quintiles for FDI assets which have reported declines. This suggests that much of the resilience seen in the rate of returns of FDI liabilities relative to FDI assets has been due to the performance of less profitable liabilities, while the most profitable have applied downward pressure on the overall rate of return.
Trends shown in Figure 12 contradict what one would expect if financial engineering was occurring, as the rates of return of the most profitable FDI liabilities have fallen.
Figure 12: Rate of return distribution of UK FDI liabilities, 2007 to 2014
Source: Office for National Statistics
Notes:
- Excludes FDI liabilities with negative values.
Download this chart Figure 12: Rate of return distribution of UK FDI liabilities, 2007 to 2014
Image .csv .xlsNotes:
Note that these figures are based on the immediate controlling parent rather than ultimate, therefore financial flows may be affected by investments transiting through other countries before reaching the UK. Nonetheless, the data highlight that increases in FDI liabilities have been broad-based.
Financial centres are defined in this paper as countries that have outward FDI stocks of more than 100% of GDP in 2014, and countries defined as offshore financial centres according to Eurostat’s Balance of Payments Vademecum. A full list of these countries is presented in Annex III.
10. Conclusions
Companies’ FDI decisions have traditionally been based on a number of factors, including tax regime. In recent years, however, the question has been raised as to whether financial engineering – defined here as the practice of multinational companies re-domiciling their headquarters overseas for reasons such as lower taxes – has materially affected FDI statistics. Examining the data that ONS collects suggests little evidence that financial engineering has been having an effect of FDI statistics in recent years. Such activities have, nevertheless, affected the national accounts of countries such as the Republic of Ireland.
While FDI liabilities have risen in the UK over recent years, data presented in this paper highlighted that 72.1% of the increase between 2007 and 2014 is attributable to traditional transaction flows such as mergers & acquisitions. We view this as quite distinct from financial engineering, which is a change in corporate structure from re-domiciling their headquarters.
The remainder of the increase in FDI is attributable to non-transactional effects, such as revaluations and exchange rate effects. If financial engineering was inflating FDI liability values, it would be reflected within this component. Analysis of these non-transactional effects at a company level allowed for the largest multinationals, excluding those that have re-domiciled or had a cross-border change in ownership, to be excluded. Doing so indicates that 92.0% of the rise in FDI liabilities between 2007 and 2008 is attributable to activities unrelated to financial engineering as defined in this paper, with the remainder accounted for by unclassified non-transactional effects.
Further analysis into the distribution of rates of return also found no evidence that the rate of return of the most profitable FDI liabilities is rising – an expected outcome if the most profitable multinationals had re-domiciled overseas; instead, the most profitable 20% of FDI liabilities were lower in the periods between 2013 and 2014 compared to any other period since 2007.
Back to table of contents11. References
Bureau of Economic Analysis (2015), “The Effects of Corporate Inversions on the International and National Economic Accounts”, February.
Central Statistics Office (2015), “Redomiciled PLCs in the Irish Balance of Payments”, Central Statistics Office, July.
Duffy, David; Durkan, Joseph; Timoney Kevin; and Casey, Eddie (2012), “Quarterly Economic Commentary – Winter 2012”, The Economic and Social Research Institute, Winter.
Everett, Mary (2014), “Financial Constraints and the Internationalisation of Irish Firms”, Journal of the Statistical and Social Inquiry Society of Ireland, XLIV, October.
FitzGerald, John (2013), “The Effects of Redomiciling Plcs on GNP and the Irish Balance of Payments”, The Economic and Social Research Institute, Spring.
Hamroush, Sami; Luff, Matthew; Banks, Andrew; and Hardie, Michael (2016b), “An analysis of the drivers behind the fall in direct investment earnings and their impact on the UK's current account deficit”, Office for National Statistics, March 31.
Hamroush, Sami; Rebecca Hendry; and Michael Hardie (2016a), “An Analysis of Foreign Direct Investment, the main driver of the recent deterioration in the UK’s Current Account”, Office of National Statistics, January 19.
Hamroush, Sami; Taylor, Ciaren; Luff, Matthew; Wales, Philip; and Hardie, Michael (2015), “An Analysis of Foreign Direct Investment, the Key Driver of the Recent Deterioration in the UK’s Current Account”, Office of National Statistics, October 30.
Lane, Philip (2015), “A Financial Perspective on the UK Current Account Deficit”, National Institute Economic Review 234, November, F67–F72.
Back to table of contents12. Annex I: Illustrative examples
Example 1: A UK-based company that is fully owned by UK-based shareholders re-domiciles its headquarters overseas
Consider a company that is headquartered in the UK and has domestic operations of £100 billion. In addition to these operations, the company has operations in an overseas country worth £100 billion. Both the domestic and overseas operations each generate profits of £10 billion per annum, or £20 billion in total. A further assumption is that the company is fully owned by UK-based shareholders, none of whom owns more than 10% of the voting power.
From a balance of payments perspective, the company has FDI assets worth £100 billion, and FDI credits worth £10 billion. As the company’s shareholders are based in the UK and are therefore not engaged in cross-border transactions, the company does not feature in the portfolio investment account.
From the company’s own balance sheet perspective, the company has UK-based assets of £100 billion, with profits of £10 billion, and overseas assets of £100 billion, with profits of £10 billion. This example is illustrated in Table 1.0.
Table 1.0: Illustrative example of financial engineering, phase 1
| Balance of Payments | Company's balance sheet | ||||
| FDI | UK | ||||
| Assets | £100 | Assets | £100 | ||
| Credits | £10 | Profits | £10 | ||
| Liabilities | |||||
| Debits | |||||
| Portfolio | Overseas | ||||
| Assets | No data | Assets | £100 | ||
| Credits | No data | Profits | £10 | ||
| Liabilities | No data | ||||
| Debits | No data | ||||
| Source: Office for National Statistics | |||||
Download this table Table 1.0: Illustrative example of financial engineering, phase 1
.xls (27.1 kB)Should the company decide to re-domicile its headquarters from the UK overseas, this would impact on UK Balance of Payments statistics in a number of ways. First, the UK would lose its FDI assets and credits, since these would no longer transit through the UK, but instead between the territory of the new company headquarters and the investment destination. Second, UK Balance of Payments would now record the UK operations that previously did not feature in the Balance of Payments as UK FDI liabilities to territory of the new headquarters. Third, since the company is still owned by UK-based shareholders, none of whom own more than 10% voting power, the company’s value would be recorded as a portfolio investment asset, as shown in Figure 1.1.
Table 1.1: Illustrative example of financial engineering, phase 2
| Table 1.1: Illustrative example of financial engineering, phase 2 | ||||
| Balance of Payments | Company's balance sheet | |||
| FDI | UK | |||
| Assets | £0 | Assets | £100 | |
| Credits | £0 | Profits | £10 | |
| Liabilities | £100 | |||
| Debits | £10 | |||
| Portfolio | Overseas | |||
| Assets | £200 | Assets | £100 | |
| Credits | ≥0 | Profits | £10 | |
| Liabilities | No data | |||
| Debits | No data | |||
| Source: Office for National Statistics | ||||
Download this table Table 1.1: Illustrative example of financial engineering, phase 2
.xls (27.6 kB)The re-domicile would impact on both the UK’s international investment position and primary income account – a major component of the country’s overall current account balance. In terms of the international investment position, the UK’s net FDI position would fall by £200 billion, reflecting a fall of £100 billion in assets and a £100 increase in liabilities. While net FDI positions decrease, the increase in the value of portfolio investment assets would rise by £200 billion, offsetting the overall decline in the UK’s net international investment position. Note that this assumes shareholders are all UK-based.
While this illustrative example only affects components of the UK’s international investment position and not the overall position balance, the impact on the country’s primary income balance is less clear. Similarly to the investment position, UK net FDI earnings would decline by £20 billion – reflecting a £10 billion decrease in credits and £10 billion increase in debits. The decrease in the primary income balance due to falling net FDI earnings would likely be partly offset by an increase in portfolio investment income; however, the extent of this would depend on company payout structures. Since it is unusual for companies to distribute all their profits as dividend payments to shareholders, it would be expected that the rise in portfolio investment credits will not fully offset the fall in primary income due to FDI earnings.
The effects of financial engineering in this illustrative example are:
A decrease in FDI assets and an increase in FDI liabilities, resulting in declines in the net FDI position decline and the overall international investment position.
A decrease in FDI credits and increase in FDI debits, resulting in declines in net FDI income and the overall primary income balance.
A rise in portfolio investment assets, offsetting the fall in the overall international investment position balance.
An increase in portfolio investment, offsetting some of the decline in the overall primary income balance.
The illustrative example is a simplistic approach to the effects of a UK company with UK-based operations re-domiciling to an overseas territory. The effects these activities can have on official statistics are also influenced by a variety of other factors, including share ownership, company structures, and financing. The following two examples are included to highlight the effects such factors can have.
Example 2: A UK-based company that is fully owned by UK-based shareholders is partly acquired by an overseas firm
Consider a company that initially is identical to the company described in example 1: a UK-based company with UK operations of £100 billion and overseas operations of a further £100 billion. Both the domestic and overseas operations each generate profits of £10 billion per annum. Furthermore the company is fully owned by UK-based shareholders; none of whom owns more than 10% of total shares.
The balance of payments and company balance sheets are both shown in Figure 2.0.
Table 2.0: Illustrative example of financial engineering, phase 1
| Table 2.0: Illustrative example of financial engineering, phase 1 | ||||
| Balance of Payments | Company's balance sheet | |||
| FDI | UK | |||
| Assets | £100 | Assets | £100 | |
| Credits | £10 | Profits | £10 | |
| Liabilities | ||||
| Debits | ||||
| Portfolio | Overseas | |||
| Assets | No data | Assets | £100 | |
| Credits | No data | Profits | £10 | |
| Liabilities | No data | |||
| Debits | No data | |||
| Source: Office for National Statistics | ||||
Download this table Table 2.0: Illustrative example of financial engineering, phase 1
.xls (27.1 kB)Assume that 60% of the shares of the company are acquired by an overseas company, who immediately decides to relocate the headquarters overseas. The move would result in similar, but not identical, changes to those described in the first example. First, the UK would lose its FDI assets and credits, since these no longer transit through the UK. Second, UK Balance of Payments would now record the UK operations that previously did not feature in the Balance of Payments as UK FDI liabilities to territory of the new headquarters. These first two changes are identical to first example; however, the third change is quite different. Since 40% of the company is still owned by UK-based shareholders, none of whom own more than 10% voting power, 40% of the company’s overall value (UK and overseas assets) would be recorded as a portfolio investment assets, as shown in Figure 2.1.
Table 2.1: Illustrative example of financial engineering, phase 2
| Balance of Payments | Company's balance sheet | |||
| FDI | UK | |||
| Assets | £0 | Assets | £100 | |
| Credits | £0 | Profits | £10 | |
| Liabilities | £100 | |||
| Debits | £10 | |||
| Portfolio | Overseas | |||
| Assets | £80 | Assets | £100 | |
| Credits | ? | Profits | £10 | |
| Liabilities | No data | |||
| Debits | No data | |||
| Source: Office for National Statisitcs | ||||
Download this table Table 2.1: Illustrative example of financial engineering, phase 2
.xls (27.1 kB)The impact of re-domiciling the company’s headquarters overseas would, similarly to the first example, result in the UK’s net FDI position falling by £200 billion, reflecting a fall of £100 billion in assets and a £100 billion increase in liabilities. This is because although the acquiring firm only owns 60% of the company’s shares, the company’s assets are fully owned by the company; therefore, they are recorded as liabilities against the firm’s headquarters.
Where this example differs from the previous example is that, since only 40% of the company is now owned by UK-based shareholders (with less than 10% shares each), the increase in the value of portfolio investment assets would only rise by £80 billion. Therefore, the increase in portfolio assets would only partly offset the overall decline in the net international investment position, with the UK’s overall position falling by £120 billion.
In addition to the decline in the country’s international investment position, there would also be a decline in primary income – although, similarly to the earlier example, the full extent is less clear. Similarly to the international investment position, UK net FDI earnings would decline by £20 billion – reflecting a £10 billion decrease in credits and a £10 billion increase in debits. The decrease in the primary income balance is likely to be partly offset by an increase in portfolio investment income; however, as discussed earlier, the extent of this will depend on company payout structures. Furthermore, since only 40% of the company’s shares are held by UK investors, the amount portfolio investment credits offset falling FDI earnings is reduced to 40% compared to a re-domiciling company that had remained fully owned by UK shareholders.
Therefore, this example of financial engineering results in both the international investment position and the primary income account deteriorating. The overall effects of financial engineering in this illustrative example are:
A decrease in FDI assets and increase in FDI liabilities, resulting in declines in the net FDI position and the overall international investment position balance.
A decrease in FDI credits and increase in FDI debits, resulting in declines in net FDI income and the overall primary income balance.
A rise in portfolio investment assets, offsetting a proportion of the fall in the overall international investment position balance. The proportion is determined by the share of the company still controlled by UK portfolio investors.
An increase in portfolio investment, offsetting some of the decline in the overall primary income balance. However, this is reduced due to the minority ownership of UK shareholders and companies’ dividend policies.
Example 3: A UK-based company that owns operations overseas, and is also fully owned by an overseas parent
While the former two examples focussed on UK parent companies, it is useful to also consider the impact of financial engineering on companies with more complex ownership structures.
Consider a company that is headquartered in the UK and has operations both within the UK and overseas. Assume each of these operations is worth £100 billion, or £200 billion in total. Furthermore, both operations each generate £10 billion per annum, or £20 billion in total.
An additional assumption applied is that the UK headquartered company is also owned by another company based overseas. A company structured in this way will feature on both the outward and inward FDI surveys, and both within assets and liabilities within Balance of Payments. The company’s overseas operations would be reported as FDI assets in Balance of Payments statistics, and the UK operations, plus the overseas operations the UK company controls, would be reported as liabilities. Therefore the company will have FDI assets worth £100 billion, and FDI liabilities worth £200 billion. The net FDI position of this company will be -£100 billion, reflecting only the UK operations.
The balance of payments and company balance sheets are both shown in Figure 3.0.
Table 3.0: Illustrative example of financial engineering, phase 1
| Table 3.0: Illustrative example of financial engineering, phase 1 | ||||
| Balance of Payments | Company's balance sheet | |||
| FDI | UK | |||
| Assets | £100 | Assets | £100 | |
| Credits | £10 | Profits | £10 | |
| Liabilities | £200 | |||
| Debits | £20 | |||
| Portfolio | Overseas | |||
| Assets | No data | Assets | £100 | |
| Credits | No data | Profits | £10 | |
| Liabilities | No data | |||
| Debits | No data | |||
| Source: Office for National Statisitcs | ||||
Download this table Table 3.0: Illustrative example of financial engineering, phase 1
.xls (27.1 kB)To illustrate the impact financial engineering may have on this company, assume that the overseas parent company decides to move the UK headquartered company into another overseas territory. The different company structure in this example results in a different outcome to the examples discussed earlier. First, the change in domicile would result in UK balance of payments reporting a decline in FDI assets of £100 billion, since these no longer transit through the UK. Second, the value of UK FDI liabilities would fall from £200 billion to £100 billion, since the UK operations will remain as liabilities; however, the overseas assets that were ultimately a liability to the parent company are no longer reported from the UK but from wherever the headquarters are now based.
Unlike previous examples, this example does not change portfolio investment, since the previously UK-based headquarters are fully owned by an overseas parent, therefore there are no portfolio investors involved.
Table 3.1: Illustrative example of financial engineering, phase 2
| Balance of Payments | Company's balance sheet | |||||||||||
| FDI | UK | |||||||||||
| Assets | £0 | Assets | £100 | |||||||||
| Credits | £0 | Profits | £10 | |||||||||
| Liabilities | £100 | |||||||||||
| Debits | £10 | |||||||||||
| Portfolio | Overseas | |||||||||||
| Assets | No data | Assets | £0 | |||||||||
| Credits | No data | Profits | £0 | |||||||||
| Liabilities | No data | |||||||||||
| Debits | No data | |||||||||||
| Source: Office for National Statistics | ||||||||||||
Download this table Table 3.1: Illustrative example of financial engineering, phase 2
.xls (27.6 kB)The impact of re-domiciling when this company structure applies is a symmetric decrease in both assets and liabilities, with no effect on the net FDI position. This is because the only factor that changes from re-domiciling is that the previously UK headquartered company’s overseas subsidiaries are now reported to the new destination of its headquarters. However, since those assets are also no longer reported as liabilities to the overall controlling parent, there is no change in the net FDI position.
The same principles also apply to the FDI earnings balance. The UK operations continue to be reported as debits to the overall controlling parent; however, the earnings the UK previously generated from its overseas subsidiary no longer feature in Balance of Payments as either credits from the overseas subsidiary, or debits to the overall controlling parent. Therefore the net effect on primary income and the current account is nil.
The overall effects of financial engineering in this illustrative example can be summarised as:
A decrease in FDI assets and a decrease in FDI liabilities, resulting in no change in the net FDI position.
A decrease in FDI credits and FDI debits, resulting in no change in the net FDI income balance.
No impact on the portfolio investment account.
13. Annex II: Assumptions
Assumption 1
While in theory the stock of FDI in any period should equal the stock of FDI in the previous period, plus flows, plus non-transaction related gains & losses, this only holds if the opening stock this period is equal to the previous period’s close. This, however, does not always hold due to changes in company responses and sample rotation. This paper therefore assumes that the previous period’s closing stock value is the opening stock value for the following period.

This assumption does not affect equity transactions, since these are calculated based on net acquisitions and reinvested earnings. However, this assumption does affect other capital transactions – which include intercompany loans and branch capital transactions. This is because the flows calculated for these are equal to the close minus opening values within the same reporting period. This assumption instead calculates these flows as the closing value this period minus the previous period’s closing value.
This assumption results in the intercompany loans & other capital flows presented in this paper differing from official estimates published in Balance of Payments. However, it is important to note that this is done solely to reconcile flows and positions by activity, and should not be treated as an alternative measure of flows.
Assumption 2
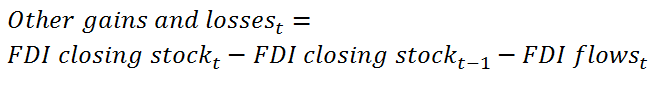
Assumption 1 results in a discrepancy between the closing stock value and the sum of the previous period’s close plus this period’s flows and other gains & losses values. Since flows are assumed to capture the population’s investment transactions fully (equity transactions are recorded in both the FDI and mergers & acquisitions surveys, and reinvested earnings are estimated and imputed for the entire non-sampled population), and other gains & losses only reflect the sampled population (with no estimation or imputation carried out for the non-sampled population), this paper assumes that the discrepancy between changes in FDI positions and flows are other gains & losses.
Back to table of contents

14. Annex III: Financial centres definitions
Table 4.0: Financial centres definitions
| Country | Justification |
| Ireland | Outward FDI stocks exceeded 100% of GDP in 2014 (253%) |
| Luxembourg | Outward FDI stocks exceeded 100% of GDP in 2014 (201%) |
| Switzerland | Outward FDI stocks exceeded 100% of GDP in 2014 (152%) |
| Netherlands | Outward FDI stocks exceeded 100% of GDP in 2014 (118%) |
| Andorra | Defined as an offshore financial centre according to the European Commission's Balance of Payments Vadamecum |
| Antigua and Barbuda | Defined as an offshore financial centre according to the European Commission's Balance of Payments Vadamecum |
| Anguilla | Defined as an offshore financial centre according to the European Commission's Balance of Payments Vadamecum |
| Aruba | Defined as an offshore financial centre according to the European Commission's Balance of Payments Vadamecum |
| Bahamas | Defined as an offshore financial centre according to the European Commission's Balance of Payments Vadamecum |
| Bahrain | Defined as an offshore financial centre according to the European Commission's Balance of Payments Vadamecum |
| Barbados | Defined as an offshore financial centre according to the European Commission's Balance of Payments Vadamecum |
| Belize | Defined as an offshore financial centre according to the European Commission's Balance of Payments Vadamecum |
| Bermuda | Defined as an offshore financial centre according to the European Commission's Balance of Payments Vadamecum |
| Cayman Islands | Defined as an offshore financial centre according to the European Commission's Balance of Payments Vadamecum |
| Cook Islands | Defined as an offshore financial centre according to the European Commission's Balance of Payments Vadamecum |
| Curacao | Defined as an offshore financial centre according to the European Commission's Balance of Payments Vadamecum |
| Dominica | Defined as an offshore financial centre according to the European Commission's Balance of Payments Vadamecum |
| Gibraltar | Defined as an offshore financial centre according to the European Commission's Balance of Payments Vadamecum |
| Grenada | Defined as an offshore financial centre according to the European Commission's Balance of Payments Vadamecum |
| Guernsey | Defined as an offshore financial centre according to the European Commission's Balance of Payments Vadamecum |
| Hong Kong. China | Defined as an offshore financial centre according to the European Commission's Balance of Payments Vadamecum |
| Isle of Man | Defined as an offshore financial centre according to the European Commission's Balance of Payments Vadamecum |
| Jersey | Defined as an offshore financial centre according to the European Commission's Balance of Payments Vadamecum |
| Lebanon | Defined as an offshore financial centre according to the European Commission's Balance of Payments Vadamecum |
| Liberia | Defined as an offshore financial centre according to the European Commission's Balance of Payments Vadamecum |
| Liechenstein | Defined as an offshore financial centre according to the European Commission's Balance of Payments Vadamecum |
| Marshall Islands | Defined as an offshore financial centre according to the European Commission's Balance of Payments Vadamecum |
| Mauritius | Defined as an offshore financial centre according to the European Commission's Balance of Payments Vadamecum |
| Montserrat | Defined as an offshore financial centre according to the European Commission's Balance of Payments Vadamecum |
| Nauru | Defined as an offshore financial centre according to the European Commission's Balance of Payments Vadamecum |
| Niue | Defined as an offshore financial centre according to the European Commission's Balance of Payments Vadamecum |
| Panama | Defined as an offshore financial centre according to the European Commission's Balance of Payments Vadamecum |
| Philippines | Defined as an offshore financial centre according to the European Commission's Balance of Payments Vadamecum |
| Saint Lucia | Defined as an offshore financial centre according to the European Commission's Balance of Payments Vadamecum |
| Samoa | Defined as an offshore financial centre according to the European Commission's Balance of Payments Vadamecum |
| Seychelles | Defined as an offshore financial centre according to the European Commission's Balance of Payments Vadamecum |
| Singapore | Defined as an offshore financial centre according to the European Commission's Balance of Payments Vadamecum |
| Sint Maarten (Dutch part) | Defined as an offshore financial centre according to the European Commission's Balance of Payments Vadamecum |
| Saint Kitts and Nevis | Defined as an offshore financial centre according to the European Commission's Balance of Payments Vadamecum |
| Saint Vincent and the Grenadin | Defined as an offshore financial centre according to the European Commission's Balance of Payments Vadamecum |
| Turks and Caicos Islands | Defined as an offshore financial centre according to the European Commission's Balance of Payments Vadamecum |
| Vanuatu | Defined as an offshore financial centre according to the European Commission's Balance of Payments Vadamecum |
| Virgin Islands, Britain | Defined as an offshore financial centre according to the European Commission's Balance of Payments Vadamecum |
| Virgin Islands, US | Defined as an offshore financial centre according to the European Commission's Balance of Payments Vadamecum |
| Source: Office for National Statisitcs | |