1. Main findings
Private rental prices paid by tenants in Great Britain rose by 2.5% in the 12 months to December 2015
Private rental prices grew by 2.7% in England, 0.7% in Wales and 0.9% in Scotland in the 12 months to December 2015
Rental prices increased in all the English regions over the year to December 2015, with rental prices increasing the most in London (3.9%)
2. About this statistical bulletin
The Index of Private Housing Rental Prices (IPHRP) measures the change in price of renting residential property from private landlords. The index is published as a series of price indices covering Great Britain, its constituent countries and the English regions.
IPHRP measures the change in price tenants’ face when renting residential property from private landlords, thereby allowing a comparison between the prices tenants are charged in the current month as opposed to the same month in the previous year. The index does not measure the change in newly advertised rental prices only, but reflects price changes for all private rental properties.
IPHRP is released as an experimental statistic. This is a new official statistic undergoing evaluation and therefore it is recommended that caution is exercised when drawing conclusions from the published data as the index is likely to be further developed. Once the methodology is tested and assessed, and the publication meets user needs, the IPHRP will be assessed against the Code of Practice for Official Statistics to achieve National Statistic status. A complete description of the methodology and the sources used is included in the article Index of Private Housing Rental Prices- Historical Series. Further details regarding improvements to the IPHRP price collection methodology can be found in the January 2015 article.
The IPHRP is constructed using administrative data. That is, the index makes use of data that are already collected for other purposes in order to estimate rental prices. The sources of private rental prices are Valuation Office Agency (VOA), Scottish Government (SG) and Welsh Government (WG). All 3 organisations deploy rental officers to collect the price paid for privately rented properties. The sources of expenditure weights are Department for Communities and Local Government (DCLG), Scottish Government, Welsh Government and VOA. DCLG produces estimates of the private rental dwelling stock for England and its regions. Scottish Government and Welsh Government produce estimates of private rental dwelling stock for Scotland and Wales.
Back to table of contents3. Great Britain rental prices
The Great Britain private rental price series starts in January 2011. This is the date for which all the sources for constituting countries are available on a consistent basis. This index has seen small and gradual increases since January 2011 (Figure 1).
Figure 1: IPHRP indices: Great Britain, January 2011 to December 2015
Source: Office for National Statistics
Notes:
- Not seasonally adjusted.
Download this chart Figure 1: IPHRP indices: Great Britain, January 2011 to December 2015
Image .csv .xlsBetween December 2014 and December 2015, Great Britain private rental prices grew by 2.5%. For example, a property that was rented for £500 a month in December 2014, which saw its rent increase by the Great Britain average rate, would be rented for £512.50 in December 2015. Rental prices for Great Britain excluding London grew by 1.8% in the same period (Figure 2).
Figure 2: IPHRP percentage change over 12 months: Great Britain, January 2012 to December 2015
12 month percentage change
Source: Office for National Statistics
Notes:
- Not seasonally adjusted.
Download this chart Figure 2: IPHRP percentage change over 12 months: Great Britain, January 2012 to December 2015
Image .csv .xls4. Rental prices for constituent countries of Great Britain
All the countries that constitute Great Britain have experienced rises in their private rental prices since 2011 (Figure 3). Since January 2011 England rental prices have increased more than those of Wales and Scotland.
Figure 3: IPHRP indices for Great Britain and its constituent countries, January 2011 to December 2015
Index values (January 2011=100)
Source: Office for National Statistics
Notes:
- Not seasonally adjusted.
Download this chart Figure 3: IPHRP indices for Great Britain and its constituent countries, January 2011 to December 2015
Image .csv .xlsThe annual rate of change in the IPHRP for Wales continues to be below that of England and the Great Britain average (Figure 4). Rental growth in Scotland has slowed to 0.9% in the year to December 2015, from 2.1% in the year for the months of January through June 2015.
Figure 4: IPHRP percentage change over 12 months for Great Britain and its constituent countries, January 2012 to December 2015
12 month percentage change
Source: Office for National Statistics
Notes:
- Not seasonally adjusted.
Download this chart Figure 4: IPHRP percentage change over 12 months for Great Britain and its constituent countries, January 2012 to December 2015
Image .csv .xlsBetween December 2014 and December 2015, rental prices grew by 2.7% in England, 0.7% in Wales and 0.9% in Scotland (Figure 5).
Figure 5: IPHRP percentage change over the 12 months to December 2015, Great Britain and its constituent countries
12 month percentage change
Source: Office for National Statistics
Notes:
- Not seasonally adjusted.
Download this chart Figure 5: IPHRP percentage change over the 12 months to December 2015, Great Britain and its constituent countries
Image .csv .xls5. Rental prices in England and its regions
The IPHRP series for England starts in 2005. Private rental prices in England show 3 distinct periods: rental price increases from January 2006 until October 2009, rental price decreases from December 2009 to October 2010, and increasing rental prices from November 2010 onwards (Figure 6). Of these 3 periods, 2008 showed the largest rental price increases. When London is excluded, England shows a similar pattern but with slower rental price increases from around January 2011.
Figure 6: IPHRP indices: England, January 2005 to December 2015
Index values (January 2011=100)
Source: Office for National Statistics
Notes:
- Not seasonally adjusted.
Download this chart Figure 6: IPHRP indices: England, January 2005 to December 2015
Image .csv .xlsFigure 7 shows the historical 12 month percentage growth rate in the rental prices of each of the English regions.
Figure 7: IPHRP percentage change over 12 months by English region, January 2006 to December 2015
12 month percentage change

Source: Office for National Statistics
Notes:
- Not seasonally adjusted.
- The dotted grey line shows the average England 12 month percentage change.
Download this image Figure 7: IPHRP percentage change over 12 months by English region, January 2006 to December 2015
.png (29.8 kB) .xls (56.3 kB)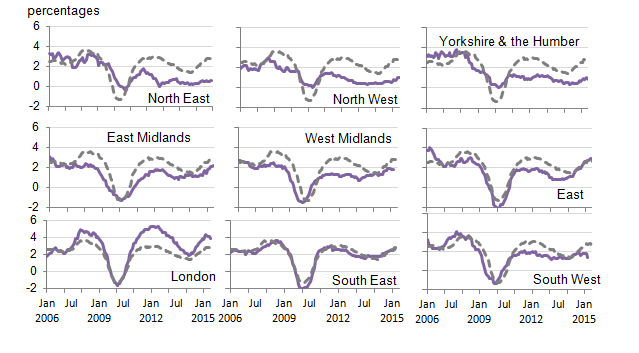
Since the beginning of 2012, English rental prices have shown annual increases ranging between 1.4% and 3.0% year-on-year, with December 2015 rental prices being 2.7% higher than December 2014 rental prices (Figure 8). Excluding London, England showed an increase of 1.9% for the same period.
Figure 8: IPHRP percentage change over 12 months for England, January 2006 to December 2015
12 month percentage change
Source: Office for National Statistics
Notes:
- Not seasonally adjusted.
Download this chart Figure 8: IPHRP percentage change over 12 months for England, January 2006 to December 2015
Image .csv .xlsIn the 12 months to December 2015, private rental prices increased in each of the 9 English regions (Figure 9). The largest annual rental price increases were in London (3.9%) followed by the East (2.8%) and the South East (2.8%). Rental price increases have been stronger in London than the rest of England since November 2010.
Figure 9: IPHRP percentage change over the 12 months to December 2015 by English region
12 month percentage change
Source: Office for National Statistics
Notes:
- Not seasonally adjusted.
Download this chart Figure 9: IPHRP percentage change over the 12 months to December 2015 by English region
Image .csv .xls6. Economic context
The rental market in Great Britain continued to show signs of strength in the fourth quarter (October to December) of 2015 as prices increased by 2.5% in the year to December 2015. This represents a slowdown of 0.2 percentage points in the annual growth rate compared with September 2015. This slowdown is partly driven by Scotland, where prices increased 0.9% in the year to December 2015, a fall of 0.7 percentage points compared with the annual growth rate in September 2015.
Conditions in the housing market as a whole may have been supporting rental price growth. Data from the ONS House Price Index release for November 2015 shows that house price growth has typically been stronger than rent price growth for a number of years. The Bank of England’s Agents’ Summary of Business Conditions for Quarter 4 (Oct to Dec) 2015 reported that private rental demand continued to grow steadily in the 3 months to December. Data from RICS’ Residential Market Survey for November 2015 confirmed this growth, noting that national tenant demand continued to grow in the 3 months to November 2015. The strength in demand is in contrast to supply: the latest RICS survey found that new landlord instructions fell again in November. However, there are marked regional patterns in conditions, as noted by the Association of Residential Letting Agents (ARLA). In London, where they found demand is above the UK average and supply is the weakest of any region, price growth has been relatively high at 3.9% in the year to December 2015. In Scotland, by contrast, where demand is weaker and supply is stronger, price growth has been more subdued at 0.9% in the past year.
Broader economic indicators suggest that the economy has continued to grow relatively strongly over recent periods, with output increasing 0.4% in Quarter 3 (July to Sep) 2015. Labour market conditions have continued to improve as unemployment fell to 5.1% in the 3 months to November 2015. A resurgence in job-to-job moves and tightening more widely suggests confidence in labour market outcomes remains high. Regular pay also grew 1.9% over the same period, continuing the run of revived real earnings growth, although rental prices are growing at a slightly faster rate than real wages in recent months.
Back to table of contents7. Improvements to IPHRP
IPHRP is classified as an experimental statistic to allow for evaluation of the output against user needs. As part of the ongoing development, we are considering how to improve IPHRP ahead of potential assessment as a National Statistic.
One of the main user requirements is for IPHRP to be published monthly. In response to this requirement, this publication will be the last quarterly publication of IPHRP, with the output moving to a monthly publication from February 2016 (for January 2016 data). The proposed date for the first monthly publication is 26 February 2016.
Work is also progressing towards sourcing a suitable Northern Ireland dataset for inclusion in IPHRP. We have been working with colleagues at the Northern Ireland Housing Executive to identify what data is available. In December 2015 NIHE provided ONS with a historic dataset which shall be used to investigate if the data can potentially be used in IPHRP. Further progress will be provided in the March 2016 IPHRP, with Northern Ireland data hopefully included later in the year.
For further details, please contact hpi@ons.gov.uk
Back to table of contents8. How are we doing?
We would welcome your views on the data presented in this statistical bulletin. Please contact the Housing Market Indices team using the email address below to discuss any aspect of the data, including your views on how we can improve the data.
Back to table of contents9. Data tables
The IPHRP reference table (176 Kb Excel sheet) provides full historical series for the tables accompanying the IPHRP statistical bulletin. This month, the tables have been updated with the latest monthly estimates for October, November and December 2015.
Back to table of contents