1. Main points
The number of households in the private rented sector in the UK increased from 2.8 million in 2007 to 4.5 million in 2017, an increase of 1.7 million (63%) households.
Younger households are more likely to rent privately than older households; in 2017 those in the 25 to 34 years age group represented the largest group (35%).
Households in the private rented sector are getting older; between 2007 and 2017, the proportion of household reference persons aged 45 to 54 increased from 11% to 16% while those aged 16 to 24 dropped from 17% to 12%.
As at financial year ending (FYE) 2017, 62% of households in the private rented sector in the UK had spent under three years in the same accommodation and only a small proportion (4%) had been in the same residence for 20 years or longer.
Northern Ireland has the newest private rented dwelling stock (38% built after 1980) in the UK, while Wales has the oldest (43% built pre-1919).
2. Things you need to know
This article has been complied to provide users with a better understanding of the private rented sector across the UK, what statistics are available for this sector and where possible, how the sector (and the statistics produced) differs across each of the four UK countries. The article builds on the work started by a cross-government group, which formed in 2017 to improve the accessibility and coherence in housing statistics. Further articles are planned that will cover other important sectors of housing and planning statistics, such as homelessness and affordability.
We welcome your views on the content and format of this article. Please contact us using the email address hpi@ons.gov.uk to discuss any aspect, including your views on how we can improve this article.
In February 2019, we will be holding a Housing user event. While the exact timings and content for the event are to be agreed, the event will include presentations on this article and other recently published official statistics which relate to housing. To add your details to the distribution list, which will be sent out at a later date confirming the details, please contact hpi@ons.gov.uk.
Wider housing statistics
While this article focuses on the private rented sector (PRS), it is useful to understand what other statistics are currently available, not only for the PRS but also the wider housing system. The decentralised nature of the UK housing system means that different organisations produce various statistics about different aspects of housing. To assist users, a cross-government housings statistics group was formed to help improve the coherence and accessibility of statistics in this area, recently publishing a guide to UK housing and planning statistics (XLSX, 43.7KB).
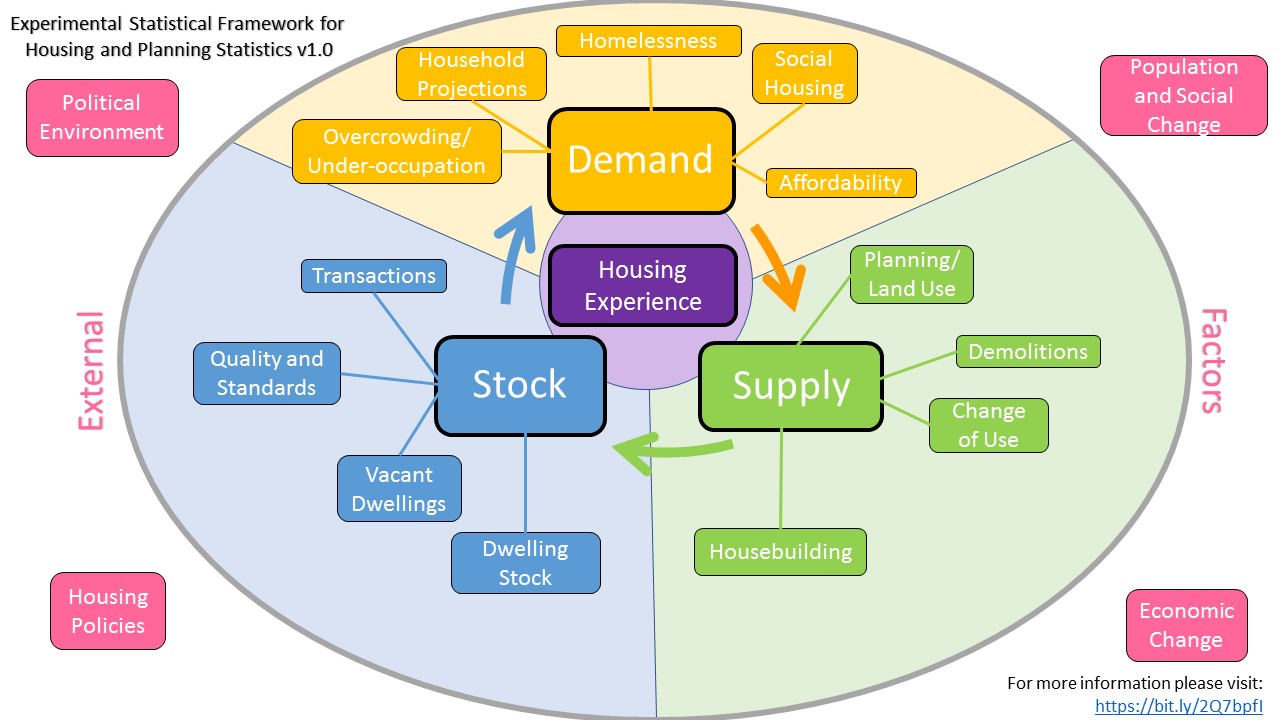
The guide, which will be reviewed and updated on a frequent basis, provides an overview of the statistics currently produced across the housing system classified as either contributing to the demand, stock or supply side of housing. In addition to this, users may be interested in the experimental UK housing and planning statistics framework (JPG, 124KB), which is intended to conceptually illustrate the areas of housing and planning that may be of interest across the UK official statistics landscape.
Both the guide and the framework will be subject to further development. However, in their current form they should provide users with a better understanding of the statistics which are produced. One area where departments and devolved administrations are collaborating is to improve the coherence of housing statistics. This article on the private rented sector is part of this aim as published in the workplan (PDF, 101.18KB).
Back to table of contents3. Tenants
This section focuses on those living in the private rented sector. To enable national comparisons the Family Resources Survey (FRS) and Annual Population Survey (APS) have been used, which have UK coverage. Each country also publishes a separate breakdown based on their own housing surveys. Some information on the types of household, age of the head of household and economic activity is available from each nation’s surveys, albeit in slightly different forms. There is also information provided for some nations through their surveys that is not available on other nation's surveys. For example, English and Scottish surveys ask health-related questions, but this is not available from the Northern Ireland surveys.
In 2001, household reference person (HRP) replaced head of household (HOH) for most government social surveys. How the HRP is defined varies across surveys. In the FRS it is defined as the highest income householder. Pre-2011, the head of household referred specifically to the male member of a cohabiting household.
UK
Figure 1 shows the increase in the percentage of households in privately rented accommodation over the past decade from 13% in financial year ending (FYE) 2007 to 20% in FYE 2017. This contrasts with the percentage of owner occupiers, which has seen a decline over the same period. For the period FYE 2017, the most recent data available, private renters accounted for 20% of all households, compared with 62% for owner occupiers and 17% for social housing occupants.
Figure 1: Households by tenure, FYE 2007 to FYE, 2017, UK
Source: Family Resources Survey, Department for Work and Pensions
Download this chart Figure 1: Households by tenure, FYE 2007 to FYE, 2017, UK
Image .csv .xlsWhen considering absolute changes in households by tenure it is important to note that the total number of households in the UK has increased by 1.6 million homes (7%) over the past decade, from 25.6 million households in 2007 to 27.2 million households in 2017 (Families and Households: 2017, Labour Force Survey households dataset).
The number of households living in the private rented sector in the UK increased from 2.8 million in 2007 to 4.5 million in 2017, an increase of 1.7 million (63%). Over this period, the number of owner occupier households remained broadly consistent at 17.7 million households. However, households owned outright increased from 7.9 million to 9.4 million while households buying with a mortgage fell from 9.8 million to 8.3 million. The number of social rented households decreased by 200,000 households to 4.5 million (Annual Population Survey). The APS is not a stand-alone survey; it uses data combined from two waves of the main Labour Force survey and has a larger sample size than the FRS. It should be noted when comparing 2007 with 2017 figures that APS data from 2006 to 2011 is weighted with 2014 population estimates, while 2012 to 2017 data are weighted with 2017 population estimates.
Younger households are more likely to rent privately, with those in the 25 to 34 years age group representing the largest group (Figure 2). Households in the 45 to 54 years age group saw the biggest percentage increase from 11% in 2007 to 16% in 2017, an estimated increase of 384,000 households.
Figure 2: Private renting sector by age of household reference person, 2007 and 2017, UK
Source: Annual Population Survey, requested table, Office for National Statistics
Download this chart Figure 2: Private renting sector by age of household reference person, 2007 and 2017, UK
Image .csv .xlsIn FYE 2017, 35% of one adult households with children were in the private rented sector, compared with 18% in FYE 2007. For households without children, the largest percentage increase has been for households comprised of one male adult. In FYE 2007, 16% were in the private rented sector compared with 27% in FYE 2017 (Family Resources Survey).
England
In FYE 2017, the private rented sector accounted for 21% of households in England (Family Resources Survey), similar to that of the UK (20%). The proportion of private rented sector households has doubled since FYE 1997 and the overall size of the private rented sector has increased from 2.6 million households in FYE 2007 to 4.7 million households in FYE 2017 (English Housing Survey). The sector grew a little between FYE 1997 and FYE 2007 (0.5 million), but growth accelerated after FYE 2007, with over two million additional households added to the sector. However, growth has slowed in more recent years.
In FYE 2017, household reference persons (HRP) in the private rented sector in England were, on average, younger than social renters and owner occupiers, with a mean age of 40 years (compared with 52 years for social renters and 57 years for owner occupiers). Whilst this is broadly unchanged over the past ten years, the distribution of the sector across age bands has shifted (English Housing Survey).
Over the past 20 years, the biggest change was in the proportion of 35- to 44-year-olds living in the private rented sector, increasing from 16% in FYE 1997 to 24% in FYE 2017 (Figure 3). There were more than three times as many 35- to 44-year-olds renting privately in FYE 2017 than 20 years ago: an increase from 331,000 households in FYE 1997 to 1.1 million in FYE 2017. The single largest group of private renter HRPs remains the 25 to 34 years age band, which represents 33% of the sector with 1.5 million households.
Figure 3: Age of household reference person in private rented sector, FYE 1997, FYE 2007 and FYE 2017, England
Source: English Housing Survey, Ministry of Housing Communities, and Local Government
Download this chart Figure 3: Age of household reference person in private rented sector, FYE 1997, FYE 2007 and FYE 2017, England
Image .csv .xlsHRPs in the private rented sector appear to be the most diverse in terms of ethnicity and nationality, compared with HRPs living in other tenures. In FYE 2017, the majority are white, at 82%, the same as social renters and lower than owner occupiers (92%). The next single grouping is black HRPs, who make up 5% of the private sector, compared with 8% of social renters and 1% of owner occupiers. Around three-quarters (74%) of private renters are UK or Irish nationals, the lowest of any sector; these being 91% of social renters and 97% of owner occupiers. Around 17% of private renting HRPs were EU citizens, compared with 4% and 2% of social renters and owner occupiers. The remaining 9% of the private rented sector’s HRPs have a nationality from outside the UK or EU (5% for social renters and 2% for owner occupiers).
Looking at economic activity, most private renter HRPs are in work (74%) compared with 61% of owner occupiers and 43% of social renters (Figure 4). The number of private renters in work has roughly doubled since FYE 2007. However, the number of households in the private rented sector has also increased over this period. Throughout this time, the increase in part-time workers is greater than for those in full-time employment.
In FYE 2017, the widest gap between HRPs in the private rented sector and all tenures is for those who are in retirement – 9% of private renters are retirees, compared with 28% across all households, although this may in part reflect the younger age profile of the private rented sector. The proportion of the private rented sector that are students has not changed much over the past decade – from 7% in FYE 2007 to 6% in FYE 2017.
Figure 4: Proportion of HRPs by economic activity, private rented sector and all tenures, FYE 2017, England
Source: English Housing Survey, Ministry of Housing, Communities, and Local Government
Download this chart Figure 4: Proportion of HRPs by economic activity, private rented sector and all tenures, FYE 2017, England
Image .csv .xlsThe English Housing Survey (EHS) also collects data by national statistics socio-economic classification, allowing analysis by occupation. Those in higher and lower managerial and professional occupations make up the largest segment of the private rented sector, accounting for 41% of HRPs, compared with 51% for owner occupiers and 15% for social renters. Routine and semi-routine occupations follow at 29% for the private rented sector, 56% in the social rented sector and 18% in the owner-occupied sector.
In FYE 2017, 38% (1.7 million) of households in the private rented sector had dependent children, similar to the proportion in the social rented sector (35%, 1.4 million). In the owner-occupied sector, 44% (2.9 million) of those buying with a mortgage had dependent children, compared with 9% (0.6 million) of those who own outright (EHS).
Scotland
In FYE 2017, the private rented sector accounted for 15% of households in Scotland, below the percentage for the UK (20%). While Scotland has the same proportion of households in the owner-occupied sector (63%) as the UK, it has a higher proportion of households in the social renting sector, 22% compared with 17% in the UK. The proportion of households in the private rented sector has increased from 9% in FYE 2007 to 15% in FYE 2017 (Family Resources Survey). Separate results from the Scottish Household Survey over the longer period 1999 to 2017 show that the private rented sector accounted for only 5% of homes in 1999. They also show that the increase from 5% to 15% between 1999 and 2017 has equated to an estimated extra 240,000 households living in the sector over this time period, an increase from 120,000 to 360,000 households. Alternatively, owner occupiers accounted for 61% of homes in 1999 (1.3 million households), and 62% in 2017 (1.5 million). Social renters made up 32% of households in 1999 (approximately 700,000) and 22% in 2017 (550,000).
The Scottish Household Survey collects information on the age of the highest income householder (HIH). In 2017, 33% of HIHs renting privately were in the 25 to 34 years age band (approximately 120,000 households), the same percentage as in 2007 (when it was 70,000 households).
Figure 5: Age of highest income householders in the private rented sector, 2007 and 2017, Scotland
Source: Scottish Household Survey, Scottish Government
Download this chart Figure 5: Age of highest income householders in the private rented sector, 2007 and 2017, Scotland
Image .csv .xlsAdults in the private sector are more ethnically diverse compared with adults in other tenures. In 2017 only 58% of those in the private rented sector had recorded their ethnicity as being White Scottish, compared with 78% across all sectors. A further 31% of HIHs in the private rented sector had recorded their ethnicity as White Other British, Polish or Other. The remainder of HIHs had recorded their ethnicity as being Asian, Asian Scottish or Asian British (6%), African, Caribbean or Black (1%), or Other Ethnic Group (2%).
With respect to economic activity, Scotland mirrors the England picture, whereby owner occupier (61%) and private renting (56%) adults are more likely to be working than social renters (38%). There has been a large increase in the number of full time employed adults who are living in the private rented sector, with the number of full time employed adults increasing by an estimated 180,000 people between 1999 and 2017, from 70,000 to 250,000 adults. Six percent of private renting adults were retired, compared with 24% across all households. A fifth of private renters are students, in comparison to a twentieth across all tenures.
There has also been an increase in the number of adults in further or higher education who are living in the private rented sector, rising by an estimated 90,000 people between 1999 and 2017. Despite this increase, the share of all private renting adults who are in further or higher education was at a similar level in 2017 (20%) as in 1999 (22%) due to the overall growth of the sector.
Since 1999, there has been a small four percentage point increase in the share of households with children, so that in 2017 nearly a quarter (24%) of all privately renting households were households with children. However, it is worth noting that the private rented sector has a smaller share of large families and so the proportion of all children living in the private sector is lower than 24%. There were an estimated 150,000 children living in the private rented sector in 2017, which equates to around 15% of all children in Scotland. The 150,000 children living in the sector in 2017 is an increase of 110,000 on the 40,000 children living in the sector in 1999.
Wales
Estimates from the Annual Population survey are used due to its sample being larger than the Family Resource Survey for Wales. In 2017, the private rented sector accounted for 13% of households in Wales, below the percentage for the UK (17%). While Wales has a slightly lower proportion of households in the social rented sector (15%) compared with the UK (17%), it has a higher proportion of owner-occupied households, 71% compared with 66% in the UK (42% in Wales and 35% in the UK were owned outright, while 29% in Wales and 31% in the UK were bought with a mortgage). The proportion of households in the private rented sector has increased from 9% (118,000 households) of households in 2007 to 13% (176,000 households) in 2017 (Figure 6).
Figure 6: Households by tenure, 2007 to 2017, Wales
Source: Annual Population Survey, requested table, Office for National Statistics
Download this chart Figure 6: Households by tenure, 2007 to 2017, Wales
Image .csv .xlsThe National Survey for Wales finds that the proportion of households in the private rented sector has decreased for those aged under 45 years between FYE 2013 and FYE 2018, with the biggest percentage point fall in the 16 to 24 years age group (Figure 7). In FYE 2013, 31% of HRPs in the 16 to 24 years age band were in the private rented sector, this has fallen to 25% in FYE 2018. The decrease in the private rented sector for this age group is offset by an equivalent increase in the owner-occupied sector (from 52% in FYE 2013 to 57% in FYE 2018). The social rented sector remained broadly unchanged for these years at 17% and 18%.
Figure 7: Age of households in the private rented sector, FYE 2013 and FYE 2018, Wales
Source: National Survey for Wales, Welsh Government
Download this chart Figure 7: Age of households in the private rented sector, FYE 2013 and FYE 2018, Wales
Image .csv .xlsAn alternative source, the Annual Population Survey (APS), also provides a breakdown by age of HRPs. In 2017, the highest number of households in the private rented sector was in the age band 25 to 34 years (57,000), followed by 35 to 44 years (36,000), while the lowest was 75 years and over (8,000).
Northern Ireland
In FYE 2017, the private rented sector accounted for 21% of households in Northern Ireland (NI), similar to that of the UK (20%). Over the past decade the private rented sector has increased from 13% of households in FYE 2007 to 21% in FYE 2017 (Family Resources Survey). According to the APS, in 2007 the private rented sector in NI stood at 76,000, while the social rented sector was at 115,000, those buying with a mortgage at 262,000, and those who owned outright at 232,000. In 2017, the private rented sector had almost doubled to 138,000, the social rented sector had increased only slightly to 117,000, those buying with a mortgage had decreased substantially to 224,000 and those who owned outright had increased to 261,000.
The NI House Condition Survey (PDF, 678KB) (NIHCS) provides information on household composition, age of household reference person (HRP), household religion and employment status. These data are collected from the HRP. References to private rented sector HRPs in the survey also include those in tied dwellings. The HRP is defined as the owner or rent payer of the property, or highest earner where ownership or tenancy is joint. Data in this section come from the 2016 NIHCS.
Similar to the other countries of the UK, the age distribution of private renters in NI skews towards the young. Sixty-eight percent of all 17- to 24-year-old HRPs are private renters, compared with 9% owner occupiers and 24% social renters. It must be noted, though, that the 17 to 24 year age group consisted of small numbers and so caution should be applied when interpreting these proportions. Private renters are most common in the aged under 40 years categories, whereas owner occupiers are more frequent in the aged above 40 years categories. Social renters take up a fairly equal portion across tenures in all age categories (ranging from 14% to 18%) except aged under 24 years where they account for 24% of households. In terms of absolute numbers and proportions within tenures, 59,000 out of 136,000 (43%; Figure 8) private renters were in the 25 to 39 years category, the highest out of all age ranges. For social renters this was 41,000 out of 119,000 (34%) in the 40 to 59 years category, and for owner-occupiers this was 175,000 out of 488,000 (36%) in the 40 to 59 years age range.
Figure 8: Age of household reference person in private rented sector compared to all tenures, 2016, Northern Ireland
Source: Northern Ireland House Condition Survey, Northern Ireland Housing Executive
Download this chart Figure 8: Age of household reference person in private rented sector compared to all tenures, 2016, Northern Ireland
Image .csv .xlsWith regards to economic activity, around one-fifth (21%) of all HRPs in work were private renters according to the NIHCS of 2016, compared with 71% of those in work being owner occupiers, leaving 8% of these as social renters. In 2006, 43% of private renters were in work, compared with 57% (78,000 of 136,000) in 2016. For owner occupiers this was 61% in 2006 down to 55% (269,000 of 488,000) a decade later, and for social renters this was 18%, which increased to 25% (30,000 of 119,000) in 2016. Those private renters not working remained at around 20% from 2006 to 2016. In this categorisation, not working refers to job seekers as well as those who are not seeking a job and students. Retired HRPs were more likely to be in the owner-occupied sector (38%) than in the private rented sector (11%), while social renters were almost as likely as owner occupiers to be retired (30%). The low proportion of retired households reflects the low representation of older age bands in the sector.
Looking at household compositions, the survey splits households into three categories: adult households, households with children and older households. Of these, adult households showed the largest increase in moving to the private rented sector over the past 10 years, from 12% of adult households choosing to rent privately in 2006 to 19% in 2016, so that they now make up just under 41% (55,000 of 136,000) of the sector. Most of this increase occurred between 2006 and 2011. The proportion of households with children in the sector has also increased, with 47% of private rented households with children in 2016; this is now the single largest group in the sector. Older households make up the rest of the sector, at just 13%. Just under a third (29%) of all households with children lived in the private rented sector. Adult households were most likely to be owner occupiers (64%) out of all tenures, similarly for households with children (55%), and older households most of all (78%), reflecting this being the predominating tenure in terms of size.
Back to table of contents4. Affordability
Affordability is an important issue facing households. A more detailed focus on affordability across all tenures will be explored in a future article. Data from the Family Resources Survey is used for comparisons across countries. Other national surveys are used within each country chapter to provide further details for each country, however these are not all fully comparable across nations.
Great Britain
As a simple measure, we can consider the growth in private rental prices relative to the growth in earnings over the same period. Figure 9 suggests that, at a Great Britain level, growth in private rental prices, as measured by the Index of Private Housing Rental Prices (IPHRP) rose above that of Average Weekly Earnings (AWE) up until 2016, however the gap has narrowed since then, driven by a slowdown in the growth of private rental prices.
Figure 9: Average Weekly Earnings and Index of Private Housing Rental Prices indices, January 2011 to October 2018, Great Britain
Source: Average Weekly Earnings and Index of Private Housing Rental Prices, Office for National Statistics
Notes:
- AWE equates to money paid per week, per job to employees in Great Britain, not including those who are self-employed. It is the lead measure for short-term earnings growth.
- IPHRP is an experimental index tracking prices paid for renting property from private landlords in the UK.
Download this chart Figure 9: Average Weekly Earnings and Index of Private Housing Rental Prices indices, January 2011 to October 2018, Great Britain
Image .csv .xlsWhile the IPHRP does measure inflation of private rental prices, average weekly earnings are not available with a split by tenure and therefore may not accurately reflect changes to earnings for those living in the private rented sector. In addition, average weekly earnings figures do not take into account income from other sources, including pensions or benefits.
A fairer comparison might be to consider rent relative to income for households in the private rented sector using a consistent data source such as a household survey. In interpreting survey data over time users should be aware that no adjustment is made for the quality of housing that these housing costs are associated with. For example, changes in the average size of properties or number of rooms over time are not adjusted for.
Figure 10 presents the average ratios of housing costs to income for each country in Great Britain country over the nine-year period from financial year ending (FYE) 2008 to FYE 2016 based on Family Resources Survey (FRS) data. Pooled samples across three years of data have been used to improve statistical reliability.
Net income is defined here as the total income received (including housing benefit payments) by the household excluding taxes such as income tax and council tax. Net income has not been adjusted (“equivalised”) for family size. Housing costs include rent gross of Housing Benefit, as well as water rates and service charges where applicable.
For the FYE 2014 to FYE 2016 period, private rented households in England paid more for housing costs as a proportion of income (32%) than households in Wales (29%) and Scotland (25%). This pattern has not changed much over the last ten years (Figure 10). This likely reflects those in England having higher housing costs. However, there is also some evidence that household incomes in the private rented sector (PRS) can vary between countries, with 37% of PRS households in Wales having a net annual income of £15,000 or less, compared with 30% in Scotland and 21% in England (FRS data). It is important to note that Wales has a smaller sample size and therefore greater margin of error than the other two countries, so this difference in ratios may not be statistically significant.
The median household weekly private rent payment for the UK, according to the Family Resource Survey FYE 2017, was £134. The highest median was in England at £138, with the lowest being in Northern Ireland at £97. Wales and Scotland stood at £105 and £112 respectively.
Figure 10: Median ratio of private rented housing costs to net unequivalised household income, FYE 2008 to FYE 2016, countries of Great Britain
Source: Social Tenants in Scotland 2016, Scottish Government, estimates based on Family Resources Survey data
Notes:
- Data for Northern Ireland is excluded as it is not available on a consistent basis.
Download this chart Figure 10: Median ratio of private rented housing costs to net unequivalised household income, FYE 2008 to FYE 2016, countries of Great Britain
Image .csv .xlsTo have a large enough sample size to look at the same affordability ratios across income deciles for countries in Great Britain, FRS data from FYE 2012 to FYE 2016 has been pooled. This analysis reveals that housing costs take up a much higher proportion of income for those in the lowest income decile (64% in England; 68% in Wales and 57% in Scotland), compared with the highest income decile (20% in England; 14% in Wales; 15% in Scotland). Figure 11 shows the downward trend in this affordability ratio as income increases; housing costs are a lot more affordable for those on higher incomes.
Figure 11: Median ratio of housing costs to net household income, by PRS income decile and country (combined five years of data FYE 2012 to FYE 2016), countries of Great Britain
Source: Calculation based on Family Resources Survey data, Department for Work and Pensions
Download this chart Figure 11: Median ratio of housing costs to net household income, by PRS income decile and country (combined five years of data FYE 2012 to FYE 2016), countries of Great Britain
Image .csv .xlsSeparate earnings-based rental affordability statistics are also available within Housing summary measures analysis: 2016, publishing England and Wales estimates down to a local authority level. Household income-based measures of affordability, as presented here, are more comprehensive but are not available for lower geographies at present.
Another element of affordability is financial support received. Housing Benefit is available to support eligible low-income households with the cost of renting their home. The benefit can cover the whole cost of rent or part of it, depending on income, circumstances, and other factors such as the type of landlord and local housing allowance rates.
Universal Credit (UC) is being introduced in stages across the UK. UC began a gradual rollout across the UK in 2013, starting with some postcodes in the North West of England. As of 2018, all new benefit claimants in England, Wales, Scotland and Northern Ireland will have to apply for Universal Credit, while existing claimants with no changes in circumstances will not be asked to switch over until at least 2019. It will eventually replace Housing Benefit, income support, income-related employment and support allowance, income-based jobseeker's allowance, child tax credits, and working tax credit. Some Universal Credit claimants will receive the housing element, which will provide help with rent costs.
Figure 12 shows the percentage of dwellings receiving housing benefit from 2011 to 2016 for the private rented sector for England, Scotland and Wales, using housing benefit claim estimates from the Department for Work and Pensions (DWP) and dwelling stock estimates from the Ministry of Housing, Communities and Local Government (MHCLG). The percentage of dwellings receiving housing benefit has decreased for Scotland between 2011 and 2016, with Wales decreasing since 2013 and England showing a broad decrease over this period. Wales had the highest percentage of households receiving housing benefit in 2016 at 40%, compared with 27% in England and 23% in Scotland. At the end of 2011, the total number of private renting housing benefit claimants in England was 1.4 million, while for Wales it was 82,000 and for Scotland 93,000. This decreased in 2016 for England to 1.2 million, for Wales to 76,000, and for Scotland to 84,000. Over this period the number of households and dwellings in the private rented sector also grew for all countries of the UK. The trend from 2013 onwards could be impacted by the introduction of UC and claimants switching from housing benefit to UC, along with new benefits claimants now claiming UC.
Figure 12: Housing Benefit claimants as a percentage of dwellings by country for private rented sector, countries of Great Britain
Source: Calculation based on Department for Work and Pensions housing benefit claim estimates and Ministry of Housing, Communities, and Local Government dwelling stock estimates
Notes:
- The decrease from 2013 onwards could be due to the introduction of Universal Credit (UC) and claimants switching from housing benefit to UC, along with new benefit claimants now claiming UC.
- These figures exclude those receiving the housing element of UC.
Download this chart Figure 12: Housing Benefit claimants as a percentage of dwellings by country for private rented sector, countries of Great Britain
Image .csv .xlsWhile not directly comparable due to differing sources and methodology, the Northern Ireland Housing Conditions Survey reports that 43% (53,000) of private rented households in Northern Ireland were in receipt of housing benefit in 2011, compared with 73% (81,000) of social rented households. In 2016 this was broadly unchanged at 42% (57,000) for private rented households, and slightly lower at 66% (78,000) for social rented households.
England
The proportion of household income (including housing benefit) that private renters spent on their rent has not changed between FYE 2011 and FYE 2017 (English Housing Survey, EHS). In FYE 2017, those privately renting spent 34% of their gross household income on rent, compared to 28% for social renters. Those buying their home with a mortgage spent 18% of their household income on mortgage payments.
Figure 13: Mortgage or rent as a ratio of household income (including and excluding housing benefit), by tenure, FYE 2017, England
Source: English Housing Survey, Ministry of Housing , Communities, and Local Government
Download this chart Figure 13: Mortgage or rent as a ratio of household income (including and excluding housing benefit), by tenure, FYE 2017, England
Image .csv .xlsWhen only household reference person and partner income is used (irrespective of whether there are other adults in the household), those buying their home with a mortgage spent, on average, 19% of their income on mortgage payments, whereas rent payments were 31% of income for social renters and 41% of household income for private renters including Housing Benefit. Excluding Housing Benefit, the average proportion of income spent on rent was 41% for social renters and 46% for private renters.
According to the EHS, median weekly rent in London is nearly twice that of the rest of England. In FYE 2017 London median weekly rent was £309 compared with £158 for England excluding London (Figure 14).
Figure 14: Median weekly rents, private renters, FYE 2009 to FYE 2017, London and England excluding London
Source: English Housing Survey, Ministry of Housing, Communities, and Local Government
Download this chart Figure 14: Median weekly rents, private renters, FYE 2009 to FYE 2017, London and England excluding London
Image .csv .xlsGrowth in private rental property rental prices in London has historically been above the rest of England but has slowed in recent years (Figure 15).
Figure 15: Index of Private Housing Rental Prices percentage change over 12 months, January 2006 to December 2018, London and England excluding London
Source: Index of Private Housing Rental Prices, Office for National Statistics
Notes:
- IPHRP is an experimental index tracking prices paid for renting property from private landlords in the UK.
Download this chart Figure 15: Index of Private Housing Rental Prices percentage change over 12 months, January 2006 to December 2018, London and England excluding London
Image .csv .xlsThe mean weekly gross household income for private renters, according to the EHS for FYE 2017 was £696, higher than social renters’ income (£403), and lower than owner occupiers’ income (£884). The medians were £551, £326, and £720 respectively.
The distribution of net household annual income bands in England over the period FYE 2014 to FYE 2016 (FRS data) finds that the highest proportion of private renters (nearly one-fifth, 19%) fell in the over £40,000 band, compared with social renters who were more likely to fall into the £10,001-£15,000 band (26%). Almost half of those buying with a mortgage earned over £40,000 (44%), while this was one in five for those who owned outright (20%). Figure 16 shows the distribution in more detail.
Figure 16: Household income bands by tenure, FYE 2014 to FYE 2016, England
Source: Family Resources Survey, Department for Work and Pensions
Download this chart Figure 16: Household income bands by tenure, FYE 2014 to FYE 2016, England
Image .csv .xlsAccording to the EHS, in FYE 2017, just over one-fifth (22%) of private renters received housing benefit to help with rent payment. Of those that receive housing benefit, one-fifth (19%) report that this fully covers their rent. In comparison, approximately three-fifths (59%) of social renters received housing benefit in 2016 to 2017.
Since FYE 2009 the percentage of private renters receiving housing benefit has remained broadly unchanged (20% in FYE 2009, with a steady increase to 27% in FYE 2015 before falling to 22% in FYE 2017, as shown in Figure 17). These estimates differ to those presented for countries of Great Britain (31% for FYE 2008 to FYE 2010) as these are calculated from surveys rather than administrative sources such as Department for Work and Pensions (DWP). The reason survey data (such as the EHS) differ from DWP data is that surveys ask questions of the household reference person and in so doing might miss other household members in receipt of benefits. In contrast, as the DWP is the administrative source of data it has definitive information about all “benefit units”, that is, all people who receive benefits, and is therefore more complete.
The mean amount received per week for private renters in 2016 was £103 (£100 in FYE 2009, showing an unsteady increase over the years until it peaked in FYE 2016 at £111 then dropped slightly). For social renters this was £82 in FYE 2017, an increase from £62 in FYE 2009 which has steadily increased over the past eight years.
Figure 17: Percentage of private and social renters in receipt of housing benefit from FYE 2009 to FYE 2017, England
Source: English Housing Survey, Ministry of Housing , Communities, and Local Government
Download this chart Figure 17: Percentage of private and social renters in receipt of housing benefit from FYE 2009 to FYE 2017, England
Image .csv .xlsAlmost half of private renters said they find paying rent fairly easy (49%), with few saying it is very difficult (9%), 4% are currently in arrears, and 5% have been in arrears in the past year. Those in receipt of housing benefit (8%) were more likely to be in arrears than those not (3%) (EHS).
Just over one-third of private renters (36%) said they have savings or money invested, and of these approximately 70% had between £1,000 and £16,000 in savings. As would be expected (Figure 18), the oldest generations were more likely to have savings or money invested (50% of 65- to 74-year-olds, and 46% of under-75-year-olds). The least likely to have savings or money invested were 45- to 64-year-olds (30%).
Figure 18: Percentage of private renters with or without savings by age of household reference person, financial year ending 2017, England
Source: English Housing Survey, Ministry of Housing, Communities, and Local Government
Download this chart Figure 18: Percentage of private renters with or without savings by age of household reference person, financial year ending 2017, England
Image .csv .xlsIn terms of how much money each age group of private renters is saving, the highest proportion across all age groups had £5,000 to £16,000 in savings, however of those in the 45 to 64 years age group, 23% had savings of £50,000 and above.
Scotland
The proportion of household income (including housing benefit) that households in the private rented sector spent on their rent has remained relatively constant since FYE 2007, whilst the proportion for those owning with a mortgage dropped after FYE 2010. This is likely to be have been due to lower mortgage interest rates in more recent years. Across the three-year period from FYE 2014 to FYE 2016, privately rented households in Scotland spent 25% of their net household income on housing costs, a similar proportion to the social sector (24%). Those households owned with a mortgage spent 9% of their income on housing costs, whilst those owned outright spent 3% (Figure 19).
Figure 19: Median ratio of housing costs to net unequalised household income for the period FYE 2007 to FYE 2016 across tenures, Scotland
Source: Family Resources Survey, Department for Work and Pensions
Notes:
- Net income is defined here as the total income received (including housing benefit payments) by the households excluding taxes such as Income Tax and Council Tax. Net income has not been adjusted (“equivalised”) for family size. Housing costs include rent gross of Housing Benefit, as well as water rates and service charges where applicable.
Download this chart Figure 19: Median ratio of housing costs to net unequalised household income for the period FYE 2007 to FYE 2016 across tenures, Scotland
Image .csv .xlsAnalysis of the same data finds that 39% of private rented households spent more than 30% of their net household income on housing costs.
The median household weekly rent payment in the private rented sector in Scotland was £112, compared with £71 in the social rented sector, and mortgage repayments of £120 for owner occupiers (FRS FYE 2017).
The Private Sector Rent Statistics 2010 to 2017 report shows median monthly rent for two-bedroom properties (the most common property in the private rental sector) in Scotland in 2017 was £595 (mean £645). For three-bedroom properties (the second most common type) the median rent in 2017 was £700 (mean £787).
Private rental growth in Scotland weakened since mid-2015 but has started to strengthen again since 2017 (Figure 20).
Figure 20: Index of Private Housing Rental Prices percentage change over 12 months, January 2012 to December 2018, Great Britain and Scotland
Source: Index of Private Housing Rental Prices, Office for National Statistics
Notes:
- IPHRP is an experimental index tracking prices paid for renting property from private landlords in the UK.
Download this chart Figure 20: Index of Private Housing Rental Prices percentage change over 12 months, January 2012 to December 2018, Great Britain and Scotland
Image .csv .xlsFigure 21 shows the distribution of net household annual income across tenures, from the Scottish Household Survey (SHS) 2017. The highest proportion of private renters (30%) earned in the £10,001 to £20,000 category. A very small proportion of private renters earned over £60,000. Social renters had the highest proportion in the £10,001 to £20,000 category (49%). Owner occupier households are more likely to be at the higher end of the income spectrum than either private or social renters, with 17% of them earning over £50,001 (compared with 4% of private renters and 1% of social renters).
Figure 21: Household income bands by tenure, 2017, Scotland
Source: Scottish Household Survey, Scottish Government
Notes:
- The data period in the title for Figure 21 has been updated from 2016 to 2017.
Download this chart Figure 21: Household income bands by tenure, 2017, Scotland
Image .csv .xlsWales
Figure 22 shows the median ratio of housing costs as a proportion of net household income over the period FYE 2014 to FYE 2016 for each tenure category. Across the three-year period from FYE 2014 to FYE 2016, private rented households in Wales spent 29% of their net household income on housing costs, a similar proportion to the social sector (28%). These figures compare with equivalent figures of 9% for households owned with a mortgage and 3% for households owned outright.
The similar relative housing expenses between the privately rented sector and social households is likely to reflect those in the private rented sector having higher average rental costs but also having higher average income levels than those in social housing.
Figure 22: Median ratio housing costs to net unequivalised household income, FYE 2014 to FYE 2016, by tenure, Wales
Source: Family Resources Survey, Department for Work and Pensions
Notes:
- Net income is defined here as the total income received (including housing benefit payments) by the households excluding taxes such as income tax and council tax. Net income has not been adjusted (“equivalised”) for family size. Housing costs include rent gross of Housing Benefit, as well as water rates and service charges where applicable.
Download this chart Figure 22: Median ratio housing costs to net unequivalised household income, FYE 2014 to FYE 2016, by tenure, Wales
Image .csv .xlsThe FRS shows that in the private rented sector, the median weekly household expenditure in Wales (for FYE 2017) is £105, whereas for the social rented sector this is £84, and £115 for owner occupier mortgage repayments.
The latest Private sector rents data from the Welsh Government are from 2017. The median monthly rent in Wales for two-bedroom properties (the most common property in the private rental sector) is £500 (£525 mean), and £550 (£576 mean) for three-bedroom properties (the second most common).
Private rental growth in Wales has historically been below the rent of Great Britain but has strengthened in recent years (Figure 23).
Figure 23: Index of Private Housing Rental Prices percentage change over 12 months, Wales and Great Britain, January 2012 to December 2018
Source: Index of Private Housing Rental Prices, Office for National Statistics
Notes:
- IPHRP is an experimental index tracking prices paid for renting property from private landlords in the UK.
Download this chart Figure 23: Index of Private Housing Rental Prices percentage change over 12 months, Wales and Great Britain, January 2012 to December 2018
Image .csv .xlsThe distribution of household income bands in Wales over the period FYE 2014 to FYE 2016 (using FRS data) finds that highest proportion of private renters (20%) fell in the £10,001 to £15,000 band (Figure 24), while social renters were even more likely to fall into the £10,001 to £15,000 band (31%). For those who own outright incomes were more evenly distributed across the £10,000 to £40,000 plus income ranges. Those buying with a mortgage were more likely to earn over £40,000 (35%).
Figure 24: Household income band by tenure (FYE 2014 to FYE 2016), Wales
Source: Family Resources Survey, Department for Work and Pensions
Download this chart Figure 24: Household income band by tenure (FYE 2014 to FYE 2016), Wales
Image .csv .xlsJust over a quarter (27%) of private rented sector households were in the lowest income quintile for Wales, compared with 29% in the social rented sector, 23% for those who owned outright and 6% of those who owned with a mortgage.
Data from the National Survey for Wales FYE 2018, found that 22% of private renters received housing benefit, whereas for social housing renters this was 57%.
For the three-year period FYE 2015 to FYE 2017, 42% of privately rented households were in relative income poverty (household income below 60% of the UK median household income after housing costs are paid), compared with 48% in the social rented sector and 13% of owner occupiers (Households below average income data).
Northern Ireland
Family Resource Survey (FRS) data shows that in FYE 2017, median household weekly rent payments in the private rented sector for Northern Ireland (NI) were £97, in contrast to £77 in the social rented sector, and £110 for owner occupiers’ mortgage repayments. Mean weekly rent in the 2016 Private Tenant Survey (PTS) (PDF, 537KB) was £106 (up from £99 in 2012). According to the Performance of the Private Rental Market (PPRM) report 2017 (PDF, 465KB), average monthly rent across NI was £598 in latter half of 2017, a 0.5% increase on the previous half of the year (£595), and a 3.3% increase on the latter half of 2016 (£579). Over the full year, average rents rose by 4.4% in 2017 (£596) compared with 2016 (£571).
Private rental growth in Northern Ireland has historically been weaker than the UK but has strengthened since the end of 2017.
Figure 25: Index of Private Housing Rental Prices percentage change over 12 months, January 2016 to October 2018, UK and Northern Ireland
Source: Index of Private Housing Rental Prices, Office for National Statistics
Notes:
- IPHRP is an experimental index tracking prices paid for renting property from private landlords in the UK.
- Northern Ireland annual growth is only available from January 2016.
Download this chart Figure 25: Index of Private Housing Rental Prices percentage change over 12 months, January 2016 to October 2018, UK and Northern Ireland
Image .csv .xlsThe 2016 Northern Ireland House Condition Survey (NIHCS) reports that within the private rented tenants (and “others”) category, most private renters were in the £10,400 to £15,599 annual salary income band (29%), and the least were in the £46,800 or more income band (5%). Meanwhile social renters were predominantly in the lower two income categories (up to £15,599, 75%), and owner occupiers were more likely to be in the higher income categories (22% earning £20,800 to £31,199 and 19% earning £31,200 to £46,799). More owner occupiers were in the higher income bands, with social housing tenants showing the opposite trend. See Figure 26 for a further breakdown by income band.
A quarter of all households with an annual income of up to £10,399 were in the private rental sector, alongside just under a quarter (24%) of all households with an annual income of £15,600 to £20,799.
Figure 26: Household income band by tenure, 2016, Northern Ireland
Source: Northern Ireland House Condition Survey, Northern Ireland Housing Executive
Download this chart Figure 26: Household income band by tenure, 2016, Northern Ireland
Image .csv .xlsNI Housing Rights published a research briefing on affordability in the private rented sector in 2016 (PDF, 252KB), which demonstrated that low income households are motivated to rent privately due to location, less segregation, availability of fully furnished properties, and social housing stigma.
The NIHCS showed 42% of private rented households received housing benefit in 2016, broadly unchanged from 2011 (43%). This represents approximately 53,000 households in 2011 and around 57,000 in 2016.
Back to table of contents5. Household flows between tenure sectors
This section focuses on the time spent living in the private rented sector and the flows between the private rented sector, owner-occupied sector and social housing sector. Most of the data in this section comes from national surveys such as the English Housing Survey, Scottish Household Survey, National Survey for Wales and the Northern Ireland Private Tenants survey. Differences in survey design and context may affect comparability.
UK
According to the Family Resource Survey (FRS), sixty two percent of households in the private rented sector spent under three years in the same accommodation and only a small proportion (4%) had been in the same residence for more than 20 years (Figure 27).
Figure 27: Length of residency of head of household in private rented sector, FYE 2017, UK
Source: Family Resources Survey, Department for Work and Pensions
Download this chart Figure 27: Length of residency of head of household in private rented sector, FYE 2017, UK
Image .csv .xlsComparing across nations, 32% of private rented sector households in Scotland had been in their accommodation for less than 12 months, compared with 28% in Wales, 26% in England and 25% in Northern Ireland.
Households in the private rented sector in England and Scotland remained in their accommodation for an average (mean) of four years, compared to an average of five years for Wales and Northern Ireland.
England
Private renters have lived at their current address for an average (mean) of 3.9 years. The majority (90%) of household reference persons (HRP) in the private rented sector have been resident in their home for less than 10 years, and one-quarter (25%) have lived in their home for less than a year (Figure 28). This has fallen from five years ago where nearly one-third had lived at their current address for less than a year. In financial year ending (FYE) 2017, half (50%) of private renters had lived in the private rented sector for less than five years while 24% had been in the sector for five to nine years and 27% for 10 or more years.
Figure 28: Length of residence (years) of household reference person by tenure, FYE 2017, England
Source: English Housing Survey, Ministry of Housing, Communities, and Local Government
Download this chart Figure 28: Length of residence (years) of household reference person by tenure, FYE 2017, England
Image .csv .xlsThe average length of residence for tenants at their current address in the private rented sector differs according to age. Younger people (aged 16 to 24 years) have stayed in their current residence for a shorter amount of time, an average of 9.6 months. Older people (aged 75 years and over) on the other hand are more likely to have lived at their current private rented accommodation for an average of 17 years (Figure 29).
Figure 29: Length of residence in current home by age in private rented sector, FYE 2017, England
Source: English Housing Survey, Ministry of Housing, Communities, and Local Government
Download this chart Figure 29: Length of residence in current home by age in private rented sector, FYE 2017, England
Image .csv .xlsThere is greater churn within the private rented sector (that is, moving from one privately rented home to another) than between sectors (Figure 30). Over the past 10 years, movers within the private rented sector increased from 532,000 households in FYE 2007 to 860,000 in FYE 2017, an increase of 62%. Some of this increase may be due to an increase in the overall number of households in England which increased 6% between 2007 and 2017 from 21.3 million to 22.7 million.
In 2016 to 2017 there were 179,000 moves into the sector, of which 80% (143,000) were from owner occupation. Movement from owner-occupied housing to the private rented sector has been gradually decreasing over the past 10 years, falling from 177,000 households in 2006 to 2007. There were 266,000 moves out of the sector, with 68% (182,000) of these moving to owner-occupied accommodation.
Figure 30: Trends in previous tenure for movers within the private rented sector, FYE 2007 to FYE 2017, England
Source: English Housing Survey, Ministry of Housing, Communities, and Local Government
Download this chart Figure 30: Trends in previous tenure for movers within the private rented sector, FYE 2007 to FYE 2017, England
Image .csv .xlsOut of all private renters who have moved from a private rented home in the past year, the main reasons for moving were job-related reasons (16%) and wanting a larger house or flat (13%).
Young people (aged 16 to 24 years) were most likely to move for job related reasons or for neighbourhood related reasons (15% and 11% respectively), whereas those between 45 and 65 years were most likely to move because the landlord gave notice (16%), or because of divorce or separation (13%). For those with dependent children, the most prominent reason for moving was because the landlord gave notice (13%), followed by job-related reasons (11%).
Scotland
In 2017, over one-third (35%) of adults in private rented properties had lived at their current address for less than a year (Figure 31), equating to a total of 220,000 adults. More than half (55%) of these had moved from another private rented household, and 24% moved from a parental-family home, with lower proportions having moved from buying with a mortgage (8%), owning outright (5%), renting from a local authority (3%), renting from a housing association (2%), or being in another tenure (3%).
A further 32% of adults in the private rented sector had lived at their current address for one to two years with only 6% of private renters having lived at their current address for over 10 years.
In 2017, 6% of adults in owner occupier properties had lived at their address for less than one year, with around one-quarter of these coming from the private rented sector (26%). Approximately one in ten of social renters (9%) had lived at their current address for less than one year, with 22% of these having moved from the private rented sector.
Figure 31: Length of time at current address by tenure, Scotland
Source: Scottish Household Survey, Scottish Government
Download this chart Figure 31: Length of time at current address by tenure, Scotland
Image .csv .xlsAdults in households in the private rented sector spent the shortest time at their current address with an average (mean) of three years, which compares with 16 years for owner occupiers and 11 years for the social rented sector. The average length of time at current address for adults in private rented households shows a slight decrease between 1999 and 2017, however this is likely to reflect the change in the composition of the sector in terms of the growth in the number of properties in urban areas; households that generally have shorter lengths of stay on average compared with properties in small towns or rural areas. The average length of stay for adults living in private rented households in urban areas has been relatively steady between 1999 and 2017, with averages of two years being seen for most years.
Under one-third of households (30%) in the private rented sector don’t expect to move, while more than half (55%) expected to move within the next five years, higher than other tenures (Figure 32). In the owner occupier sector, 13% expect to move in the next five years and 16% of social renters expect to move in the next five years.
Figure 32: When private rented sector householders expect to move, Scotland
Source: Scottish Household Survey, Scottish Government
Download this chart Figure 32: When private rented sector householders expect to move, Scotland
Image .csv .xlsAround 10% of private rented households stated they were on a housing list for social sector housing and of these over half (56%) had been on a housing list for three years or fewer. A tenth had been on a housing list for more than 10 years. For the 10% of private rented households on a housing list, the main reason stated was because they could not afford current housing or would like cheaper housing (27%) (Scottish Household Survey 2017).
Wales
A third of those in the private rented sector have lived in their current address for fewer than 12 months (33%), while 7% have lived at their address for more than 10 years (Figure 33). Most of those in the owner-occupied sector have lived at their address for over 10 years (65%), with 5% living there fewer than 12 months. The social rented sector followed a similar pattern; whereby the highest share spent over a decade in their present accommodation (43%), while 10% had lived there under 12 months.
Figure 33: Length of residence at current address by tenure, Wales
Source: National Survey for Wales, Welsh Government
Download this chart Figure 33: Length of residence at current address by tenure, Wales
Image .csv .xlsThe 2014 to 2015 National Survey for Wales found that 57% of private renters came from rented accommodation previously. One-tenth owned their previous property on their own or jointly, and 2% came from a property owned by their partner. In the social housing sector nearly three-fifths (59%) rented privately previously.
Northern Ireland
The Private Tenants Survey (PTS) 2016 reports that 69% of private tenants moved into their current accommodation less than five years ago. Two-thirds (66%) of private tenants who had moved within the last five years were previously in private rented accommodation (up from 49% in 2006), 20% lived with family, 7% had a mortgage and 2% owned a property outright (Figure 34). Five percent moved from social rented housing (down from 14% in 2006). The most common reason for those who left behind a mortgage or owned property was that their previous partner lives there (44%).
Figure 34: Previous accommodation of private rented households, Northern Ireland
Source: Northern Ireland Private Tenants Survey 2016, Northern Ireland Housing Executive
Download this chart Figure 34: Previous accommodation of private rented households, Northern Ireland
Image .csv .xlsOf those who had moved within the past five years, the most common reason for private tenants leaving their previous home was wanting a larger property (13%), because their home was in a bad state of repair (11%), or they wanted to set up a home of their own (10%).
Ninety-one percent of private rented households expected to be able to stay in their property for as long as they wanted in 2012, this fell to 83% in 2016. The majority (86%) described their relationship with their landlord or letting agent as on good terms, with 4% on poor terms.
Regarding future intentions, the majority (64%) intended to stay in the private rented sector for the next five years, three-fifths of these (80%) intended to stay in their current property for the next five years. Of the 25% of households that did not intend or did not know whether they intended to stay in the private rented sector, 56% intended to buy their own home in the next five years, with 41% of these hoping to buy in between one and three years’ time.
Back to table of contents6. Characteristics and quality of dwellings
The condition and quality of dwellings are covered within national housing condition surveys. Housing standards are not assessed in the same way across the four countries and so many measures are not directly comparable. However, it is possible to compare some characteristics such as age, dwelling type, energy efficiency rating band and hazards to an extent. Some national standards which differ are summarised below;
England
Dwelling condition is examined using housing quality indicators such as the Decent Homes Standard (DHS) and evaluating damp and disrepair. Their safety is assessed using the Housing Health and Safety Rating System (HHSRS), electrical safety, working smoke alarms and carbon monoxide detectors. For a home to be classed as decent according to the DHS it must meet the statutory minimum standard for housing, provide a reasonable degree of thermal comfort (related to effective insulation and heating efficiency), be in a reasonable state of repair (fails if one or more key building components need replacing), and have reasonably modern facilities and services (based on factors such as age of kitchen, bathroom and so on).
Scotland
Scotland – the tolerable standard is a minimum standard for habitability introduced in the 1969 Housing (Scotland) Act, and later updated. The definition of tolerable includes characteristics such as the dwelling being structurally stable and free from damp, and having provision for lighting, ventilation and heating, electrical installations that are adequate and safe, and satisfactory insulation.
Private landlords are also required to comply with The Repairing Standard, whereby the property: must be wind and water-tight and fit for people to live in; structure and exterior must be in a reasonable state of repair and proper working order; installations for water, gas, electricity, sanitation, space heating and heating water must be in a reasonable state of repair and proper working order; furnishings provided by landlord must be capable of being used safely for their designated purpose; must have a satisfactory fire detection and warning in the event of a fire; and must have satisfactory provision for giving warning if carbon monoxide is present in a concentration hazardous to health. The Repairing Standard has a degree of overlap with elements that are required under the tolerable standard.
The Scottish Housing Quality Standard (SHQS) was introduced in 2004, and is one of the main ways that housing quality is measured in Scotland. Under the SHQS, Social landlords must make sure that their tenants' homes are in a good state of repair, energy efficient, healthy, safe and secure. Private owners and private landlords are currently under no obligation to bring their properties up to this standard. However the data is collected across all dwellings to allow comparison across the whole housing stock. It comprises 55 elements across these five areas and failure on just one of these 55 elements is enough to fail the entire standard.
Wales
There is no explicit tolerable standard for private rented homes as there is for social housing (Welsh Housing Quality Standard (WHQS)), but local authorities, under the Housing Act 2004, can assess housing conditions and improvement works as required under HHSRS. Dwelling condition is examined in this article using the WHCS for privately rented properties, which focuses predominantly on the HHSRS and Category 1 hazards.
Northern Ireland
To meet the Decent Homes Standard applicable to Northern Ireland, a dwelling must: meet the current minimum fitness standard for housing, be in a reasonable stage of repair, have reasonable modern facilities and services, and provide a reasonable degree of thermal comfort.
NI Decent Homes Standard are not comparable with that of England and Wales due to the different fitness standard applied.
UK
For comparisons across countries, 2016 surveys were used for England, Scotland, and Northern Ireland as this was the most recent data available for England and Northern Ireland and this year was available for Scotland. For Wales, the 2017 to 2018 Welsh Housing Conditions Survey was used as the data required for the comparisons were not collected in previous years.
Northern Ireland’s private rented sector has the newest dwelling stock in the UK with that built post-1980 at 38%, compared with 24% for Scotland and Wales and 25% for England. The oldest dwelling stock was in Wales with 43% built pre-1919 compared with 39% in Scotland, 35% in England and 12% in Northern Ireland (Figure 35).
Figure 35: Age of dwellings in the private rented sector, countries of the UK
Source: English Housing Survey financial year ending 2017, Ministry of Housing, Communities, and Local Government; Scottish House Condition Survey 2016, Scottish Government; Welsh Housing Conditions Survey 2017 to 2018, Welsh Government; Northern Ireland House Condition Survey 2016, Northern Ireland Housing Executive
Notes:
- Scotland figures relate to 1965 to 1982 and post-1982
Download this chart Figure 35: Age of dwellings in the private rented sector, countries of the UK
Image .csv .xlsRegarding types of dwelling, terraced houses made up the highest proportion of private rented sector dwellings for England (36%), Wales (47%) and Northern Ireland (44%), with detached houses being the lowest (6% in England; and 8% in Wales and Northern Ireland). The highest proportion of private rented dwellings in Scotland were flats (63%), with the lowest proportion being semi-detached houses (10%). It is important to note, however, that bungalows are not accounted for separately for Scotland data and so are recorded in the house categories.
Figure 36: Type of dwellings in the private rented sector for England, Scotland, Wales and Northern Ireland
Source: English Housing Survey financial year ending 2017, Ministry of Housing, Communities and Local Government; Scottish House Condition Survey 2016, Scottish Government; Welsh Housing Conditions Survey 2017 to 2018, Welsh Government; Northern Ireland House Condition Survey 2016, Northern Ireland Housing Executive
Notes:
- Bungalow numbers for Wales too low to estimate so percentages do not add up to 100.
- Bungalows cannot be separately identified for Scotland data and so these are included in the other house sub-categories.
Download this chart Figure 36: Type of dwellings in the private rented sector for England, Scotland, Wales and Northern Ireland
Image .csv .xlsStandard Assessment Procedure (SAP) is the approach used by the government to assess and compare the energy and environmental performance of dwellings. SAP ratings are divided into bands A to G. These are the bands used for Energy Performance Certificates (EPC). The highest values (that is, the highest levels of energy efficiency) are assigned to Band A and the lowest values are assigned to band G.
Northern Ireland had the highest percentage of dwellings within the A to C energy efficiency rating bands (43%), followed by Scotland (38%). England and Wales had the highest proportion of private rented dwellings in band D (49% and 54% respectively), according to SAP 2012. Very few (7% to 8%) were in the F to G bands for England, Scotland and Wales, with 1% of Northern Ireland’s private rented dwellings falling into these categories (Figure 37).Some caution is advised when interpreting estimates for Wales due to smaller sample sizes. Mean SAP 2012 rating in the private rented sector in England was 60.3, which was the same for Wales, while Scotland was slightly higher at 61.5 and Northern Ireland higher again at 65.3.
The differences in energy efficiency between the UK nations could be attributed, at least in part, to the age and or type of the dwelling stock, along with improvements to building standards over time: Wales has the oldest stock and the joint lowest average SAP rating; Northern Ireland has the newest stock and the highest average SAP rating.
Figure 37: Energy efficiency rating bands in the private rented sector for countries of the UK, 2016 to 2018
Source: English Housing Survey financial year ending 2017, Ministry of Housing, Communities, and Local Government; Scottish House Condition Survey 2016, Scottish Government; Welsh Housing Conditions Survey 2017 to 2018, Welsh Government; Northern Ireland House Condition Survey 2016, Northern Ireland Housing Executive
Download this chart Figure 37: Energy efficiency rating bands in the private rented sector for countries of the UK, 2016 to 2018
Image .csv .xlsThe Housing Health and Safety Rating System (HHSRS) is a risk-based evaluation tool to help local authorities identify and protect against potential risks and hazards to health and safety from any deficiencies identified in dwellings. It is used to determine whether residential premises are safe to live in, or whether a hazard exists that may cause harm to the health and safety of a potential occupant.
The System assesses 29 types of housing hazard and provides a rating for each one. Those which score highly on the scale (and are therefore the greatest risk) are called Category 1 hazards – if, after a local authority inspection, a dwelling contains a Category 1 hazard the local authority has a duty to take the appropriate enforcement action. Those that fall lower down the scale and pose a lesser risk are called Category 2 hazards.
In 2016, 85% of England’s private rented dwellings were free from Category 1 hazards compared with 76% for Wales. Although HHSRS is not formally adopted in Northern Ireland, in 2016, 91% of all dwellings were free from Category 1 hazards. Scotland does not have a comparable measure to HHSRS Category 1 hazards, although other measures of disrepair and quality are collected and monitored on, as covered in the Scotland section.
England
The highest portion of private rented sector dwellings were built prior to 1919 (35% or 1.7 million dwellings) while a quarter (25% or 1.2 million dwellings) of private rented sector homes were built after 1980. Compared with other tenures, private rented stock tends to be older, with 21% of owner occupier homes built before 1919 and 7% of social rented homes (4% local authority and 8% housing association).
Figure 38: Age of dwelling by tenure, financial year ending 2017, England
Source: English Housing Survey, Ministry of Housing, Communities, and Local Government
Download this chart Figure 38: Age of dwelling by tenure, financial year ending 2017, England
Image .csv .xlsIn financial year ending (FYE) 2017, flats were the most prevalent dwelling type in the private rented sector (37%). The proportion of purpose built, low rise flats (where the building is only a few stories tall and shorter than a high rise which is usually over 35 metres tall) in the private rented sector increased from 17% in 1996 to 23% in FYE 2017. Alongside the rise in newly built flats in the sector, there has been a drop in the proportion of converted flats (house or other large building which has been converted into flats), from 19% in 1996 to 11% in FYE 2017 (although the number of converted flats increased from 382,000 to 539,000 over this period). Semi-detached houses were most prevalent in the owner-occupied sector (31%), with high rise purpose-built flats the least common (1%). Purpose built low rise flats were the most widespread dwelling type in the housing association and local authority sectors (both 38%), with detached houses the least common (1% and less than 1% respectively).
Figure 39: Dwelling type by tenure, financial year ending 2017, England
Source: English Housing Survey, Ministry of Housing, Communities, and Local Government
Download this chart Figure 39: Dwelling type by tenure, financial year ending 2017, England
Image .csv .xlsFrom financial year ending (FYE) 2007 to FYE 2017, the percentage of non-decent homes fell across all the tenures. In the private rented sector, nearly half were non-decent in (FYE) 2007, which fell to 27% in FYE 2017. The private rented sector had the highest proportion of non-decent homes in FYE 2017 (27%), while owner-occupied and social rented stood at 20% and 13%.
Figure 40: Non-decent homes, by tenure, 2006 to financial year ending 2017, England
Source: English Housing Survey, Ministry of Housing, Communities, and Local Government
Download this chart Figure 40: Non-decent homes, by tenure, 2006 to financial year ending 2017, England
Image .csv .xlsBased on surveyor assessment, between 1996 and FYE 2017 there has been a decrease in the occurrence of damp in all tenures, but this was particularly notable in the private rented sector where the prevalence of damp fell from 26% to 8%. In FYE 2017, owner-occupied dwellings had lowest levels of damp at 2%, and social rented households stood at 6% for local authority and 4% for housing association properties in FYE 2017.
Disrepair, measured as basic repair costs in square metres (pounds per metre squared) fell between 1996 and FYE 2017 in the private rented sector from £69 per metre squared to £24 per metre squared. Despite this, levels of disrepair are still highest for the private rented stock compared to other tenures.
In FYE 2017, the average SAP 2012 rating of private rented accommodation was 60.3, similar to owner-occupied homes (60.7), but lower than social rented homes which were more energy efficient (67.3). This could be due to the private rented sector having an “older” housing stock which are normally less well insulated.
There has been a decrease in the proportion of private rented homes with the poorest energy efficiency since 1996, partly reflecting the growth of newer homes in the stock (Figure 41). In 1996, 39% of private rented homes were in energy efficiency ratio (EER) bands F or G, falling to 25% in (FYE) 2007 and falling again to 7% in FYE 2017. Since 1 April 2018 there has been a requirement for private rented homes to have a minimum energy performance rating of band E, which applies to most but not all domestic private rented sector properties in England and Wales (Department for Business, Energy, and Industrial Strategy). These regulations will be enforced by local authorities.
At the other end of the scale, in FYE 2017, around a quarter of private rented homes (27% or 1.3 million) had the highest EER bands of A to C, a similar proportion to owner-occupied homes (25%), but a much lower proportion compared with social rented homes (51%; Figure 42).
Figure 41: Energy efficiency ratio band for the private rented dwellings in England, 1996 to 2016
Source: 1996 and 2006: English House Condition Survey, Ministry of Housing, Communities, and Local Government, 2016: English Housing Survey, Ministry of Housing, Communities, and Local Government
Download this chart Figure 41: Energy efficiency ratio band for the private rented dwellings in England, 1996 to 2016
Image .csv .xls
Figure 42: Energy efficiency ratio band by tenure, financial year ending 2017, England
Source: English Housing Survey, Ministry of Housing, Communities, and Local Government
Download this chart Figure 42: Energy efficiency ratio band by tenure, financial year ending 2017, England
Image .csv .xlsScotland
Dwellings built pre-1919 are the most prevalent in the private rented sector, accounting for 41% of all dwellings (Figure 43). Newer builds, those built after 1982, account for 24% of private sector dwellings (Scottish House Condition Survey (SHCS), 2017).
In comparison, 20% of owner-occupied dwellings were built pre-1919 and 5% of social rented dwellings.
Figure 43: Age of dwelling by tenure, Scotland, 2017
Source: Scottish House Condition Survey additional analysis, Scottish Government
Download this chart Figure 43: Age of dwelling by tenure, Scotland, 2017
Image .csv .xlsMost tenants in the private rented sector live in a tenement or flat (61%), similar to the social rented sector (57%). Fifty-eight per cent (unrounded figure) of owner-occupiers live in detached or semi-detached houses, with just over one-fifth (22%) in flat (Figure 44).
Figure 44: Type of dwelling by tenure, Scotland, 2017
Source: Scottish House Condition Survey additional analysis, Scottish Government
Download this chart Figure 44: Type of dwelling by tenure, Scotland, 2017
Image .csv .xlsThe majority (79%) of private rented sector households are located in large urban areas or other urban areas. The rest reside in accessible or remote small towns, and accessible or remote rural locations. The growth of the private rented sector between 1999 and 2017 has largely been concentrated in urban areas. The increase in the private rented sector in these areas has equated to an increase of 200,000 households, from 80,000 households in 1999 to 280,000 households in 2017. This equates to nearly four-fifths (79%) of privately rented households living in urban areas in 2017 (Scottish Household Survey).
The SHCS uses four categories to measure disrepair (any or basic, extensive, urgent and critical element) for a range of building elements. In 2017, 59% of private rented dwellings had some degree of disrepair to critical elements, a figure higher than the owner-occupied sector (46%); the apparent difference with the social rented sector (53%) is within the survey’s margin of error (Figure 45).
It is important to recognise that, while critical elements refer to building elements central to weather-tightness, structural stability and preventing deterioration of the property, the level of disrepair to these elements can be at a relatively low level. In 2017, despite some disrepair to critical elements being fairly common, where disrepair to a critical element was present, on average no more than 2.5% of the relevant area was affected. Only 3% of dwellings in the private rented sector had disrepair which was critical, urgent (requiring immediate repair to prevent further damage or health and safety risk) and extensive (covering at least a fifth of the building element area), similar to higher than the Scottish average (1%).
Figure 45: Disrepair to critical elements, urgent and extensive disrepair by tenure, 2017, Scotland
Source: Scottish House Condition Survey, Scottish Government
Download this chart Figure 45: Disrepair to critical elements, urgent and extensive disrepair by tenure, 2017, Scotland
Image .csv .xlsIn the private rented sector, the percentage of houses below the tolerable standard set by Scottish Government was estimated to be 2%, similar to the 1% in the owner-occupied sector and around 0% in the social rented sector. For the private rented sector this is an improvement from 2010 where this was 8% (Figure 47). Across all tenures, older dwellings are more likely to be below the tolerable standard.
Figure 46: Proportion of dwellings below tolerable standard by tenure, 2010 to 2017, Scotland
Source: Scottish House Condition Survey, Scottish Government
Download this chart Figure 46: Proportion of dwellings below tolerable standard by tenure, 2010 to 2017, Scotland
Image .csv .xlsIn 2017, 48% of houses in the private rented sector failed to meet the SHQS, perhaps because private landlords are under no obligation to bring their properties up to this standard (Figure 47). This figure is an improvement from 63% in 2010. These levels are slightly higher than those in the owner-occupied (40%) and social rented (37%) sectors in 2017. All sectors were at similar levels in 2010 (59% for owner-occupied and 61% for social rented).
Figure 47: Proportion of dwellings failing SHQS across all tenures, 2010- to 2017, Scotland
Source: Scottish House Condition Survey, Scottish Government
Download this chart Figure 47: Proportion of dwellings failing SHQS across all tenures, 2010- to 2017, Scotland
Image .csv .xlsIn 2017, 39% of dwellings in the private rented sector had an energy efficiency rating in band B or C or better, while 10% of dwellings were in band F or G (the sample size for band A being too small to be robust for all tenures), based on SAP 2012. Similarly, 37% of owner-occupied dwellings were in band B or C, with 5% falling in F or G. The social rented sector had the highest EER distribution, with 55% in bands B and C, and only 1% in band F (the band G sample was too small to calculate). The mean SAP 2012 rating in the private rented sector was 61.6, 69.7 in housing association dwellings, 66.6 in local authority or other dwellings, 61.8 in owned outright and 65.3 in mortgaged dwellings.
Figure 48: Energy efficiency rating band by tenure (SAP 2012), Scotland, 2017
Source: Scottish House Condition Survey, Scottish Government
Notes:
- A band sample size is too small for calculation.
Download this chart Figure 48: Energy efficiency rating band by tenure (SAP 2012), Scotland, 2017
Image .csv .xlsWales
There has been a long-term improvement in the energy efficiency of private rented dwellings since 2010. In 2017, the share of dwellings in the highest energy efficiency bands (B and C) under SAP 2009 was 40%, an increase of 10 percentage points from 29% in 2010. Similarly, there has been a long-term reduction in the proportion of private rented dwellings in the least efficient EPC bands F and G.
The dwelling stock in Wales is the oldest of the UK, with over a quarter of all dwellings built prior to 1919 (Welsh House Conditions Survey (WHCS) 2017 to 18). By tenure, the private rented sector has the largest proportion of pre-1919 dwellings (43% of all private rented dwellings), compared with 29% for owner occupiers and 7% for social housing (Figure 49). Twenty four percent of private rented and owner-occupied dwellings were built after 1980, alongside 28% of social rented dwellings.
Figure 49: Age of dwelling by tenure, Wales, 2017 to 2018
Source: Welsh House Conditions Survey, Welsh Government
Download this chart Figure 49: Age of dwelling by tenure, Wales, 2017 to 2018
Image .csv .xlsTerraced properties are the most prevalent property type in the private rented sector, accounting for nearly half (47%) of all dwellings, compared with around a quarter of dwellings in the owner-occupied (24%) and social housing sector (28%). Just over one-fifth of all dwellings within the private rented sector in Wales were flats (22%) (Figure 50). Only 8% of private rented dwellings were detached houses, compared with nearly one-third (30%) in the owner-occupied sector. This sample was too small to estimate percentage in the social rented sector.
Figure 50: Type of dwelling by tenure, Wales, 2017 to 2018
Source: Welsh Housing Conditions Survey, Welsh Government
Notes:
- Private rented bungalows and social housing detached houses not included as these figures were not robust enough due to sample size.
Download this chart Figure 50: Type of dwelling by tenure, Wales, 2017 to 2018
Image .csv .xlsIn 2017 to 2018, damp or condensation problems in one or more rooms existed in 13% of private rented dwellings, compared with 6% of owner-occupied and 5% of social rented dwellings (WHCS).
In regard to energy efficiency, over half of private rented dwellings were in band D (54%), with just under one-quarter in band C (24%) and only 7% in band F. Showing a similar pattern, over half of owner-occupied dwellings were in band D (52%), with 23% in band C and only 6% in band F. Social rented dwelling stock has the highest EERs out of all tenures, with almost half being in band C (49%), and slightly less in band D (46%). The average (mean) SAP rating for private rented dwellings was 60.3; this was 60.2 for owner-occupied and 67.6 for social rented dwellings.
Figure 51: EER band by tenure (SAP 2012), Wales, 2017 to 2018
Source: Welsh Housing Conditions Survey, Welsh Government
Notes:
- Percentages do not add up to 100 in each tenure due to sample sizes being too small in some categories. A, B and G bands not included due to sample size issues.
Download this chart Figure 51: EER band by tenure (SAP 2012), Wales, 2017 to 2018
Image .csv .xlsPrivate rented dwellings were most likely to have one or more Category 1 hazards (according to the HHSRS), at just under a quarter (24%) compared with 19% of owner-occupied dwellings and 7% of social rented dwellings, although the difference between private rented and owner-occupied was not statistically significant. All tenures showed an improvement on 2008, with private rented showing the greatest improvement (from 60% to 76% being free from Category 1 hazards). It should be noted that only 16 of the 29 hazards were assessed in 2008, whilst 26 were assessed in 2017 to 2018.
Northern Ireland
In Northern Ireland (NI), 12% of privately rented dwellings (or 17,000) were built before 1919 (Figure 52). Thirty eight percent (81,000) of private rented dwellings were built post-1980, this is a similar proportion of dwellings to the owner-occupied sector (42%) and the social housing sector (41%).
Figure 52: Dwelling age by tenure, Northern Ireland, 2016
Source: Northern Ireland House Condition Survey, Northern Ireland Housing Executive
Download this chart Figure 52: Dwelling age by tenure, Northern Ireland, 2016
Image .csv .xlsBy tenure, in 2016 there were 136,000 dwellings in the private rented sector, compared with 495,000 in the owner-occupied sector and 121,000 in the social housing sector. (Northern Ireland House Condition Survey 2016 (NIHCS)).
The most common dwelling type in the private rented sector is terraced houses, accounting for 44% of the stock, with detached houses being the least common in this sector (8%). In the owner-occupied sector detached properties account for 30% with very few flats or apartments (3%).
Social rented dwellings are mostly terraced houses (46%), similarly to the private rented sector.
Two-thirds (66%) of private rented dwellings are in urban areas, slightly higher than the owner-occupied sector (60%), but lower than the social housing sector (84%).
The NIHCS measures the level of unfitness of a house by assessing it against the statutory fitness standard (Figure 53), which is one component of the decent homes standard for NI. Two per cent of the dwelling stock in the private rented sector failed the statutory fitness standard in 2016. The majority (94%) of private rented homes were satisfactory or acceptable, slightly lower compared with the owner-occupied (95%) and social sectors (97%).
Figure 53: Private rented sector, unfitness, Northern Ireland, 2016
Source: Northern Ireland House Condition Survey, Northern Ireland Housing Executive
Notes:
- Figures rounded to add up to 100%.
Download this chart Figure 53: Private rented sector, unfitness, Northern Ireland, 2016
Image .csv .xlsThe NIHCS estimates that 89% of private rented housing met the Decent Homes Standards. This was lower in comparison with the social housing sector (97%) and owner-occupied sector (94%).
The NIHCS describes fabric disrepair as at least one fault in the dwelling. In the private rented sector 51% of dwellings had no faults in 2016. This was lower than the owner-occupied sector (61%) and similar to the social housing sector (50%). The urgent and basic repair costs were similar for private renters (£553 and £852 respectively) and owner occupiers (£595 and £886 respectively), and lower for social renters (£278 and £413 respectively).
Energy efficiency of dwellings, as measured by EERs, was similar in the private rented sector and owner-occupied sector, with 43% and 45% of each sector in Bands A to C respectively. Social rented dwellings, however, were more energy efficient overall, with 79% of this tenure sitting in the top Bands A to C (Figure 55). Mean SAP score for private renters was 65.3, similar to 65.1 for owner occupiers, while this was higher at 72.6 for social renters. Comparatively, the overall SAP score across all sectors (including vacant) was 65.8
Figure 54: Energy efficiency rating band by tenure (SAP 2012), Northern Ireland, 2016
Source: Northern Ireland House Condition Survey, Northern Ireland Housing Executive
Download this chart Figure 54: Energy efficiency rating band by tenure (SAP 2012), Northern Ireland, 2016
Image .csv .xls7. Improving statistics on the private rented sector
Over recent years, departments and organisations responsible for the publication of the statistics in the private rented sector (PRS) have informally gathered feedback from those who use the data. This has been supplemented by more formal user feedback exercises as recently carried out by Office for Statistical Regulation (OSR). This feedback has built a picture of what the current limitations of PRS Statistics are and what gaps in the statistics need addressing. The purpose of this section is to draw on this feedback and provide a summary of what the main limitations are and what is being done (or has been done) to address these.
Summary of findings
In reviewing the various sources of feedback for the PRS, comments typically fell into one of the following categories: granularity of price data, understanding the PRS, coherence and comparability, and the tenants in the PRS. There was a clear underlying theme from users that the measurement of the price of private rector rents needs addressing as a priority.
Granularity of price data
User engagement exercises by the Valuation Office Agency (VOA) and the OSR found a clear user need for more granularity in the current statistics covering the PRS. The main sources of PRS price data are:
the Private Rental Market Statistics (PRMS) release published by the VOA for England
Wales Private Sector Rents published by the Welsh Government
Scotland Private sector rents statistics published by the Scottish Government
Performance of the Private Rental Market in Northern Ireland published by Northern Ireland Housing Executive
The Index of Private Housing Rental Prices (IPHRP) published by Office for National Statistics (ONS) measures the change in price tenants face when renting residential property from private landlords. Whilst users welcomed the availability of these statistics, there are limitations that they would like addressed. For example, there is no UK wide measure of PRS price currently produced, though the IPHRP does show changes in price at a UK level. There is a need to better measure price development in local rental markets lower than local authority level. On a similar note, users would like to see more detailed breakdowns of the rental market in the statistics, such as price by property type, number of rooms and so on for all geographies, so a better understanding can be built. There is a need for official statistics to distinguish between new and existing rents; this request is in reference to the IPHRP which is a stock-based measure of rental price inflation which users would like to see broken down into those rents that are newly advertised and those of existing rents. A further request from users is for departments and organisations, where possible, to provide access to the record level microdata used in the production of rental statistics.
Understanding the PRS
There is a gap in official statistics describing the stock and distribution of the private rented sector. For example, what does the stock of the UK private rented sector look like, and how has this changed over time? What types of property are being rented in the sector? Providing statistics to measure this sector is essential so users can understand what is happening both at the aggregate level and a level that will allow analysis of local housing markets. The census, annual dwelling stock estimates and house condition surveys are published for each country which do provide a broad overview of changes in levels of private renting, but more granularity is required. Users are aware that more data is slowly becoming available for the PRS, such as the data collected through the Tenancy Deposit Protection Schemes (TDPS) and there is an expectation that this will be used to improve the measurement of the sector in due course.
Coherence and comparability
Users expressed a difficulty in understanding how measures of price in the PRS, recorded in the PRMS and IPHRP, relate to each other and why there are notable differences. There is a need for transparency in the methods used to produce these statistics with sufficient explanation of the rationale for the differences between them (and when comparing these measures with the rental price statistics being produced by private sector companies). Additionally, users have requested a fully comparable time series for both price levels and the inflation measure, as currently the PRMS and rental price levels published by Wales, Scotland and Northern Ireland, are based on simple averages, which are influenced by changing compositions and should not be used to make comparison over time. This leads to confusion with IPHRP which adjusts for compositional change and is appropriate for growth calculations.
People in the PRS
Some of the feedback highlighted a need to understand more about those people in the PRS. For example, what are the motivations of both landlords and tenants in the PRS and what is their assessment of the quality of properties being rented? Users would also like more statistics covering the affordability of the PRS, although this was also needed in the context of the wider housing market.
Improving private rented sector (PRS) statistics
The guide to UK planning and housing statistics (XLSX, 43.7KB) highlights what statistics are available in the PRS, as well as the wider housing sector. However, as discussed above there are areas which need improvement. The formation of the Cross-Government Housing Statistics Group will help facilitate some of these necessary improvements. It already has a number of enhancements and is planning further developments to better meet user requirements.
Based on user feedback, the main area requiring improvement is the measurement of price data in the PRS, this necessitates a focus on the development of IPHRP and PRMS. As it stands, these two outputs are produced by different departments (ONS and VOA respectively) but using the same underlying source data for England, which is the comprehensive lettings data collected by VOA Rental Officers as part of their responsibilities to administer functions relating to Housing Benefit and Universal Credit. The VOA is an executive agency of HM Revenue and Customs and as such the data it holds are bound by taxpayer confidentiality as enforced by the Commissioners of Revenue and Customs Act (CRCA), ONS has been unable to access the record level microdata, so VOA process the data on behalf of ONS. Aggregate price indices are provided which are used in the compilation of IPHRP (note that ONS has access to record level data for Scotland, Wales and Northern Ireland, so produce these indices separately).
The Digital Economy Act 2017 now provides an effective legislative gateway for ONS to potentially access the rental microdata for England, which was previously constrained by the CRCA. Access to this data would provide an excellent opportunity for the further development of private rental prices based on the expertise and resource available within ONS for this work, and the unique access ONS has to other supplementary data that can be used to enrich the rental microdata.Therefore, ONS and VOA are looking at how ONS can be given access to the rental microdata. The potential provision of this data to ONS would enable several positive developments that would improve the measurement of price in the private rented sector, including:
safeguard and further develop the production of rental price indices that underpin the production of IPHRP, and which in turn would support data collection by rent officers for their statutory functions as well as official statistics uses
review and improve the production of IPHRP, including the production of more granular geographic breakdowns for areas of the UK in response to user requests and produce sub-local authority level estimates of rent prices by further developing the Research Output on Rent Price Statistics for Small Areas
add further value to the understanding of the private rental market, by carrying out more detailed research using the microdata to produce value added analysis
further developments to advance a better understanding of the stock of the private rented sector through improving the Research Outputs on subnational dwelling stock by tenure estimates using additional sources of admin data such as from Tenancy Deposit schemes
the analysis of micro rental data alongside sources such as the Tenancy Deposit Protection Scheme
in due course, allow ONS to develop the statistic to improve consistency between English PRMS and IPHRP, and a methodology to produce comparable measures of rental prices over time for the UK and improve the granularity and frequency of publications
The above, should the provision of data to ONS take place, will ultimately allow for a more comprehensive statistical picture of the PRS. However, until agreement on English record level data transfer from VOA to ONS has been finalised and implemented, both IPHRP and PRMS will continue to be published as-is by both bodies. Prior to this data transfer taking place, several interim improvements to the IPHRP and PRMS have been made. These include:
the IPHRP has recently expanded its coverage to include Northern Ireland data, providing a UK series for the first time
regular analysis is now published that reconciles the differences between IPHRP and PRMS (PDF, 445KB) (England)
further analysis also provides users with a better understanding of IPHRP and how it differs from other, private sector measures
both IPHRP and PRMS (PDF, 317KB) have published more detailed explanations of the methods used in production
Beyond the proposed improvement in price data for the PRS, work has been taking place to introduce improved estimates that will address some of the other limitations experienced by users. Most notably, looking at statistics to help understand the PRS, some new analysis will be published in early 2019 that makes use of Tenancy Deposit Protection Scheme data to provide subnational estimates of the stock of privately rented dwellings against which a secured deposit is held (England only). This new analysis will hopefully be supplemented by further administrative data in due course to provide a more complete picture of the PRS.
In Wales we are seeing the development of the Housing Stock Analytical Resource for Wales for Wales (HSAR). The aim of HSAR is to bring together a range of data on the characteristics, fabric, condition and energy efficiency of the housing stock in Wales across all tenures including the private rented sector. It will provide a continuous and robust anonymised evidence base, where possible at the individual property level. It will be used to inform housing and environment policy direction, particularly housing conditions and fuel poverty. HSAR will link administrative, survey and modelled data and will be used alongside the Welsh Housing Conditions Survey to provide improved modelling of data at a lower level of geography. In addition, it will provide more up-to-date data than that available from periodic housing conditions surveys. A progress report (PDF, 1.14MB) was published in September 2018.
Updates to existing private rented sector (PRS) releases
In terms of better measurement of the people and conditions in PRS, several updated statistics have been published recently that provide users with a better understanding of the quality of the PRS. For example, The Welsh Housing Conditions Survey (WHCS) 2017 to 2018 collected information about the condition and energy efficiency of all types of housing in Wales. This was the first Welsh survey of housing conditions since the Living in Wales Property Survey in 2008. The WHCS statistical first release was published on 6 December 2018 and provided an overview of the survey’s findings at a national level across all tenures including the private rented sector. It included data on housing stock and household characteristics, housing conditions, standard and the Housing Health and Safety Rating System. Detailed topic specific reports will follow from Spring 2019. Likewise, the Northern Ireland Housing Executive published the updated Northern Ireland House Condition Survey report in May 2018, for the reference year 2016 (having previously produced estimates for 2011). Similar statistics are also available for England via the English Housing Survey (EHS) and Scotland via the Scottish House Condition Survey.
Since 2014 to 2015, the Ministry of Housing, Communities and Local Government (MHCLG), who are responsible for publishing the EHS, have produced and published an annual report on the private rented sector using this data. The content of the report changes year on year following user consultation. The questionnaire content is also reviewed annually to ensure that the survey continues to capture the right information.
In Wales, following the commencement of Part 1 of the Housing (Wales Act) 2014, Rent Smart Wales was launched on 23 November 2015. They are the single licensing authority for Wales, representing all 22 local authorities, and are responsible for maintaining a register of all private landlords and their properties. They are responsible for issuing licences to landlords and agents who are involved in the letting and/or management of privately rented properties. They also lead on enforcing against landlords in breach of Part 1 of the Housing (Wales) Act 2014.
The register is available to search by property, landlord or agent name. A property search will tell you who the landlord of a property is, and who the nominated licensee for that property is (and their licence status). A search on a landlord or agent name will tell you their licence status. Searches are available online.
Rent Smart Wales publish monthly statistics. The main publication is the “Rent Smart Wales Statistics” which contains the latest numbers of landlords registered, landlords and agents licensed and properties registered. Other statistics are concerned with training delivered by Rent Smart Wales, and the performance of their call centre. They will soon be publishing numbers of prosecutions and fixed penalty notices issued, broken down by geographical area, on a monthly basis.
In December 2018, results from the English Private Landlord Survey (EPLS) were published by MHCLG. The EPLS is an online survey of almost 8,000 landlords and letting agents registered with one of the three government-backed Tenancy Deposit Protection (TDP) schemes. It aims to inform government understanding of the characteristics and experience of landlords and how they acquire, let, manage and maintain privately let property in England.
In Scotland, the annual Scottish Government Private sector rent statistics publication, based on Rent Service Scotland market evidence data, was developed and issued for the first time in 2014, to meet user need for more comprehensive rent data and statistics in Scotland. The publication outputs have recently been enhanced to include an interactive excel workbook, along with a one-page infographic map summary of trends across each broad rental market area.
Other recent developments in Scotland include the development of additional publication commentary and analysis of households living in the private rented sector within Scottish household survey annual reports, in which the latest report for 2017 includes a new section on changes to the private rented sector between 1999 and 2017. Analysis of affordability in the private rented sector, in terms of housing costs to income ratios, has also been developed as part of new Social tenants in Scotland statistical outputs, which whilst primarily focused on social rented housing also include a range of findings across different housing tenures and Great Britain countries.
Registers of Scotlandhave recently taken over the operation of the Landlord registration IT system in Scotland, although each local authority remains the data controller for the underlying data for their own areas. Scottish government statisticians are liaising with colleagues in Registers of Scotland to consider how the landlord registration database may be able to provide aggregate monitoring information on the sector.
The ongoing work of the CGHSG will be to review and if possible improve the statistics produced in the housing system. One of the priorities to take forward will be affordability, and a similar topic report to this will be produced looking at affordability in the housing system.
Back to table of contents9. Annex: Regulatory context
This section provides a summary of the historical context and regulation changes in the private rented sector.
England
The Housing Act 1988 introduced the Assured Shorthold Tenancy (AST) regime, which is now the most common form of tenancy in the private rented sector (PRS) in England, and arguably played a main part in boosting the role of the sector in the wider housing market. Under an AST, a tenant has a minimum of six months’ security. Landlords can use a Section 21 notice to evict tenants without grounds after the initial fixed term provided they give a minimum of two months’ notice. Landlords can use the Section 8 eviction process at any time during the tenancy. For this, they need to demonstrate reasonable grounds, such as rent arrears, anti-social behaviour or wanting to move into their property.
The Housing Act 2004 introduced several measures which apply to the private rented sector. The Housing Health and Safety Rating System (HHSRS) applies to all tenures but is most frequently used in the PRS. It is a risk assessment process which involves a local authority assessing 29 categories of potential housing hazards in a dwelling, such as damp, excess cold and electrical faults. The HHSRS concentrates on threats to health and safety and is not generally concerned with matters of quality, comfort and convenience. Each inspection considers whether a hazard is present and assesses the likelihood of the occupier suffering a harmful outcome as a result. The Act also extended the regulation of houses in multiple occupation (HMO) by requiring some HMOs to be licensed by local authorities. It also provided for two forms of discretionary licensing, these being additional HMO licensing and selective licensing of all PRS property in a designated area. It also introduced a requirement on landlords to protect tenancy deposits in a government approved tenancy deposit scheme.
The government introduced further protections for tenants under the Enterprise and Regulatory Reform Act 2013 and the Deregulation Act 2015. The former established powers to require all letting agents to join a government approved redress scheme, which have been in force since October 2014. The latter introduced protections for tenants against retaliatory eviction where they have a legitimate complaint about the condition of the property.
The Deregulation Act 2015 also prescribed a standard form that must be used when using the Section 21 eviction process and the requirements that must be met before the process can be begun. These requirements include providing a copy of the gas safety certificate and energy performance certificate for the property as well as issuing the tenant with a copy of the government’s “How to Rent” guide. Further, the government introduced legislation in October 2015 to improve safety in the private rented sector by requiring landlords to provide smoke alarms and carbon monoxide alarms.
In April 2017, the government gave local authorities additional powers through the Housing and Planning Act 2016 to crack down on rogue landlords by introducing civil penalties of up to £30,000 and extending rent repayment orders. In April 2018, the government introduced banning orders and a database of rogue landlords and property agents, making it easier for local authorities to act against them to protect tenants.
The Ministry of Housing, Communities and Local Government (MHCLG) have laid regulations to extend the mandatory licensing of houses in multiple occupation (HMOs) to protect tenants from overcrowding and poor housing conditions, requiring HMOs with five or more occupiers to have a local authority licence. This change will come into force in October 2018.
The Tenant Fees Bill was introduced into Parliament on 2 May 2018 and aims to ban unfair letting fees to tenants and cap tenancy deposits. The Bill is currently being scrutinised by Parliament and subject to the Parliamentary timetable; the government does not expect it to be implemented before spring 2019.
The government have laid regulations to make membership of a Client Money Protection scheme mandatory for letting agents using powers in the Housing and Planning Act 2016. These regulations will ensure that all agents are giving tenants and landlords financial protection and will come into effect in April 2019.
The government are supporting Karen Buck MP’s Homes (Fitness for Human Habitation) Bill, which complements existing enforcement activity by empowering tenants to hold their landlords to account if they fail to keep the property fit for human habitation.
Future policy developments
The MHCLG have consulted on the effectiveness of existing regulation in the sector on smoke and carbon monoxide alarms. On 30 April 2018, the government announced a separate wider review into the carbon monoxide regulations that the results from this consultation will feed into. An announcement on next steps will be made in due course.
A consultation was launched on 2 July 2018 on overcoming the barriers to longer tenancies. This proposes a new three-year tenancy model with a six-month break clause and seeks views on its viability and how it can be implemented. The government are collecting views on what could be done to provide tenants with secure tenancies while balancing landlords’ needs. The consultation also seeks views on whether the proposed tenancy model could be longer than three years; the closing date for this was 26 August 2018.
The government’s response to the consultation on Electrical Safety Checks will be published in the autumn. Ahead of this it was announced on 19 July 2018 that the government will require all private landlords to carry out five yearly mandatory electrical installation checks. The government are working to bring these regulations into force as soon as possible, subject to Parliamentary approval and timetable.
Private landlords are required to become members of a redress scheme so that tenants have quick and easy resolution to disputes.
The MHCLG aim to introduce an overarching regulatory framework for letting and managing agents, requiring them to sign up to a code of practice and meet minimum qualification standards. This involves working with industry and consumers to get the detail of legislation right and a working group will shortly be set up to help do this. The government expect to report the findings in 2019.
The MHCLG are working with the Ministry of Justice to understand the experience of users of the courts and the tribunal service, including whether cases (such as possession cases) are being resolved in a timely manner.
A review of selective licensing is being undertaken. The review will look at how selective licensing is used and assess the outcomes from schemes to find out how well it is working. The findings of the review will be reported in spring 2019.
Scotland
The Private Landlord Registration (Information and Fees) (Scotland) Regulations were first introduced in 2005 and amended in 2006 and 2008. The main elements are the principal fee, additional fees for properties, agent fee (where applicable), fixed discounts and fee exemptions. A person is required to be registered if he or she is the owner of residential property which is subject to a lease or occupancy agreement and is not specifically excluded. Local authorities and Registered Social Landlords (RSLs) are not required to register under this legislation. The lease or occupancy agreement must be to an “unconnected person”, that is, not a family member.
The Scottish Government ended the charging of illegal fees by landlords and letting agents by clarifying the law on premiums in the private rented sector in 2012.
In October 2012, the Scottish Government made it mandatory to use Tenancy Deposit Schemes (TDS) for all landlords who take a deposit from tenants, implementing the Tenancy Deposit Schemes (Scotland) Regulations which came into effect in March 2011. These require private sector landlords to pass tenant deposits to an independent third party to protect the deposits until repayment falls due. Three schemes have been approved which became operational in 2012. Deposits must be lodged within 30 days of the tenancy start date and held for the duration of the tenancy. The landlord is also obliged to provide the tenant with information including the deposit amount, details of and how to contact the TDS, and circumstances relating to the lease in which the deposit may be retained by the landlord. Leases will therefore need to specify for what reasons any part of a deposit may be retained by the landlord.
In April 2015, local authorities were given powers to apply to Ministers for an area to be designated as an Enhanced Enforcement Area (EEA), giving them additional powers to tackle extremely poor standards in the PRS. Two EEAs have been designated so far in Govanhill, Glasgow. In 2013, the Scottish Government published its Private Rented Sector Strategy "A Place to Stay, A Place to Call Home". The strategy sets out the Scottish Government's vision and strategic aims for the PRS. It aims to improve and grow the PRS by enabling a more effective regulatory system, targeting tougher enforcement action and attracting new investment. The additional discretionary powers under the Enhanced Enforcement Areas Scheme Regulations, support this targeted approach to enforcement.
In April 2016, Revenue Scotland Additional Dwelling Supplement tax was introduced, which although is in relation to house purchases will likely have impacted buy-to-let landlords, and thus indirectly impacted the private rented sector.
The new Private Residential Tenancy (PRT) brought in in December 2017, which makes tenancies indefinite by default (the landlord can only end a tenancy using one or more of the new 18 grounds for eviction), allows for rent increases only once a year and allows tenants to ask a Rent Officer to review rent increases. The PRT replaces the assured and short assured tenancy agreements for all new tenancies, provides more predictable rents and protection for tenants against excessive rent increases, and includes the ability to introduce local rent caps for rent pressure areas.
Also in December 2017, local authorities were granted powers to apply to Ministers for an area to be designated as a Rent Pressure Zone (RPZ) where rents are rising rapidly and causing tenants hardship. This allows for a cap on rents that is at least the consumer price index (CPI) plus 1% and can last for up to five years. Scottish Ministers have not yet received any applications.
The First-tier Tribunal which now handles all civil private rented sector cases was expanded to include cases that come from the new PRT, such as evictions and unfair rent increases, in December 2017. This was formed to deal with results of rent or repair issues in private sector housing. The Chamber can also help resolve issues that arise between homeowners and property factors. The functions of the former Tribunals that the Chamber replaced are The Private Rented Housing Panel (PRHP) and Homeowner Housing Panel (HOHP).
Letting Agent Code of Practice came into effect on 31 Jan 2018. This sets out the standards expected of letting agents operating in Scotland in how they manage their business and provide their services. This is a set of rules that all letting agents must follow to make sure they give a good service to landlords and tenants.
The code explains the minimum standards a letting agent must meet when:
dealing with landlords
marketing and advertising a property
managing a let
collecting rent
handling repairs
ending a tenancy
It covers the standards of practice for those carrying out letting agency work, the handling of tenants' and landlords' money, and the professional indemnity arrangements to be kept in place. The framework includes:
a mandatory register for letting agents with an associated “fit and proper” person test
powers for Scottish Ministers to set training requirements that must be met before an applicant can be accepted on to the register
a means of redress for breaches of the code to the First-tier Tribunal for landlords and tenants
powers for Scottish Ministers to obtain information, and powers of inspection to help them monitor compliance
The Register of Letting Agents is a list run by Scottish Ministers. All letting agents in Scotland must have made an application to be registered with Scottish Ministers by 1 October 2018 and must adhere to the new Letting Agent Code of Practice, mentioned above.
Wales
The Welsh Government’s housing priorities are: more homes, better quality homes and better housing-related services. The Welsh Government is continuing to introduce a programme of legislation aimed at improving how the housing system works and ensuring that housing legislation is aligned with wider policies, programmes and funding to help deliver the government’s priorities set out in Prosperity for All.
The Housing (Wales) Act 2014 brought in legislation aimed to raise standards in the private rented sector through landlord and agent registration and licensing. Under Part 1 of the 2014 Act, all landlords are required to be registered, and all agents and self-managing landlords must be licensed. Licensing involves successful completion of a “Fit and Proper Person” test, to ensure that they have no unspent relevant convictions, and training, to ensure that landlords and agents are aware of their legal responsibilities. Anyone who has not complied with the law can be issued with a fixed penalty or, if taken to court, can be fined. Rent Smart Wales, which manages the registration and licensing arrangements, is helping to raise management standards and protect the interests of tenants and those landlords and agents working within the law.
The registration and licensing requirements are in addition to the regulatory functions local authorities already have regarding the private rented sector. Under the Housing Act 2004, local authorities are required to assess housing conditions and can enforce remedial actions as required. They also manage licensing schemes for properties occupied by more than one household (known as houses in multiple occupation, or HMOs) and assist with consumer issues including unfair terms, fees, etc.
The Renting Homes (Wales) Act 2016, once fully implemented, will make it simpler and easier to rent a home, replacing various and complex pieces of existing law with one clear legal framework. In addition to reforming the law underpinning how homes are rented, the Act contains a number of important new provisions. These include:
requiring landlords to ensure homes are fit for human habitation (including the installation of smoke and carbon dioxide detectors and conducting electrical safety tests)
addressing inequalities in tenants’ current succession rights
providing protection against retaliatory eviction
enabling landlords to re-let abandoned properties more quickly
The Welsh Government is committed to removing the barriers for tenants to enter and move within the private rented sector. On 12 June 2018, the Welsh Government introduced the Renting Homes (Fees etc.) (Wales) Bill to ban fees charged in the private rented sector. Subject to it being approved by the Assembly, the Bill will ban tenants from being charged for an accompanied viewing, receiving an inventory, signing a contract, or renewing a tenancy. It will allow letting agents and landlords to only charge fees relating to rent, security deposits, holding deposits (capped at a week’s rent), or when a tenant breaches a contract. The bill will also provide a regulation-making power to limit the level of security deposits. The Welsh Government will continue to seek opportunities to work with private landlords and agents to remove any barriers to a more effective housing system.
Since April 2018, Stamp Duty Land Tax (SDLT) was replaced with Land Transaction Tax (LTT). Higher rates of Stamp Duty Land Tax on purchases of additional residential properties (including second homes) came into effect on 1 April 2016. These will continue in the new act.
A report entitled “UK Housing Legislation Summary” published by Rent Smart Wales in June 2018 compares the difference between the main areas of the private rented sector legislation around the UK.
Northern Ireland
The Department for Communities has undertaken a review of the role and regulation of the private rented sector under the following six themes:
supply
affordability
security of tenure
tenancy management
property standards
dispute resolution
The Department proposes to (according to the consultation document released in January 2017):
gauge the appetite of institutional investors from Great Britain to invest in Northern Ireland
encourage the development of more mixed tenure housing areas
scope out the role of Housing Associations in the private rented sector
restrict number of times rent can be increased in a 12-month period
ensure all private tenants are issued with a written agreement which must contain mandatory terms
increase the minimum notice to quit period from four weeks to two months
introduce a Fast Track Eviction process
consider landlord training programme
pilot a dedicated landlord advice line
develop a tenant information pack
amend the Landlord Registration Regulations to incorporate a fitness declaration at the point of registration
introduce a regulatory framework for letting agents
introduce requirement for landlords to provide smoke alarms, carbon monoxide detectors and carry out periodic electrical checks
introduce legislation around Energy Performance Certificate ratings with possible exemptions
move the 1945 date for rent control to 1956
establish an independent housing panel for Northern Ireland
The public consultation exercise closed in early 2017 and the Department’s proposals for change await Ministerial approval. Once a Minister has agreed the way forward the Department will publish the agreed proposals.
Back to table of contents