2. Abstract
Alternative data sources such as web scraped and point of sale scanner price datasets are becoming more commonly available, providing large sources of price data from which measures of consumer inflation could potentially be calculated. However, utilising these data without a continuous time series available for each product is a challenge that a number of National Statistics Institutes (NSIs) are currently facing.
This article puts forward an alternative experimental approach to aggregating large data sets into price indices: clustering large datasets into price indices (CLIP). The CLIP uses all the data available by creating groups (or clusters) of similar products and monitoring the price change of these groups over time. Unsupervised and supervised machine learning techniques are used to form these product clusters.
The article ends by applying the CLIP to grocery data that we have web scraped from online retailers between June 2014 and July 2016. The experimental price indices presented in our previous web scraping articles are also updated to July 2016 and compared to the CLIP. Charts for each of the web scraped items and aggregate indices are presented in the “Data” section of this release. These are early analysis using experimental techniques to help us develop our statistical methodology and are not comparable with headline estimate of inflation. We would strongly caution against their use in economic modelling and analysis.
Back to table of contents3. Introduction
We publish the headline Consumer Prices Index (CPI) every month. The CPI is the rate at which the prices of goods and services bought by households rise or fall. The index measures the change in price of a fixed basket of approximately 700 representative consumer goods and services.
The CPI is calculated by collecting a sample of prices for a selection of representative goods and services in a sample of UK retail locations. Currently, around 180,000 separate price quotations are used every month in compiling the index, covering the 700 items. Prices for around 520 of these items are collected by price collectors from stores across the country. The remaining prices are collected centrally through websites, catalogues and by phone. This is often referred to as traditional price collection in index number literature.
One of the more recent changes in consumer purchasing behaviour has been the increasing number of people shopping on the internet. This growth in online retailing means that price information for many goods and services can now be found online. Web scraping uses software tools to extract these data from web pages, and produces large datasets of detailed and very timely price information. These alternative data sources, alongside others such as point of sale scanner data, have the potential to greatly improve the quality of consumer price indices.
In January 2014, we began a research project to use web scrapers to collect prices from 3 online retailers as part of ONS Big Data project. Since the pilot was launched, we have published a number of updates on research into using web scraped data to produce experimental price indices, including methodologies that differ from the more traditional fixed based indices such as the CPI (see Trial consumer price indices using web scraped data and Research indices using web scraped data). We released an update in May 2016 – Research indices using web scraped data: May 2016 update – that contained updated versions of these indices and further detail on the new cleaning and classification techniques that we have applied to the web scraped data. These are early analysis using experimental techniques to help us develop our statistical methodology and are not comparable with headline estimate of inflation. We would strongly caution against their use in economic modelling and analysis.
One of the limitations we have found with the web scraped data is the high level of product churn (that is, products coming in and out of stock) compared with the monthly data that is collected for the CPI. This means that, for some items, sample sizes are very small. This problem is particularly acute where the methodology requires products to be matched over the length of the time series, for example in the unit price index.
This paper presents an alternative approach called clustering large datasets into price indices (CLIP), which could be better suited to overcoming the problem of high product churn. We apply the CLIP to our web scraped data from June 2014 to July 2016, and the results are discussed. We then update the experimental price indices published in our previous article to July 2016 and compare to the CLIP. Charts for each of the web scraped items and aggregate indices are presented in the “Data” section of this release.
Back to table of contents4. Generating traditional price indices
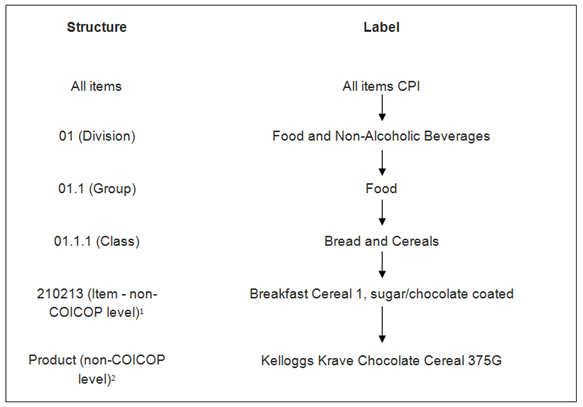
The Consumer Prices Index (CPI) measures inflation with reference to the changing cost of a fixed basket of goods and services. The coverage and classification of the CPI item indices are based on the internationally agreed classification system for household consumption expenditure known as COICOP (classification of individual consumption by purpose). COICOP is a hierarchical classification system comprising of divisions, groups and classes. Figure 1 provides an example showing the classification structure for COICOP class 01.1.1 Bread and Cereals.
Figure 1: Classification structure for COICOP class 01.1.1 Bread and Cereals

Source: Office for National Statistics
Notes:
- Defined by ONS to represent some part of UK consumer spending on Bread and Cereals.
- Specific product selected by price collector to match description of item and represent price movements for the item level.
Download this image Figure 1: Classification structure for COICOP class 01.1.1 Bread and Cereals
.png (41.3 kB)Within each year, the CPI is a fixed-basket price index: it measures the change in the price of a basket of fixed composition (quantity and as far as is possible quality). The CPI weights are updated in 2 stages every year: in January, to take account of the new COICOP weights for CPI classes and above, and in February to take account of the changes to the basket of representative items. Quantity data is unavailable so instead we use price relatives and expenditure shares to calculate inflation, which are equivalent to using fixed quantities. A price relative (Equation 1) is the ratio of a price at a given time to the price for the same product at another time.

Indices are derived for each level of the classification structure. At the lowest level, a sample of prices is collected for products which the price collector selects to match the item description. For example, for the item "Breakfast cereal 1, sugar/chocolate coated", prices are collected for products such as "Kelloggs Krave Chocolate Cereal 375G" (Figure 1). Only a sample of products is collected; it is assumed that their price movements are representative of all the other products available for that item. We determine the list of items based on UK consumer expenditure for each COICOP class. Prices are only collected for those items selected.
As we do not have detailed expenditure information on a product-by-product basis, and therefore cannot produce expenditure weights, the next step is to calculate elementary aggregate prices. These are an unweighted average of price relatives for particular products taken within different "strata", defined by either region, type of shop (independent or chain retailer), or both. Indices for higher levels of the classification structure are expenditure-weighted averages of these elementary aggregate indices using a Laspeyres-type index. For more information, please see Chapter 2 of the CPI Technical Manual.
The methodology behind each of the experimental indices developed as part of the web scraping project is also based on the principle of following a basket of goods and services across time, and updating this basket to adjust to changing consumer preferences. However, the difference between web scraped and traditional price collection means that there is scope to develop new methodology which may be better suited to larger and more diverse datasets. The next section will move on to look at these differences and how they can be exploited in the development of new methodology.
4.1 Comparison between traditionally collected price data and alternative data sources
Alternative data sources such as web scraped and point of sale scanner data have a number of differences compared with traditionally collected price data for consumer price statistics. While there are a number of advantages to using web scraped and scanner data, these differences must be taken into account when using these data sources to form price indices. This section presents a summary of these differences, for a more detailed discussion please see Research indices using web scraped data: May 2016 update.
The main difference between the traditional collection and alternative data sources such as the web scraped and point of sale scanner data is that the traditional collection selects a representative sample of goods and services. This performs 2 roles: it helps to ensure that the price index represents what consumers are actually buying and means that similar (relatively homogeneous) sets of products are selected. The index therefore satisfies the statistical assumption of lower level price index theory, which is set out by the internationally agreed ‘CPI Manual: Theory and Practice’: “An elementary aggregate consists of the expenditures on a small and relatively homogeneous set of products defined within the consumption classification used in the CPI".
Web scraped and point of sale scanner data do not take any form of sample at the product level, as in theory all possible data are collected from the website or shop. This greatly increases the coverage of goods and services available, but for web scraped data, it does increase the difficulty of forming a representative basket as there is no information on what products are actually purchased by consumers.
Another difference between the traditional collection and alternative data sources is the quantity of products collected with high churn (products which move into and out of the market over time). This is due to the size of the data collected and because the products are not sampled. In the traditional collection, price collectors will identify a product which consumers typically buy and, as such, we might expect that the retailers will make efforts to keep the product in stock, allowing us to track its price progress over time. When a product is not available a comparable replacement is manually found or, when this is not possible, a non-comparable replacement is found and a quality adjustment is made. The high level of product churn and the size of the data involved make the manual replacement process unpractical for alternative data sources. Forming a complete time series across each of the products is therefore not possible. This means that the sample used to compute the index reduces in size over time as products drop out of the market, and results in the index becoming less representative of the products on sale.
For this reason, the type of methodology that can be applied to alternative data sources is restricted. Price indices can either take a fixed-basket approach, and hence do not utilise all available data and suffer from a declining sample, or match products over a non-consecutive time period such as the method used in the GEKS index (originally proposed by Gini, Eltetö, Köves and Szulc). The GEKS index greatly increases the data that are used in the formation of the index, but it is computationally intensive and does not use a fixed-basket approach.
The next section of this article puts forward a new methodology for creating price indices using alternative data sources.
Back to table of contents5. Development of the CLIP
The clustering large datasets into price indices (CLIP) was developed as a result of methodological work into how to form price indices using web scraped data. The method is also potentially applicable to point of sale scanner data and other alternative data sources with greater product coverage than the traditional collection. The CLIP is an experimental index and as such we would welcome any comments you may have on its methodology to cpi@ons.gov.uk. This is early analysis to help us develop our statistical methodology and we would therefore caution against its use in economic modelling and analysis.
The aim of this work was to calculate a price index that:
- utilises all available clean data
- can be calculated on an ongoing basis as part of a production environment
- includes products that have high product churn (i.e. products that are only on the market for a short time, or enter and leave the market regularly)
- accounts for the variation in products that are available to consumers
- satisfies the statistical assumption that elementary aggregates (indices calculated at the lowest level of aggregation) are only calculated using relatively homogeneous groups of products
This section will first discuss the theory behind the CLIP before moving on to discuss the methodology.
5.1 Theory
The CLIP is based on the theory that a consumer will wish to purchase certain types of products rather than a particular product, and hence price changes in these products over time should be reflected by changes in consumer price statistics. Some consumers will always purchase the same product due to factors such as brand loyalty. However, other consumers may not always purchase the same product at different points in time. The exact product may depend on a number of factors such as:
- the price of the product
- what products are available
- the quality of those products
- which products are on offer
For example, a consumer may have a restricted budget but wish to purchase some grapes to last the week. The requirement therefore is at least 500g of grapes. One week, they purchase 500g of everyday value red grapes. The next week, red grapes are no longer available, so they purchase 500g of everyday value green grapes for the same price. To the consumer, this could be seen as the same purchase: both products fit the requirements and hence can be seen as interchangeable.
This approach is important because alternative data sources such as web scraping include all possible goods and services sold by the retailers. This leads to high product churn and variability in the type of products available within the data collected. This is less of a problem with the traditional approach because a purposive sample of products is taken.
For instance, within our web scraped data from a randomly selected day, there were 674 prices collected for bottles of white wine from 1 of the online retailers. If a consumer bought a bottle of white wine then they would need to choose from this large variety available based on their requirements. For example, if the consumer wished to purchase a bottle (75cl) of white wine within the price range of £4 to £6, there were 113 individual products available to choose from. The amount, type and price of products that are available are likely to change over time and may affect which product a consumer purchases. This may lead to the consumer substituting across similar types of products that fit their requirements, including new products coming onto the market, or products that are on offer and now fit into the requirements.
It is not possible to adjust for the high quantities of product options available to a consumer when a traditional, sampled collection of price data is used. Alternative data sources such as web scraped or scanner data provide the opportunity to adjust for potential changes in consumer purchasing behaviour dependent on the range available to them. This approach assumes that because a consumer may purchase the same type of product, the price index should therefore reflect changes in the price of the whole set of relatively homogeneous products, rather than just 1 individual product.
5.2 Method
The CLIP uses a fixed basket and the classification of individual consumption by purpose (COICOP) classification levels described in Section 4. This maintains comparability with other UK and international inflation statistics. Here, the calculation of the monthly index is discussed but the methodology can also be applied on a weekly basis (as demonstrated in Section 6).
The CLIP is applied at the item level, which is the lowest level of classification used to calculate the CPI e.g. "Breakfast cereal 1, sugar/chocolate coated" (Figure 1). Within each of these items, the available products are clustered together into similar groups using the information that has been scraped from the website (price, product name, shop, discount marker). The CLIP is calculated by measuring the price change over time between these clusters. To maintain a fixed basket, the clusters are formed and set for the base month (January, to maintain consistency with the UK CPI), and then the same clusters are formed for each time period over the year (in this case, monthly). The product make-up within each cluster can vary over time, as products move in and out of the market. This therefore allows for high product churn in the data.
Price relatives are calculated from the geometric mean price of the cluster for the comparison month, and the geometric mean price of the cluster in the base period. For each comparison month, these cluster price relatives are then aggregated together using the number of products within each cluster (fixed in the base month) as the weight.
Using the same classification structure as more traditional approaches to calculating inflation means that the same weighting information can be used by the CLIP as that used in the CPI. This reduces the difficulty of obtaining this information, and maintains consistency. Once the item level indices are calculated, this weighting information is used to aggregate up the indices to the higher COICOP levels following the same process as the more traditional approach.
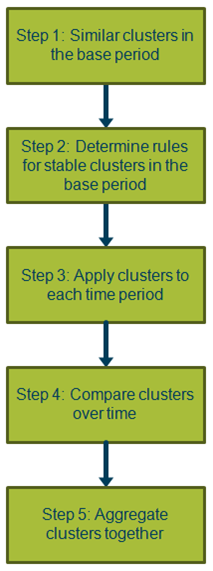
A step-by-step explanation of the methods applied is given below and summarised in Figure 2.
Figure 2: Outline methodology of the CLIP
Source: Office for National Statistics
Download this image Figure 2: Outline methodology of the CLIP
.png (47.5 kB)Step 1: Form similar clusters within the base month
In the base time period, the data within each item level classification are used to form similar clusters. Non-unique products within the base period are aggregated using a geometric mean prior to calculating the CLIP, which stops products that are collected regularly being over represented when calculating the clusters. An unsupervised machine learning approach is taken to cluster together similar groups of products. The clustering technique used is not pre-defined and should be chosen to form optimal clusters. K-means, hierarchical, agglomerative and Gaussian mixtures are just some of the available options.
In this case, we have decided to use the method of mean shift clustering. For more information on how mean shift clustering works, please see Mean Shift: A Robust Approach toward Feature Space Analysis. In summary, mean shift clustering is a non-parametric feature-space analysis technique. Mean shift clustering uses kernel density estimation to estimate the underlying distribution of the dataset. It then places a kernel (weighted function) on each data point and then iteratively shifts each point until they are at the maximum of their nearest kernel density estimation surface.
Mean shift clustering was used above the other potential options because of its ability to cluster large spatial datasets quickly without prior knowledge of the number of clusters or constraints on the shape of the clusters. This is an important feature when large web scraped or scanner datasets are being used as it reduces the processing power and computation time needed. Further, mean shift does not require prior information, such as the number or type of clusters to be formed: this increases the simplicity and parsimony of the process and reduces the potential for bias when creating the fixed basket. The shape of the cluster is also not restricted (as in mixture clustering), making this approach very flexible.
The results of applying mean shift are a clustering assignment being given to each product. For example, for the item “Breakfast Cereal 1, sugar/chocolate coated” in 2015, there were product prices collected in the base month (January 2015) for 137 unique products. Mean shift clustered these into 3 groups and assigned a cluster number from 1 to 3 to each product. The item “Breakfast Cereal 1, sugar/chocolate coated” has been used here as the example because the small number of products collected and clusters formed make it easier to demonstrate the process.
For those items where there is not a significant difference between the products to form more than 2 clusters in the base period (either month or week), the method changes to taking price relatives for individual products within the item instead of across clusters, which is the methodology used in our most recent update to calculate the unit price index (the unit price index for period t with period 0 as the base period is calculated as a fixed-base Jevons price index that uses prices of all items common to every period in the defined range (a year or 6 months) - see Research indices using web scraped data: May 2016 update for more information). This implies that the monthly and weekly CLIP can follow different trends over time depending on what items form clusters in the base period. Annex 1 presents a list of items that have not formed clusters in a particular year for the monthly and weekly CLIP.
Step 2: Determine set of underlying rules for constructing clusters in the base month
The same clusters of products formed in Step 1 need to be formed for each comparison month, so that changes in the price of that fixed cluster can be calculated over time. However, general clustering methods, including mean shift, are designed to update the cluster formations for each new dataset. This means that these clusters are fitted to the data, in contrast to the situation here where the data should be fitted into set clusters so that there is consistency over time.
In order to fit the data into set clusters, the underlying structure of the clusters in the base period needs to be understood and then the same structure applied to the other time periods. This is achieved by looking at the underlying rules from which the mean shift clustering assignments can be recreated using the supervised machine learning technique: the decision-tree classifier.
Decision trees are a non-parametric approach to classification (or regression). The decision tree predicts the classification assignment of each product using a simple set of decision rules. These rules are created using training data for which both the features of the data itself are known and the classification assignment of these data. The features that are used to create the decision tree are the product name, shop and discount marker. Price has not been used to allocate products to clusters. This is because if products were classified using price, the price movement of the clusters would not represent the full movement in prices because products would just move to a different cluster rather than the overall price of that cluster changing. The variable discount marker has been used to allocate products because it allows for products on discount to move to a different cluster (that is, it allows for consumers to choose products that have moved into their price range). However, if our assumption is incorrect and consumers prefer particular products rather than particular types of products, this means that the discounted price will not be taken into account by the clusters’ price movements and the overall index could be biased upwards. This assumption requires further testing.
In the case of the "Breakfast cereal 1, sugar/chocolate coated" example for the year 2015, the mean shift clustering assignments in the base period (January 2015) are used as the training data. This feeds in information about how the features within the data relate to the pre-defined clustering assignments (Step 1). A simple set of rules is determined which assigns products to a certain cluster. For example, the variable product name is assigned a number (“Product_number”) based on how similar it is to the item level category name. This number is then used as part of the algorithm to assign products into a cluster. If a new product enters the market it will be assigned to a cluster based on its similarity to the name of the overall item level category, the store it originates from and whether or not it is on discount.
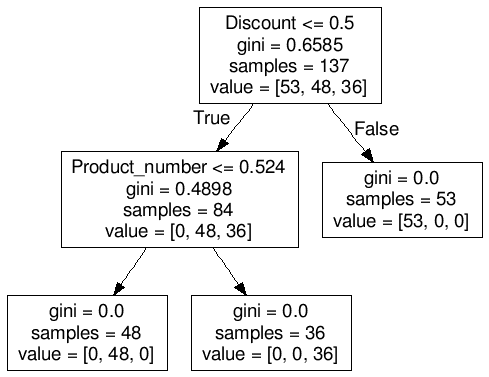
The results of applying the decision-tree classifier are structured trees for each item. For example, Figure 3 shows the decision classification tree for the item "Breakfast cereal 1, sugar/chocolate coated" applied to data from January 2015. The decision-tree has a flowchart-like structure; the top box (node) contains the full data of 137 unique products. For this item, products are then split into 2 based on the criteria “Discount <= 0.5”. This criteria means that if products are not on discount (<= 0.5) then they go into the left-hand node (84 products) and if they are on discount they go into the right-hand node (53 products). The products that are not on discount are then split into 2 more subsets based on the criteria (Product_number <= 0.524). This criteria means that a product with a product name that is not similar to the item name “Breakfast cereal 1, sugar/chocolate coated” goes into the left node (48 products), and products that have a similar name to the item name go into the right-hand node (36 products). The path from root (top node) to leaf (bottom node) represents the classification rules for each cluster.
Figure 3: Decision classification tree for the item breakfast cereal 1, sugar/chocolate coated
Source: Office for National Statistics
Download this image Figure 3: Decision classification tree for the item breakfast cereal 1, sugar/chocolate coated
.png (17.6 kB)The results from the clusters formed within the base period are shown in Table 1. This shows that the number of products within each cluster is reasonably similar and the related prices differ by up to £0.32. The number of clusters and the amount of variation in price between clusters changes depending on the item.
Table 1: 2015 base cluster results for the item breakfast cereal 1, sugar or chocolate coated
| Cluster | Number of products | Geometric mean of price |
| 1 | 48 | £2.19 |
| 2 | 36 | £2.52 |
| 3 | 53 | £2.24 |
| Source: Office for National Statistics | ||
Download this table Table 1: 2015 base cluster results for the item breakfast cereal 1, sugar or chocolate coated
.xls (26.1 kB)Step 3: Apply clusters to each time period
Using the set of underlying rules for constructing the clusters, as determined in Step 2, the data for each comparison month are now fitted into the set clusters. As the underlying rules that determine which products are assigned to which cluster do not change across the year, the clusters are comparable over time, making it possible to measure price change of similar groups of products.
As the data are fitted to the clusters, it is not necessary that the same individual products are available each month, only that the same types of products are available. Therefore, all available cleaned data collected using the web scraper can be included. This method also means that the size of the cluster may vary at different time periods depending on what the retailer is selling at a given time.
Step 4: Form price relatives between clusters in each comparison month and the base period
A geometric mean of prices for each cluster in each time period is calculated. Price change between the comparison month and the base month for each cluster is then measured by calculating a price relative (Equation 1, Section 4). Figure 4 shows the price relatives for each of the 3 clusters that have been formed for the item "Breakfast cereal 1, sugar/chocolate coated" for 2015. From this, it is clear that the clusters experience different changes in price over time.
If only a small number of products have been collected for an item (for example, on average only 3 prices are collected each day for bananas), then only 1 cluster will be formed in Step 1 and Step 2. This single cluster may contain goods or services which are not similar, making it inappropriate to use the CLIP method for this item. In cases where only 1 or 2 clusters are formed, price relatives are calculated for individual products within this item instead of across clusters, which is the methodology used to calculate the unit price index in our most recent publication.
Figure 4: Price relatives for the clusters of item breakfast cereal 1, sugar or chocolate coated in 2015
Source: Office for National Statistics
Download this chart Figure 4: Price relatives for the clusters of item breakfast cereal 1, sugar or chocolate coated in 2015
Image .csv .xlsStep 5: Aggregate clusters together using the size of each cluster in the base period as the weight
Intuitively, clusters which contain more products should have a greater influence on the overall price index. Therefore, the size (number of products) of the cluster is set as the weight of each cluster. As Step 3 demonstrates, the number of products within each cluster can vary over time. To reduce the impact of the changing size of clusters on the overall price index, the weight of each cluster is fixed in the base period.
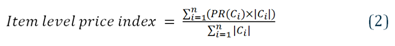
The price relatives for each cluster are aggregated together using these fixed weights. The formula is given in Equation 2.
where Ci is the ith cluster for a particular item that has n clusters in total, PR(Ci) is the price relative for cluster i, and |Ci| is the size of cluster i in the base period.
By taking the size of the clusters as the weight for calculating the item level index, the assumption is being made that the number of products within each cluster (that is, the number that the retailer is selling) is related to the number of products within each cluster that consumers are actually buying. This assumption is necessary when using web scraped data. If point of sale scanner data were available, the number of actual products sold from each cluster could be used as the weight instead.
Once the CLIP is calculated for the item level, published CPI weights are used to aggregate up the indices to the higher COICOP levels following the same process as the more traditional approach.
Back to table of contents6. Results
The web scraped data are used to construct price indices referenced to June 2014 = 100. In this section, we first present monthly clustering large datasets into price indices (CLIP) for the higher level aggregates of food and non-alcoholic beverages, and alcoholic beverages. Although these indices are not produced on a comparable basis with the published Consumer Prices Index (CPI) for a number of reasons, including data source and methodology, it is still a useful exercise to examine the trends shown in the different indices. Therefore, the CLIP indices are produced here alongside special aggregates of the published CPI item indices, which only include items that have been collected in the web scraping pilot.
We then move on to look at the comparisons of CLIP on a weekly basis with other experimental web scraped indices such as the unit price and GEKSJ. For more information about these indices, and the CPI special aggregates, please see the latest publication update. This publication also contains more information on the scraper break in October 2015, which is highlighted by the gap in the weekly series. Charts for each of the web scraped items and aggregate indices are presented in the “Data” section of this release.
These experimental indices are early analysis to help us develop our statistical methodology for alternative sources of prices data, and we would therefore caution against their use in economic modelling and analysis.
6.1 Comparison between CLIP and the CPI special aggregate
The results for both food and non-alcoholic beverages, and alcoholic beverages, are presented in Figures 5A and 5B respectively. Similar downward trends are shown for both the published CPI and the CLIP price indices. CPI has seen largely negative contributions from grocery prices over the period since February 2015. While we may not expect the CLIP to behave in the same way as the CPI due to its different methodology and source data, supermarkets have been engaged in a price war since the beginning of 2015 and have therefore reduced prices accordingly to attract consumers. The CLIP also provides evidence for this behaviour.
The similarity in trend is particularly true for food and non-alcoholic drinks, for which the CPI and the CLIP have very similar dynamics over time especially for the period June 2014 to July 2015. For alcoholic drinks, the CLIP index is smoother than the published index. This may be due to the larger amount of data being used within the calculation.
Figure 5A: Comparison of the CLIP and a special aggregate of the published CPI item indices for food and non-alcoholic beverages, Index June 2014 = 100
Source: Office for National Statistics
Download this chart Figure 5A: Comparison of the CLIP and a special aggregate of the published CPI item indices for food and non-alcoholic beverages, Index June 2014 = 100
Image .csv .xls
Figure 5B: Comparison of the CLIP and a special aggregate of the published CPI item indices for alcoholic beverages, Index June 2014 = 100
Source: Office for National Statistics
Download this chart Figure 5B: Comparison of the CLIP and a special aggregate of the published CPI item indices for alcoholic beverages, Index June 2014 = 100
Image .csv .xls6.2 Comparison with other experimental web scraped indices
There are many ways that web scraped price data could be compiled to form a price index. In this section, we compare the CLIP against the unit price index and the GEKSJ index. The unit price index calculates an average price for the product over the period (weekly or monthly) and uses this to construct a direct fixed-basket index, in line with the traditional method of price index calculation. This means that only products which have a price in all periods can be used as a result of this fixed-base model. This significantly reduces the number of prices that can be used in the calculation of more frequent indices. It also means that, in the future, the index will be subject to revisions as more periods of data become available and products drop out of the sample.
The GEKSJ index, as well as the CLIP, might be more suitable for the type of high-frequency data that is collected by the scrapers. The GEKS method (originally proposed by Gini, Eltetö, Köves and Szulc) essentially takes the geometric mean of all bilateral indices between the base period and the current period. Here, we use the Jevons elementary aggregate formula to calculate the price relative and therefore we refer to this approach as the GEKS Jevons price index (GEKSJ).
Figures 6A and B shows the CLIP, GEKSJ and unit price presented on a weekly frequency for food and non-alcoholic beverages, and alcoholic beverages, respectively.
Figure 6A: Comparison of CLIP, GEKSJ and unit price index for food and non-alcoholic beverages, Index week beginning 2 June 2014 = 100.
Source: Office for National Statistics
Download this chart Figure 6A: Comparison of CLIP, GEKSJ and unit price index for food and non-alcoholic beverages, Index week beginning 2 June 2014 = 100.
Image .csv .xls
Figure 6B: Comparison of CLIP, GEKSJ and unit price index for alcoholic beverages, Index week beginning 2 June 2014 = 100
Source: Office for National Statistics
Download this chart Figure 6B: Comparison of CLIP, GEKSJ and unit price index for alcoholic beverages, Index week beginning 2 June 2014 = 100
Image .csv .xlsSimilar trends are shown for both food and non-alcoholic beverages, and alcoholic beverages, for all 3 indices. However, the CLIP tends to follows the GEKSJ more closely than the unit price index. This may be due to the fact that the fixed-base methodology used in the unit price index means that it is not possible to include products with high product churn within the index. The deviation therefore demonstrates the impact of including price movements for items which appear in some, but not all, of the periods, which the CLIP and GEKSJ can better account for.
Back to table of contents7. Conclusion
There are a number of different approaches that have been developed to calculate price movements for products collected via alternative data sources, each with its own merits and drawbacks. However, there is no defined way of testing which most accurately measures changes in price over time.
The traditional price index methodology used in Consumer Prices Index (CPI) captures price change over time using a representative basket of goods and services. This is a consistent, high-quality measure of inflation based on geographically diverse data.
However, the traditional price collection method is expensive and hence only a sample of goods and services are collected on or around index day. The introduction of larger alternative data sources for consumer prices, such as web scraped or point of sale scanner data, means that high-frequency, non-sampled collections are possible. These alternative data sources can lead to potential cost savings and increased collection size, although the processing, maintenance and storage costs also need to be considered. These data sources are also limited by their quality and restricted coverage (for example, web scraped data only represents online purchases from outlets with an online shop).
This article suggests 1 potential method for calculating price indices using these larger datasets. CLIP uses all available data and does not assume that a consumer will always buy exactly the same product, just that they are likely to buy a certain type of product. It therefore measures the change in price as experienced by the consumer for a set of representative goods and services. This approach is only possible when large, varied datasets of prices are available for each item. Currently, this restricts its use to web scraped and point of sale scanner data. Local collection of such large datasets would be very costly and cause inappropriate obstructions for individual retail outlets. The results suggest that the CLIP follows the same trends as other price indices over time.
This work contributes to a growing body of research into large alternative sources of price data and its results are useful in developing methods for scanner data, as well as web scraped data. Despite the issues faced in producing price indices, web scraped data have the potential to deepen our understanding of price movements in the groceries sector in the medium term and, in the long term, improve the way prices are collected for national consumer price indices. This is experimental work, and we would welcome feedback to cpi@ons.gov.uk.
Back to table of contents8. Future work
The next step is to conduct further work on testing the assumptions behind the CLIP. For example, we would like to use our historical consumer panel data to look at whether consumers substitute between clusters that are formed as well as within clusters. We would welcome your feedback on the methodology to cpi@ons.gov.uk.
As well as developing the methodology, we are now working on applying the CLIP to web scraped clothing data that we received from WGSN – a fashion forecasting company. This clothing data may be more suitable for the CLIP because it has a much larger sample of data for different clothing items. This work will be covered in a future article, alongside other analysis of this dataset.
More generally, we are continuing to work on the planned methodological developments for our web scrapers set out in the future work section of the previous release: Research indices using web scraped data: May 2016 update. We will continue to update price indices on an ad-hoc basis, as and when progress is made in any of the work streams.
Back to table of contents9. Annex A
Table A presents the list of items that have not formed clusters in a particular year for the monthly and weekly CLIP.
Table A: CLIP metadata
| 2014 (June to Dec) | 2015 | 2016 (Jan to July) | ||||
| Item | Weekly | Monthly | Weekly | Monthly | Weekly | Monthly |
| apple cider, bottle, 4.5%-5.5% abv | CLIP | CLIP | Unit Price | Unit Price | Unit Price | Unit Price |
| apples, dessert, per kg | Unit Price | Unit Price | CLIP | CLIP | CLIP | CLIP |
| bananas, per kg | Unit Price | Unit Price | Unit Price | Unit Price | Unit Price | Unit Price |
| bitter, 4 cans, 3.4%-7.5% abv | Unit Price | Unit Price | CLIP | CLIP | CLIP | CLIP |
| brandy, bottle | CLIP | CLIP | CLIP | CLIP | CLIP | CLIP |
| breakfast cereal 1, sugar/chocolate coated | CLIP | CLIP | CLIP | CLIP | Unit Price | Unit Price |
| breakfast cereal 2, not sugar/chocolate coated | CLIP | CLIP | CLIP | CLIP | CLIP | CLIP |
| cheese cheddar, home produced, per kg | CLIP | CLIP | Unit Price | Unit Price | CLIP | CLIP |
| cola flavoured drink, bottle | CLIP | CLIP | CLIP | CLIP | Unit Price | Unit Price |
| dry spaghetti or pasta, 500g | CLIP | CLIP | CLIP | CLIP | CLIP | CLIP |
| fresh veg, onions, per kg | CLIP | Unit Price | CLIP | CLIP | CLIP | Unit Price |
| fresh veg, tomatoes, per kg | CLIP | CLIP | CLIP | CLIP | CLIP | CLIP |
| fresh/chilled orange juice, eg. tropicana | CLIP | CLIP | CLIP | CLIP | CLIP | CLIP |
| fruit juice, not orange, eg. apple | CLIP | CLIP | CLIP | CLIP | CLIP | CLIP |
| grapes, per kg | CLIP | Unit Price | Unit Price | Unit Price | Unit Price | Unit Price |
| lager, 4 bottles, 4.3%-7.5% abv | CLIP | CLIP | CLIP | CLIP | CLIP | CLIP |
| plain biscuits (eg. digestive) | CLIP | CLIP | CLIP | CLIP | CLIP | Unit Price |
| potatoes, new | Unit Price | Unit Price | Unit Price | Unit Price | Unit Price | Unit Price |
| potatoes, old, white | CLIP | CLIP | CLIP | CLIP | CLIP | Unit Price |
| red wine, european, bottle | CLIP | CLIP | CLIP | CLIP | CLIP | CLIP |
| rum, white, bottle | CLIP | CLIP | CLIP | CLIP | CLIP | CLIP |
| shop milk, whole milk | CLIP | CLIP | CLIP | CLIP | CLIP | CLIP |
| shop milk,semi-skimmed, per 2 pints/1.136 litre | CLIP | CLIP | Unit Price | Unit Price | Unit Price | Unit Price |
| spreadable butter, 500g, 40-70% butter content | CLIP | CLIP | CLIP | CLIP | CLIP | CLIP |
| strawberries, per kg or per punnet | Unit Price | Unit Price | Unit Price | Unit Price | Unit Price | Unit Price |
| tea bags, per packet of 80, 250g | CLIP | CLIP | CLIP | CLIP | CLIP | CLIP |
| vodka, bottle | Unit Price | Unit Price | Unit Price | CLIP | Unit Price | Unit Price |
| whisky, bottle | CLIP | CLIP | CLIP | CLIP | CLIP | CLIP |
| white sliced loaf, branded | CLIP | CLIP | CLIP | CLIP | CLIP | CLIP |
| white wine, european, bottle | CLIP | CLIP | CLIP | CLIP | CLIP | Unit Price |
| wholemeal sliced loaf, branded | CLIP | CLIP | CLIP | CLIP | CLIP | CLIP |
| yoghurt, small individual | CLIP | CLIP | CLIP | CLIP | CLIP | Unit Price |
| yoghurt/fromage frais | CLIP | CLIP | CLIP | CLIP | CLIP | CLIP |
| Source: Office for National Statistics | ||||||