1. Standard errors
If the PPI was based on a census of every business in the UK, where every survey was returned correctly and on time, then the true values of price movements would be known. However, since the PPI is based on a sample of UK businesses, it means that population price movements are estimates and are subject to sampling variability. Sampling variability means that if a different set of businesses had been sampled, then a different estimate would have resulted. Exactly how much these would differ, by taking different samples, cannot be measured directly but is approximated using a standard error (calculated as the square root of the variance of the estimate). Standard errors are used to show the spread of price movements and are one way of assessing the accuracy of a price index. The lower the standard error for a given price index, the more confident one can be that the estimated index is close to the true value for the price index had all UK businesses been included.
Back to table of contents2. 12-month growth
Table 1 presents 12-month growth rates along with standard errors for the all manufacturing PPI (GSO including duty) and divisional level PPIs. The standard errors have been calculated for each division by creating standard errors for each 12-month growth rate covering the period December 2014 and November 2015 and then taking the arithmetic mean of the 12 individual standard errors.
Table 1: 12-month growth rates with standard errors
| December 2014 to November 2015 | |||
| SIC Division | Division Description | 12-month growth rate (Nov 2014 to Nov 2015) (%) | Standard error of the 12-month growth, Dec 2014 to Nov 2015 (% points) |
| All Manufacturing | -1.5 | 0.2 | |
| 10 | Food products | -1.5 | 0.7 |
| 11 | Beverages | 0.2 | 1.0 |
| 12 | Tobacco | 3.9 | 1.5 |
| 13 | Textiles | -0.5 | 0.5 |
| 14 | Wearing apparel | 1.0 | 1.0 |
| 15 | Leather and related products | -4.0 | 2.5 |
| 16 | Wood, products of wood and cork, except furniture; articles of straw and plaiting materials | -0.2 | 0.8 |
| 17 | Paper and paper products | -0.6 | 0.4 |
| 18 | Printing and recording services, printed matter | 0.9 | 0.9 |
| 19 | Coke and refined petroleum products | -16.5 | 0.0 |
| 20 | Chemicals and chemical products | -4.2 | 0.8 |
| 21 | Basic pharmaceutical products and preparations | 1.0 | 2.1 |
| 22 | Rubber and plastic products | -0.4 | 1.3 |
| 23 | Other non-metallic mineral products | 1.8 | 0.8 |
| 24 | Basic metals | -10.9 | 1.8 |
| 25 | Fabricated metal products, except machinery and equipment | 0.6 | 0.3 |
| 26 | Computer, electronic and optical products | 0.3 | 0.6 |
| 27 | Electrical equipment | -0.1 | 0.5 |
| 28 | Machinery and equipment NEC | 0.8 | 0.5 |
| 29 | Motor vehicles, trailers and semi trailers | -1.3 | 0.5 |
| 30 | Other transport equipment | 1.0 | 1.4 |
| 31 | Furniture | 1.7 | 0.6 |
| 32 | Other manufactured goods NEC | 0.7 | 0.9 |
| 33 | Repair and installation services of machinery and equipment | 4.2 | 1.0 |
| Source: Office for National Statistics | |||
| Notes: | |||
| 1. Standard errors for all divisions are calculated as 12-month arithmetic mean. | |||
| 2. In the case of division 19, the standard error has been assumed to be zero (as explained below). | |||
| 3. Imputed values were used in the calculation of index values used to calculate the 12-month growth rates. | |||
Download this table Table 1: 12-month growth rates with standard errors
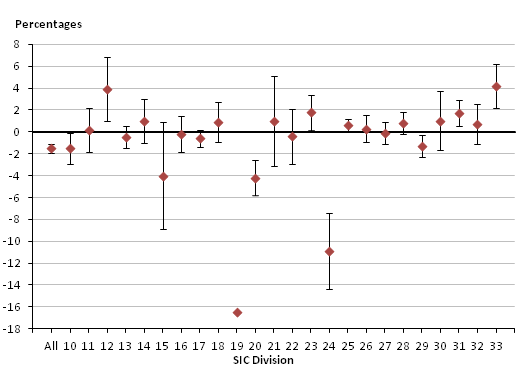
.xls (28.2 kB)The divisions with the largest standard error values include divisions: 15 ‘Leather and related products’; 21 ‘Basic pharmaceutical products and preparations’; and 24 ‘Basic metals’. These divisions had 12-month growth standard errors of 2.5, 2.1 and 1.8 respectively. These divisions also had a high standard error for month-on-month growth. This is because there was a large amount of variability in the price movements seen for items included in these divisions. This variability was seen between consecutive months and between each month and the same month a year previously.
Divisions with standard error noticeably higher than the mean (0.9) include: 12 ‘Tobacco’; 22 ‘Rubber and plastic products’; and 30 ‘Other transport equipment’. These divisions had 12-month growth standard errors of 1.5, 1.3 and 1.4 respectively. Unlike the 3 divisions with the largest standard error for 12-month growth, these divisions had low standard errors for the month-on-month growth. This suggests that there is relatively little variation in the price relatives between months but a larger amount of variation between years. Figure 1 shows the 12-month growth rates for each SIC division with 95% confidence intervals calculated as ± 2 standard errors. This chart highlights the divisions, as described above, with the largest standard errors.
Figure 1: 12 month growth rates by SIC division with 95% confidence interval
December 2014 to November 2015, UK
Source: Office for National Statistics
Download this image Figure 1: 12 month growth rates by SIC division with 95% confidence interval
.png (14.6 kB) .xls (31.2 kB)
3. Month-on-month growth
Table 2 presents month-on-month growth rates along with standard errors for the all manufacturing PPI (GSO including duty) and the divisional level PPIs. The standard errors have been calculated for each division by calculating standard errors for each month-on-month growth rate over the period December 2014 to November 2015 and then taking an arithmetic mean of the 12 individual standard errors.
Table 2: Month-on-month growth rates; by division with standard errors
| December 2014 to November 2015 | ||||
| SIC Division | Division Description | Month-on-month growth rate (Oct 2015 to Nov 2015) (%) | Standard error of the month-on-month growth, Dec 2014 to Nov 2015 (% points) | The number of periods used to calculate the standard error of month-on-month growth |
| All Manufacturing | -0.2 | 0.1 | 12 | |
| 10 | Food products | -0.2 | 0.2 | 12 |
| 11 | Beverages | -0.1 | 0.3 | 12 |
| 12 | Tobacco | 0.3 | 0.2 | 6 |
| 13 | Textiles | 0.1 | 0.1 | 11 |
| 14 | Wearing apparel | -0.6 | 0.3 | 11 |
| 15 | Leather and related products | 0.0 | 0.8 | 11 |
| 16 | Wood, products of wood and cork, except furniture; articles of straw and plaiting materials | 0.0 | 0.2 | 12 |
| 17 | Paper and paper products | -0.1 | 0.1 | 11 |
| 18 | Printing and recording services, printed matter | 0.2 | 0.2 | 12 |
| 19 | Coke and refined petroleum products | -0.9 | 0.0 | N/A |
| 20 | Chemicals and chemical products | -0.6 | 0.2 | 12 |
| 21 | Basic pharmaceutical products and preparations | -0.1 | 0.4 | 11 |
| 22 | Rubber and plastic products | -0.3 | 0.2 | 12 |
| 23 | Other non-metallic mineral products | -0.1 | 0.2 | 12 |
| 24 | Basic metals | 0.1 | 0.6 | 12 |
| 25 | Fabricated metal products, except machinery and equipment | -0.1 | 0.1 | 11 |
| 26 | Computer, electronic and optical products | -0.1 | 0.1 | 12 |
| 27 | Electrical equipment | 0.1 | 0.1 | 12 |
| 28 | Machinery and equipment NEC | 0.0 | 0.1 | 12 |
| 29 | Motor vehicles, trailers and semi trailers | -0.5 | 0.1 | 11 |
| 30 | Other transport equipment | 0.3 | 0.2 | 12 |
| 31 | Furniture | 0.3 | 0.1 | 11 |
| 32 | Other manufactured goods NEC | 0.5 | 0.3 | 11 |
| 33 | Repair and installation services of machinery and equipment | 0.2 | 0.3 | 11 |
| Source: Office for National Statistics | ||||
| Notes: | ||||
| 1. Standard errors have not been calculated as an arithmetic mean across all 12 month-on-month growth rates due to missing data. The number of periods that have been used to calculate the standard error are indicated in the table. | ||||
| 2. In the case of division 19, the standard error has been assumed to be zero (as explained below). | ||||
| 3. Imputed values were used in the calculation of index values used to calculate the 12-month growth rates. | ||||
Download this table Table 2: Month-on-month growth rates; by division with standard errors
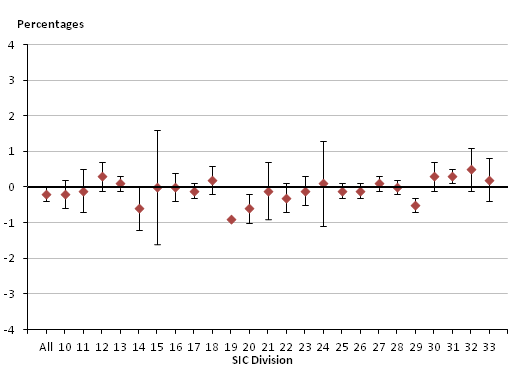
.xls (57.9 kB)The division with the largest standard error for month-on-month growth was division 15 ‘Leather and other related products’ which had a standard error of 0.8. The main reasons for this were volatile price movements and the fact that the growth is calculated from a relatively small sample of items. However, it is also worth noting that the 2 indices feeding into division 15 show quite different price movements over the past 12 months. While the index for ‘Tanned and dressed leather’ fell by 7.3% in the year to November 2015, the index for ‘Footwear’ increased by 4.3% over the same period. This variation in the direction of growth rates will also impact the standard error.
The mean standard error for the month-on-month growth for all divisions was 0.2. Division 21 ‘Basic pharmaceutical products and preparations’ had a standard error for the month-on-month growth that was greater than the mean, with a value of 0.4. This is due to the large variation of price movements that is common with products in the pharmaceutical industry. The standard error value for the month-on-month growth of division 24 ‘Basic metals’ was 0.6, which is 3 times the mean value. This is likely to be as a result of the fact that the underlying price data is collected from a single published source, which restricts the variety of items that can be collected.
Figure 2: Month-on-month growth rates by SIC division with 95% confidence interval
December 2014 to November 2015, UK
Source: Office for National Statistics
Download this image Figure 2: Month-on-month growth rates by SIC division with 95% confidence interval
.png (12.2 kB) .xls (31.2 kB)
4. Standard error for division 19 – coke and refined petroleum products
For division 19 ‘Coke and refined petroleum products’, the standard error has been set to zero, rather than being calculated from the source data. This is because prices for this division are collected on behalf of ONS by the Department for Energy and Climate Change (DECC) and are shared with us at an aggregate level only. As a result, we do not hold the individual prices required to calculate a standard error for this division.
The survey issued by DECC to collect prices for this division covers around 98% of all turnover for coke and refined petroleum products. As a result of this high coverage, any sampling error is likely to be minimal and therefore close to zero.
Back to table of contents5. Index values – all manufacturing
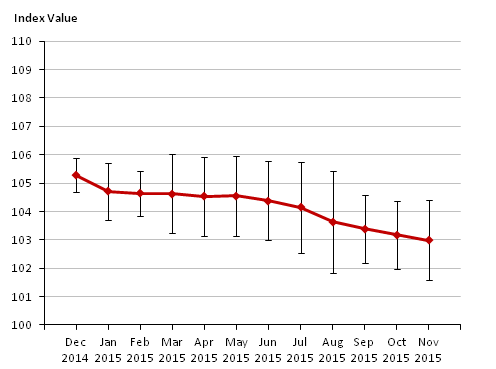
Figure 3 shows the all manufacturing (GSO including duty) index values along with their corresponding 95% confidence intervals for the period December 2014 to November 2015. This shows that the confidence intervals are fairly consistent for the months March to July, although they appear to be slightly smaller between December 2014 and February 2015.
Figure 3 shows the all manufacturing (GSO including duty) index values along with their corresponding 95% confidence intervals for the period December 2014 to November 2015. This shows that the confidence intervals are fairly consistent for the months March to July, although they appear to be slightly smaller between December 2014 and February 2015.
Figure 3: All manufacturing (GSO including duty) index values with 95% confidence intervals
December 2014 to November 2015, UK
Source: Office for National Statistics
Download this image Figure 3: All manufacturing (GSO including duty) index values with 95% confidence intervals
.png (12.7 kB) .xls (27.6 kB)
6. Conclusions
Standard errors were found to be broadly similar for all SIC divisions that are aggregated to form the GSO index for all manufacturing with a few exceptions.
The divisions 15 ‘Leather and related products’, 21 ‘Basic pharmaceutical products and preparations’ and 24 ‘Basic metals’ had the highest standard error values for 12-month growth. These three divisions also had the largest standard error values for month-on-month growth. This is as a result of volatile item prices within these divisions.
Where standard errors were calculated for index values for growths, it was found that, for all manufacturing, standard errors remained relatively similar in size throughout the period December 2014 to November 2015.
Back to table of contents