Table of contents
- Main points
- Statistician’s comment
- Summary
- Consumer prices for food and non-alcoholic beverages remain relatively unchanged in 2018
- Fuels and home-produced food are putting upward pressure on 12-month growth of input producer prices
- Trends in new and existing builds differ between countries of the UK
- Authors
1. Main points
The 12-month growth rate of the Consumer Prices Index including owner occupiers’ housing costs (CPIH) fell to 2.2% in September 2018, with the largest downward contributions coming from food and non-alcoholic beverages, transport services, recreation and culture, and clothing.
The 12-month growth rate of the input Producer Price Index rose to 10.3% in September 2018, with fuels and home-produced food contributing strongly to the rise.
Average prices for new-build properties are higher than those for existing properties in all four countries of the UK, although patterns of price movements and sales volumes vary.
2. Statistician’s comment
Commenting on today’s inflation figures, Head of Inflation Mike Hardie said:
“Food was the main downward pull on inflation as last year’s September price rises failed to reappear, while ferry prices dropped after their surprisingly high summer peak. However, it wasn’t all one-way traffic with energy suppliers pushing up their prices.
“UK house prices again increased across the year with growth particularly strong in the East and West Midlands. We continued to see a slowdown in London and the East of England.”
Back to table of contents3. Summary
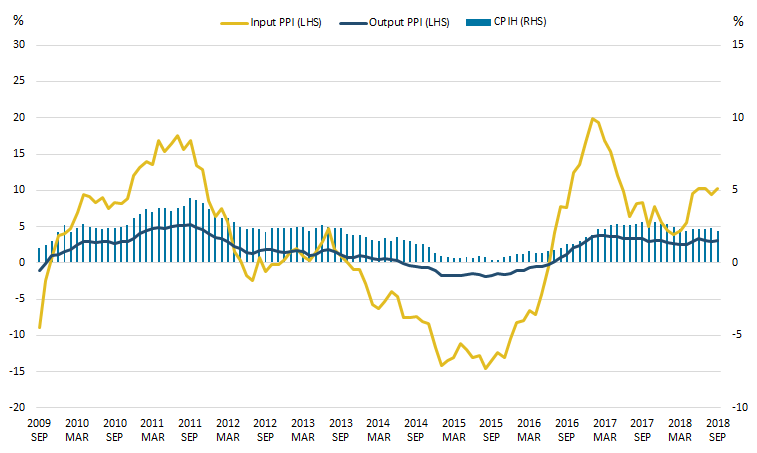
Figure 1 shows that the 12-month growth rate of the Consumer Prices Index including owner occupiers’ housing costs (CPIH) was 2.2% in September 2018, down from 2.4% in August 2018. The largest downward drivers of the change in the 12-month growth rate of CPIH were food, recreation and culture, transport services, and clothing, which were partially offset by upward contributions from electricity, gas and other fuels.
The input Producer Price Index (input PPI) grew by 10.3% in the 12 months to September 2018, up from 9.4% in the 12 months to August 2018. While crude oil makes the largest overall contribution to the 12-month growth rate, the 0.9 percentage point increase has been driven by increases in the 12-month growth rates for fuel and home-produced food. The output Producer Price Index (output PPI) grew by 3.1% in the 12 months to September 2018, up from 2.9% in the 12 months to August 2018. The largest upward contribution to output PPI was made by petroleum products.
Figure 1: 12-month growth rates for input PPI and output PPI (left-hand side), and CPIH (right-hand side)
UK, September 2009 to September 2018
Source: Office for National Statistics
Notes:
- These data are also available within the Dashboard: Understanding the UK economy.
Download this image Figure 1: 12-month growth rates for input PPI and output PPI (left-hand side), and CPIH (right-hand side)
.png (27.4 kB) .xlsx (20.3 kB)
4. Consumer prices for food and non-alcoholic beverages remain relatively unchanged in 2018
Figure 2 shows how prices for the food and non-alcoholic beverages component of the Consumer Prices Index including owner occupiers’ housing costs (CPIH) have moved across the year between 2012 and 2018, with prices indexed to the January of each year. Prices have remained relatively unchanged so far in 2018, which is unusual given that in previous years prices have tended to either increase or decrease fairly consistently over the year. Food made the largest downward contribution to the movement in the 12-month growth rate of CPIH this month, reflecting a slight fall in prices between August and September 2018, but also a base effect as prices increased between August and September 2017.
Figure 2: Index of the food and non-alcoholic beverages component of CPIH
UK, January 2012 to September 2018
Source: Office for National Statistics
Download this chart Figure 2: Index of the food and non-alcoholic beverages component of CPIH
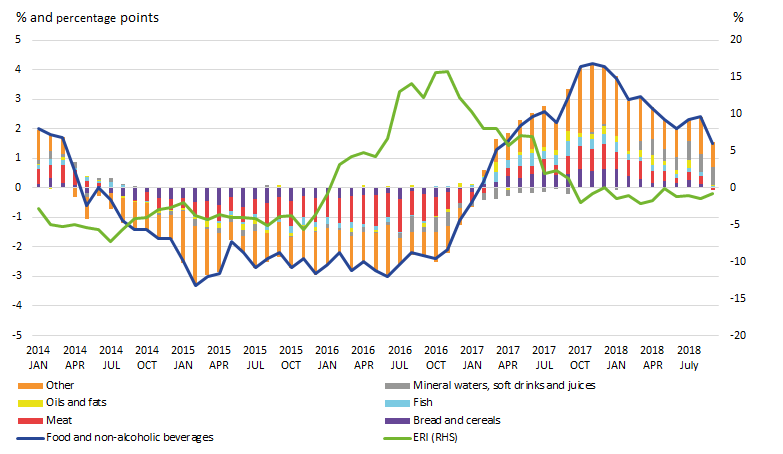
Image .csv .xlsThere is no obvious seasonal pattern to price changes for food and non-alcoholic beverages overall so it is useful to look at longer-term trends. Figure 3 shows movements in the 12-month growth rate of the food and non-alcoholic beverages component of CPIH and contributions to the 12-month growth rate from individual components of food and non-alcoholic beverages, as well as the inverted sterling effective exchange rate (ERI).
The 12-month growth rate for food and non-alcoholic beverages has been broadly decreasing since December 2017 and is currently at its lowest rate since March 2017. This trend reflects falling contributions to the 12-month growth rate from a number of different components, with notable decreases coming from meat, bread and cereals, and coffee, tea and cocoa. An exception to this downward trend is mineral waters, soft drinks and juices, which have made a broadly increasing contribution to the 12-month growth rate of food and non-alcoholic beverages in recent months and have consistently contributed the most to the 12-month growth rate since April 2018. The Soft Drinks Industry Levy was introduced in April 2018, which increased the tax payable on soft drinks with more than 5 grammes per 100 millilitres of added sugar, although price increases were also seen in drinks not affected by the new levy.
Figure 3: Contributions to the 12-month growth rate of food and non-alcoholic beverages (left-hand side) and the inverted sterling effective exchange rate (ERI) (right-hand side)
UK, January 2014 to September 2018
Source: Office for National Statistics, Bank of England
Notes:
The “other” component includes: milk, cheese and eggs; fruit; vegetables; sugar, jam, syrups, chocolate and confectionery; food products (not elsewhere covered) and coffee, tea and cocoa.
Contributions to the 12-month growth rate of food and non-alcoholic beverages may not sum exactly due to rounding.
Download this image Figure 3: Contributions to the 12-month growth rate of food and non-alcoholic beverages (left-hand side) and the inverted sterling effective exchange rate (ERI) (right-hand side)
.png (27.5 kB) .xlsx (22.7 kB)
Recent growth in prices for food and non-alcoholic beverages follows a sustained period of negative 12-month growth rates between May 2014 and January 2017. The 12-month growth rate increased sharply from November 2016 and continued to increase until November 2017, when it reached a recent peak of 4.2%. These movements are broadly reflective of changes in the exchange rate over the period, with the inverted effective exchange rate (representing the value of sterling) falling sharply from November 2016. As food and non-alcoholic beverage prices are relatively import intensive – at least 25% of the price of each component of food and non-alcoholic beverages is accounted for by either direct or indirect imports – they can be quite responsive to movements in the exchange rate. More recently, the exchange rate has been relatively stable while the 12-month growth rate of food and non-alcoholic beverages has been broadly decreasing.
Back to table of contents5. Fuels and home-produced food are putting upward pressure on 12-month growth of input producer prices
Figure 4 shows the 12-month growth rate in the input Producer Price Index (PPI) since January 2015, broken down into the percentage point contribution from movement in the current month and the remaining contribution from the comparison with the base index assuming no change in the current month (a form of base effect). As the 12-month growth rate compares current prices with those in the same month a year ago, this approach lets us separate out the base effect and the current month effect. To do this we calculate what the 12-month growth rate of prices would have been if prices had not changed this month (by using the previous month’s price level) to determine the base effect, and subtract this from the actual 12-month growth rate to approximate the current month effect.
Current month effects have made a varying contribution to the 12-month growth rate of input PPI over the period.
In May 2018, changes in the current month had a large effect on the 12-month growth rate, contributing around 3.39 percentage points to the 9.6% growth rate. When the 12-month growth rate then increased to 10.3% in the following two months, base effects were the biggest driver – the current month contributed only 0.28 percentage points to the rate in June 2018 and made no contribution in July 2018.
At other times current month changes have moved in the opposite direction to the base effect meaning that, for example, the 12-month growth rate remained positive in March to June 2017 when current prices were falling, and conversely prices rose in February to June 2016 while the 12-month growth rate was negative.
In the most recent two months, current month changes are again having an upward effect on the 12-month growth rate.
Figure 4: 12-month growth rate in input PPI, by current month and base effects, and inverted 12-month sterling effective exchange rate growth rate (ERI)
UK, January 2015 to September 2018
Source: Office for National Statistics, Bank of England
Download this chart Figure 4: 12-month growth rate in input PPI, by current month and base effects, and inverted 12-month sterling effective exchange rate growth rate (ERI)
Image .csv .xlsThe input PPI grew by 10.3% in the 12 months to September 2018, up from 9.4% in the 12 months to August 2018. This increase has been driven largely by increases in the 12-month growth rates for fuel and home-produced food. The 12-month growth rate of the input Producer Price Index rose to 10.3% in September 2018 with fuels and home-produced food contributing strongly to the rise; home-produced food refers to products of the UK agricultural sector (such as meat, crops and so on) that are used as inputs into the UK food manufacturing industry. Figure 4 also shows the inverted sterling effective exchange rate, which measures the value of sterling relative to a basket of other currencies. The 12-month growth rate for input PPI often broadly follows trends for the inverted effective exchange rate as imports make up around two-thirds of the input PPI basket. However, trends often also reflect other factors such as global prices for crude oil and other fuels, both in the current period and in the base period 12 months before.
Figure 5 shows the contributions of base effects and current month changes to the 12-month growth rate for the crude oil component of input PPI. 12-month growth rates for crude oil follow broadly similar trends to overall input PPI as crude oil is often one of the main drivers of changes in input PPI. The relatively high 12-month growth rates of crude oil in June and July 2018 were driven almost entirely by base effects, as prices were considerably lower the previous year, which in turn drove the relatively high 12-month growth rates of input PPI. Similarly, the recent falls in the 12-month growth rate reflect base effects as prices increased for crude oil in August and September 2018 but had increased by more in August and September 2017, leading to a falling growth rate.
Figure 5: 12-month growth in the oil component of input PPI, by current month and base effects
UK, January 2015 to September 2018
Source: Office for National Statistics
Download this chart Figure 5: 12-month growth in the oil component of input PPI, by current month and base effects
Image .csv .xlsFigure 6 shows the contributions of base effects and current month changes to the 12-month growth rate for the fuel component of input PPI. The 12-month growth rate of fuel rose sharply to 15.2% in September 2018, driven in large part by current month changes, with the base effect increasing only slightly between August and September 2018. Rising gas prices are common for this time of year but recent increases in fuel prices also in part reflect the increase in oil prices, which feed through to gas prices, as well as strikes and maintenance stoppages from July 2018 onwards that caused supply cuts.
Figure 6: 12-month growth in the fuel component of input PPI, by current month and base effects
UK, January 2015 to September 2018
Source: Office for National Statistics
Download this chart Figure 6: 12-month growth in the fuel component of input PPI, by current month and base effects
Image .csv .xls6. Trends in new and existing builds differ between countries of the UK
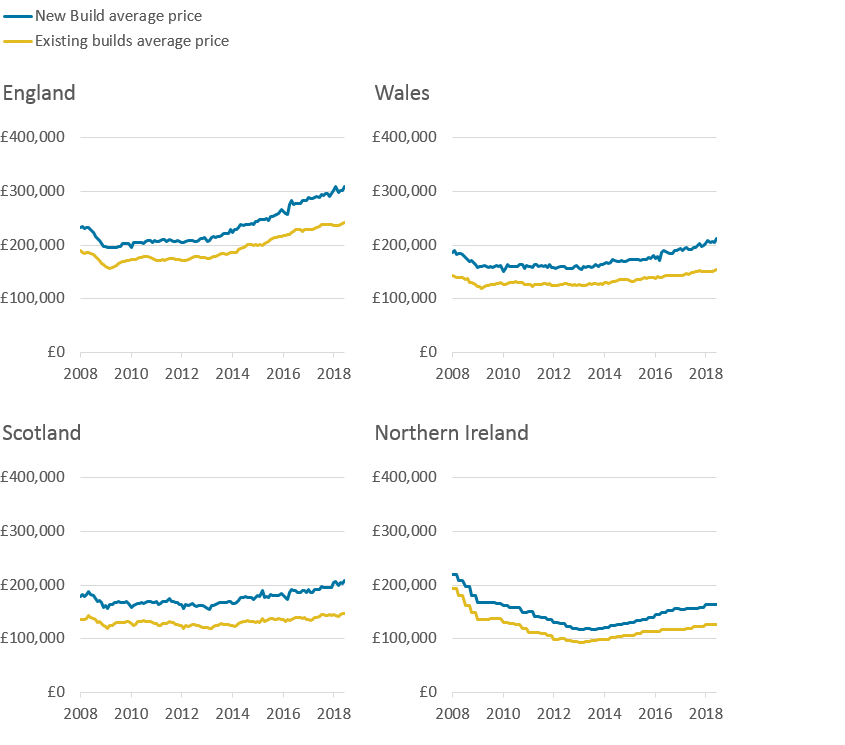
Average house prices in England continued to exceed those of the other countries in the UK at £250,000 in August 2018, with Scotland and Wales having average prices of £153,000 and £162,000, respectively. Average prices in Northern Ireland for Quarter 2 (Apr to June) 2018 were £133,000. Figure 7 shows the average price for new builds and existing properties for each country since January 2008.
Figure 7: Average prices for new and existing builds by country
UK, January 2008 to June 2018
Source: Office for National Statistics, HM Land Registry
Notes:
- Northern Ireland data are only available on a quarterly basis. Northern Ireland data are copied forward until the next quarter’s data are available.
Download this image Figure 7: Average prices for new and existing builds by country
.png (34.9 kB) .xlsx (22.9 kB)
Average prices for new-build properties have been consistently higher than average prices for existing properties in all four countries over the period. Average house prices fell across the board during the 2008 to 2009 economic downturn, with most beginning to recover in early 2009, but only showing substantial recovery in 2013 and 2014. House prices in Northern Ireland continued to broadly decline until mid-2013, with prices only starting to pick up consistently from October 2013.
The recent rise in prices for new-builds may be driven partly by demand for new-build properties through the Help to Buy scheme. Introduced in 2013, Help to Buy offers buyers with a 5% deposit an interest-free loan of up to 20% of the value of most new homes in the UK. Help to Buy in England provides a loan for new-build properties up to the value of £600,000, in Wales up to the value of £300,000 and in Scotland a 15% loan is available for properties up to the value £200,000 in 2018 to 2019. The Northern Ireland co-own scheme offers buyers a 50% to 90% share of a property, with buyers paying rent on the remaining share.
Since early 2016, the trends in new and existing property prices have diverged slightly with new-build prices increasing by more than existing builds. In August 2018, the biggest percentage difference in average prices for new and existing builds was in Scotland, with England having the least difference. Average prices in England may partly reflect the relative weight of London, as prices for new-builds and existing properties are more similar in London than in the rest of the UK.
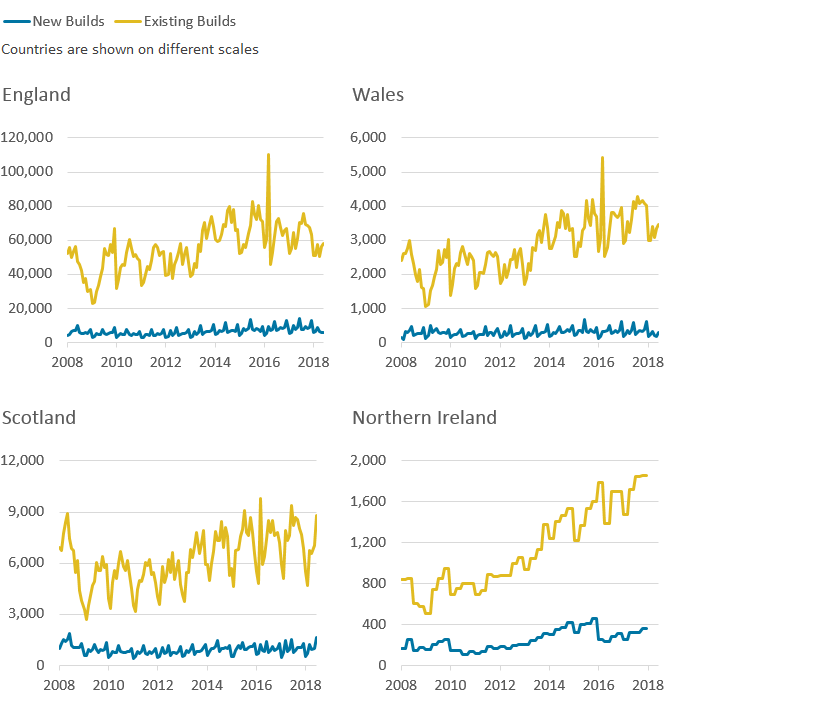
Figure 8 shows the sales volumes for new and existing builds from January 2008 to June 2018 for England, Scotland and Wales, and to December 2017 for Northern Ireland (the latest available data).
Figure 8: Sales volumes for new and existing builds by country
UK, January 2008 to June 2018
Source: Office for National Statistics, HM Land Registry
Notes:
- Northern Ireland data are only available until December 2017.
- Northern Ireland data are only available on a quarterly basis. The quarterly data have been equally split into each of the three months.
Download this image Figure 8: Sales volumes for new and existing builds by country
.png (65.8 kB) .xlsx (24.3 kB)
Sales volumes growth varies more than house prices, with short-term spikes and falls in particular having less of an effect on prices. This effect is less clear in Northern Ireland due to the data being available only quarterly. Sales volumes in all four countries fell during the 2008 to 2009 economic downturn (most notably for existing properties), but have since been broadly increasing. New-builds make up a much smaller proportion of total sales than existing properties but have followed broadly similar trends over the period.
Differences in sales volumes for new and existing builds may reflect supply-side differences as existing property owners are more able to respond in the short-term to policy changes or price changes, whereas the supply of new-build properties is subject to other factors such as long-term investments, planning permission and building times, which cannot always be changed quickly in response to market factors.
Sales volumes for existing properties increased sharply in England and Wales in March 2016, before falling back in April 2016, which coincided with the introduction of a higher rate of Stamp Duty on additional properties in April 2016. With the introduction of the higher Stamp Duty rate on additional residential properties, purchasing an additional property incurred an extra 3% Stamp Duty rate on top of the existing Stamp Duty in England, Wales and Northern Ireland. The same trend is shown in Scotland when the Land and Building Transaction Tax (LBTT) Additional Dwelling Supplement (ADS) of 3% came into force, payable on the total purchase price of an additional dwelling of £40,000 or more. A similar trend is shown in Northern Ireland, with quarterly data muting the trend.
Back to table of contents