Table of contents
1. Main points
The 12-month growth rates of the Consumer Prices Index including owner occupiers’ housing costs (CPIH), the input Producer Price Index (PPI) and the output PPI all slowed between January and February 2020.
Prices for the crude oil component of input PPI and the fuels and lubricants component of CPIH both fell between January and February 2020, reflecting a fall in global prices for crude oil.
The fall in prices for fuels and lubricants in CPIH was more muted than that for crude oil, as is usually the case, as they also reflect other factors including tax, transport and retail costs.
The fall in the price of crude oil likely reflects a fall in demand from China during the COVID-19 outbreak, on top of the usual fall in demand during Chinese New Year.
Prices for imported metals have put upward pressure on the 12-month growth rate of input PPI in February, largely offsetting the downward pull from crude oil and imported chemicals.
2. Statistician’s comment
Commenting on today’s inflation figures, ONS Head of Inflation Mike Hardie said:
“There was a slight slowing in the rate of inflation due mainly to falling prices for motor fuels and computer games.
“Annual house prices continued to show growth across most of the UK, but tailed off from the increases seen last month. Yorkshire and the Humber saw the highest annual growth, but three English regions fell, with the East of England seeing the biggest decrease.”
Back to table of contents3. The future of the Prices economic commentary
Following a review of our outputs over recent months, the way we publish our prices content is changing. From April 2020 the Prices economic commentary will no longer be published as an individual publication, instead, economic commentary will be included in each of the main monthly prices bulletins (consumer prices, producer prices and house prices).
This is intended to streamline the number of publications we produce, making it clearer and simpler for users to find economic context for the main prices data. In addition, more detailed economic analysis of prices data will be published on a quarterly basis starting in spring 2020. We welcome feedback on these changes via economic.advice@ons.gov.uk.
Back to table of contents4. Summary
Figure 1 shows the 12-month growth rate of the Consumer Prices Index including owner occupiers’ housing costs (CPIH), which was 1.7% in February 2020, down from 1.8% in January 2020.
Downward contributions to the change in the annual rate came from housing and household services; alcohol and tobacco; furniture, household equipment and maintenance; and food and non-alcoholic beverages. An upward contribution to the change came from restaurants and hotels.
There was a negligible contribution from transport overall but, within the category, a downward contribution from motor fuels was offset by upward contributions from second-hand cars and sea fares. Most categories registered small changes in contributions across the range.
The output Producer Price Index (PPI) grew by 0.4% in the 12 months to February 2020, down from growth of 1.0% in January 2020. The annual growth rate has been positive since July 2016, with 7 out of 10 products providing upward contributions to the annual rate of output inflation.
The input Producer Price Index (PPI) fell by 0.5% in the 12 months to February 2020, down from growth of 1.6% in January 2020. This is the lowest 12-month growth rate since November 2019, with crude oil providing the largest downward contribution to the annual rate of input inflation.
Figure 1: The 12-month growth rates of CPIH, input PPI, and output PPI all fell between January 2020 and February 2020
12-month growth rates for input Producer Price Index (PPI) (left-hand side), output PPI (left-hand side), and Consumer Prices Index including owner occupiers' housing costs (CPIH) (right-hand side), UK, February 2011 to February 2020, %

Source: Office for National Statistics – Producer Price Index and Consumer Prices Index including owner occupiers' housing costs
Notes:
- These data are also available within the Dashboard: Understanding the UK economy.
Download this image Figure 1: The 12-month growth rates of CPIH, input PPI, and output PPI all fell between January 2020 and February 2020
.png (15.8 kB) .xlsx (21.2 kB)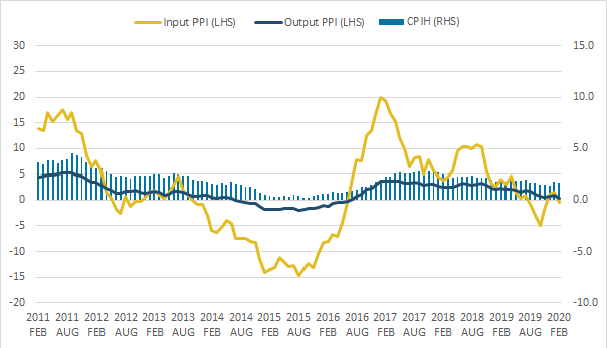
5. The crude oil component of input PPI has fallen, in line with global prices for crude oil
Global prices for Brent crude oil have fallen sharply in the beginning of this year, from an average of US $65.85 per barrel in December 2019, to $63.60 per barrel in January 2020 and $55.00 per barrel in February 2020.
Figure 2 shows movements in the price of Brent crude oil, as an index, alongside the crude oil component of the input Producer Price Index (PPI) and the fuels and lubricants component of the Consumer Prices Index including owner occupiers’ housing costs (CPIH), which includes prices at the pump.
Prices for the crude oil component of input PPI move very much in line with global prices for Brent crude oil, with the gap between the two reflecting the exchange rate, as Brent crude oil is priced in US dollars. As such, the crude oil component of input PPI has also fallen sharply over the last two months, with prices falling by around 15.8% between December 2019 and February 2020.
Figure 2: Crude oil prices have fallen sharply in recent months with fuels and lubricants prices also falling slightly in February 2020
The indices of Brent crude oil prices, the crude oil component of input PPI and the fuels and lubricants component of CPIH, UK, January 2015 to February 2020, January 2015 = 100
Source: Office for National Statistics – Consumer Prices Index including owner occupiers’ housing costs, Producer Price Index and World Bank – Monthly Brent crude oil prices (January 2015 = 100)
Download this chart Figure 2: Crude oil prices have fallen sharply in recent months with fuels and lubricants prices also falling slightly in February 2020
Image .csv .xlsPrices for the fuels and lubricants component of CPIH also follow broadly similar trends to Brent crude oil but are considerably more muted as they include other costs such as Fuel Duty, transport and retail costs. Fuels and lubricants include diesel, multigrade lubricants and petrol.
Prices for fuels and lubricants rose slightly between December 2019 and January 2020 but have since fallen by 2.1% between January and February 2020.
Figure 3 shows 12-month growth rates for these components and shows more clearly how growth in the crude oil component of input PPI tracks that of Brent crude oil. Prices for both have fallen over the year, with prices for the crude oil component of input PPI and Brent crude oil, respectively, being 8.7% and 14.2% lower than in February 2019. The 12-month growth rate of the fuels and lubricants component of CPIH remains positive, with prices in February 2020 being 2.8% higher than in February 2019.
Figure 3: Prices for the crude oil component of input PPI and Brent crude oil fell on the year while prices for fuels and lubricants rose
The 12-month growth rates of Brent crude oil prices, the crude oil component of input PPI and the fuels and lubricants component of CPIH, UK, January 2015 to February 2020, %
Source: Office for National Statistics – Producer Price Index and Consumer Prices Index including owner occupiers' housing costs and World Bank - Monthly Brent crude oil prices
Download this chart Figure 3: Prices for the crude oil component of input PPI and Brent crude oil fell on the year while prices for fuels and lubricants rose
Image .csv .xls6. Imported metals largely offset the downward effect of crude oil and other components of input PPI
Figure 4 shows contributions to the 12-month growth rate of input PPI from each of the components of the index. Crude oil is typically the largest driver of the 12-month growth rate as it accounts for a large proportion of total input PPI and has relatively volatile prices.
Crude oil was, likewise, the biggest driver of the fall in the 12-month growth rate of input PPI from January to February 2020, making a downward contribution of 1.27 percentage points. Offsetting this fall, however, was a large upward contribution from imported metals, which contributed 1.49 percentage points to the 12-month growth rate of input PPI in February 2020.
Prices for crude oil typically reflect a range of factors, including geopolitical events around the world. The fall in prices in February 2020 likely reflects, in part, China’s reduced demand for oil during the COVID-19 outbreak and extended factory closures following Lunar New Year. Reduced output from China’s manufacturing sector in February 2020 and travel restrictions within the country is reported to have led to lower direct demand for oil, as well as lower demand for shipping from one of the world’s largest exporting countries.
Figure 4: The 12-month growth rate of input PPI fell between January 2020 and February 2020
Contributions to the 12-month growth rate of input PPI, the 12-month growth rates of input PPI, UK, January 2018 to February 2020, % and percentage points
Source: Office for National Statistics – input Producer Price Index
Notes:
- Contributions may not sum due to revisions to data and rounding.
Download this chart Figure 4: The 12-month growth rate of input PPI fell between January 2020 and February 2020
Image .csv .xlsImported metals also made a large positive contribution to the 12-month growth rate of input PPI in January 2020, driven by increasing prices for palladium and rhodium. Other positive contribtions came from fuel (including the Climate Change Levy), imported food and home produced materials.
Back to table of contents