1. Executive summary
Office for National Statistics (ONS) used Value Added Tax (VAT) turnover data from 630,000 businesses within gross domestic product (GDP) estimates, for the first time on 22 December 2017. Representing a significant advance in the transformation of UK National Accounts and short-term output economic indicators.
In this article, we will give background information as to:
- the usage and history of VAT data in the national accounts
- comparison with other national statistical institutions’ experiences of using VAT turnover in the production of their business statistics
- detailed description as to the ONS short-term output surveys
- ONS short-term output surveys’ strengths and weaknesses in comparison with the administrative data source of VAT turnover data
- detailed processes and methodologies applied to the VAT dataset for incorporation into national accounts; these processes will detail the microdata processing at the VAT return level to the aggregate level processing
Finally, we will cover the next steps and development plans for further advance of VAT data usage. For information, a full impact assessment of incorporating VAT turnover in the national accounts for the first time can be found within the VAT turnover implementation into national accounts: December 2017 update article.
Back to table of contents2. Background to usage of VAT turnover data in the national accounts
2.1 Why use VAT turnover data in the national accounts?
Office for National Statistics (ONS) is committed to addressing the strategic recommendations made in the Independent review of UK Economic Statistics by Professor Sir Charles Bean, which is in line with our Economic Statistics and Analysis Strategy (ESAS).
Independent review of UK Economic Statistics
This independent review provided the main reason for including Value Added Tax (VAT) turnover data within the national accounts, in its suggestion in section 2.39, which said:
“Monthly VAT returns to HM Revenue and Customs (HMRC) on turnover and purchases of individual businesses, matched through an improved business register, has the potential to greatly enhance the output measure of gross domestic product (GDP).”
More generally, the use of VAT turnover data helps address two of the strategic recommendations set out in this review.
Strategic recommendation A is to address established statistical limitations. This recommendation talks about the scope for improving early estimates of GDP using administrative data sources.
Strategic recommendation D is to make the most of existing and new data sources and the technologies for dealing with them. This recommendation mentions how use of administrative data will lead to more accurate and timely statistics, whilst reducing the reporting burden for businesses.
Other reviews into short-term output indicators and national accounts
Several other reviews into short-term output indicators and national accounts over the last 20 years have also advocated the use of administrative data in statistical outputs.
The National Statistics Quality Review in Short-Term Output Indicators (2000) emphasised that VAT data should be used to check the validity of estimates within the short-term output indicators.
The Review of Statistics for Economic Policymaking (2003) (PDF, 384.7KB) recommended that “greater access for the ONS to administrative records, including tax data, could improve both regional and national data, while offering important savings in the compliance burden from survey forms sent to businesses.”
Additionally, the more recent National Statistics Quality Review: National Accounts and Balance of Payments (2014) (PDF, 570.9KB), suggested the following recommendations with regards to the use of administrative data. See pages 63 to 65 for more information.
Development Recommendation 14: ONS should actively pursue access to identifiable microdata from HMRC so that that it can apply more rigorous statistical techniques to the estimation of these important variables. Access to microdata should enable improvements in sample size and estimation such as stratification by size and region of domicile should be pursued. The pursuit of such microdata will be dependent on wider discussions on appropriate access to confidential information but the strong track record of ONS about guarding the confidentiality of the information it collects from businesses and persons should be considered by the relevant government departments in assessing the risk of broader access for the ONS.
Development Recommendation 15: It is recommended that the ONS pursue opportunities for expanded access to administrative data in general. This should include attention to the following aspects: maximum access to identifiable microdata to allow more rigorous statistical techniques and quality assurance; and opportunities to have administrative systems capture additional or improved data, particularly when administrative processes are undergoing reviews. This requires the co-operation of other administrative organisations to ensure ONS are aware of these opportunities.
UK Statistics Authority strategy – “Better Statistics, Better Decisions”
The project is also completely consistent with the UK Statistics Authority strategy for UK statistics – “Better Statistics, Better Decisions”.
The project is closely linked with the following objectives within the strategy.
Objective 6 – Develop and implement innovative methods
Objective 6 covers innovation and exploitation of new methods and data sources. Recent legislation has been approved that allows the data sharing between ONS and HMRC. Therefore, this new data source and method to ONS has the capacity to illustrate the benefits of cross-working between departments and to avoid unnecessary duplication.
Objective 7 – Demonstrate value for money
Objective 7 identifies how government can make better and more efficient use of public resources. HMRC turnover data can be used to replace or improve our survey sources. This has the potential to save money for ONS, but also has the benefit of reducing the burden on businesses that have completed a VAT return.
The use of the VAT turnover dataset is one of the first steps towards transforming the way that we use large externally-collected administrative data, instead of data collected via ONS survey. With the development and implementation of the VAT turnover dataset, we are beginning to deliver new technologies and creating methods that could deliver useful statistical data from a range of other externally-collected sources, including those from administrative data sources. For further information as to the transformation of ONS economic statistics, please see the following article Transforming short-term turnover statistics.
Following an internal review of our methodology and consultation with stakeholders, academic associates and international experts, we have agreed to combine output estimates from the Monthly Business Survey (MBS) and Monthly Survey of Construction Output (Construction) and the newly developed VAT turnover dataset. The MBS dataset for the largest businesses will continue to be used as it is timelier than the VAT dataset and we are able to gather business intelligence as part of the survey.
VAT turnover data are employed to improve coverage of smaller businesses for selected industries. This combines the strengths of the survey dataset, that is, timeliness and the ability to re-contact businesses to validate returns with the improved coverage and scope of VAT in the VAT dataset. Due to the long-term strategy to transform short-term turnover statistics as outlined in the article previously, a decision was made to remove UK Standard Industrial Classification 2007: SIC 2007 divisions 45, 46 and 47 from scope of the first wave of industries to use VAT turnover data.
2.2 Background information on a VAT return
VAT data are collected by HMRC as part of the taxation process. The data are held electronically and supplied to ONS as part of a Memorandum of Understanding between HMRC and ONS. The purpose of this agreement is to maintain the sampling frame known as the Inter-Departmental Business Register (IDBR) and for production of economic statistics and national accounts. The data can also be used for linking and analysis service for ONS and government departments to consume for statistical and research purposes.
VAT information is returned for all UK businesses with a turnover above the threshold, which, since April 2017, is £85,000, and for those businesses below the threshold that choose to do so. The form consists of nine boxes, shown in Table 1, of which we are interested in box 6.
Table 1: Question boxes on the Value Added Tax return
| Box | Definition |
|---|---|
| Box 1 | VAT that businesses are required to pay on goods and services supplied within the period (within the UK). |
| Box 2 | VAT that businesses are required to pay on acquisitions of goods from other EU member states] . |
| Box 3 | Total output tax that businesses are required to pay (sum of boxes 1 and 2). |
| Box 4 | Total input tax that businesses are entitledto claim for the period. |
| Box 5 | Net tax (the difference between boxes 3 and 4). |
| Box 6 | Total outputs (sales) excluding VAT (including sales to other EU member states) |
| Box 7 | Total inputs (purchases) excluding VAT (including purchases from other EU member states). |
| Box 8 | Total value of all sales of goods to other EU member states. |
| Box 9 | Total value of all purchases of goods from other EU member states. |
The datasets provided to ONS by HMRC each month contain the variables in Table 2. Using these variables it is possible to transform these data to a level which is comparable with ONS surveys. This process is described later in this article.
Table 2: Data provided to Office for National Statistics from HM Revenue and Customs each month
| Variable | Description |
|---|---|
| VAT period | Last month to which the VAT return relates to. |
| VAT reference | Nine-digit unique identifier for each VAT trader. |
| Record type | Determines what is being returned on the VAT return. |
| Stagger | Number between 0 and 15 detailing the month(s) in which HMRC expect returns for the given VAT reference. |
| VAT SIC | UK SIC 2007 that has been assigned to the unit by HMRC. |
| Turnover | Total value (excluding VAT) of goods and services supplied in the period. |
| Expenditure | Total value (excluding VAT) of goods and services purchased in the period. |
| Receipt date | Date on which return was received by HMRC. |
One important feature of the dataset is the periodicity of its returns. VAT returns are returned monthly, quarterly, or annually, on a variety of different staggers, as shown in Table 4. Most businesses report quarterly, starting from any month in the year. Of these quarterly reporters, the largest proportion and particularly larger businesses, report on the calendar quarter end months – March, June, September and December. Some report monthly, mainly larger businesses. A very small number provide annual returns, incorporating twelve calendar months. This can be returned on any annual stagger as shown in Table 3.
Table 3: VAT returns by number and size of turnover by return frequency, over a six-month period
| UK, six months | ||||
|---|---|---|---|---|
| Period-end month | Count | Count % | Turnover (£billions) | Turnover % |
| Monthly returns | ||||
| Every Month | 358,809 | 9% | 846 | 22% |
| Rolling 3 month returns | ||||
| Mar, Jun, Sep, Dec | 1,529,868 | 38% | 2,146 | 56% |
| Apr, Jul, Oct, Jan | 1,102,561 | 27% | 412 | 11% |
| May, Aug, Nov, Feb | 1,058,678 | 26% | 402 | 11% |
| Rolling 12 month returns | ||||
| Annual, all months | 11,182 | 0% | 0 | 0% |
| Source: Value Added Tax data, Her Majesty's Revenue and Customs | ||||
Download this table Table 3: VAT returns by number and size of turnover by return frequency, over a six-month period
.xls (27.6 kB)For use in the VAT processing system, this can be divided up into 16 possible stagger codes for calendarisation.
Table 4: Stagger codes values to return a Value Added Tax return
| Stagger | Reporting period |
|---|---|
| 0 | Monthly |
| 1 | Quarterly. Quarters ending March, June, September, December |
| 2 | Quarterly. Quarters ending January, April, July, October |
| 3 | Quarterly. Quarters ending February, May, August, November |
| 4 | Annual. Year ending January |
| 5 | Annual. Year ending February |
| 6 | Annual. Year ending March |
| 7 | Annual. Year ending April |
| 8 | Annual. Year ending May |
| 9 | Annual. Year ending June |
| 10 | Annual. Year ending July |
| 11 | Annual. Year ending August |
| 12 | Annual. Year ending September |
| 13 | Annual. Year ending October |
| 14 | Annual. Year ending November |
| 15 | Annual. Year ending December |
2.3 History of use of VAT data within national accounts
Usage in updating the Inter-Departmental Business Register
Office for National Statistics (ONS) receives several Value Added Tax (VAT) datasets from HM Revenue and Customs (HMRC) (provisioned under Section 91 of the Value Added Tax Act 1994), which contain different information and are received with varying frequency. Several of these datasets (those received daily, twice-monthly and twice-yearly) contain no actual turnover data, but are concerned with the maintenance of the Inter-Departmental Business Register (IDBR), providing updated information on business births and deaths, and on changes of details (such as address or contact name).
Two datasets are received, one monthly and one quarterly, which contain the VAT turnover variable (which HMRC call Outputs). The dataset that is received monthly contains the raw VAT turnover data, as they appear on the VAT return forms. The quarterly dataset, however, contains an annualised turnover figure (calculated by HMRC’s Annualised Credibility Suite) for each VAT reference. The four quarterly datasets each contain annualised figures relating to the previous 12 months, so the dataset received in January 2018 relates to January 2017 to December 2017, the dataset received in April 2017 relates to April 2016 to March 2017, and so on.
VAT data are also used primarily to update the IDBR (to record businesses’ births and deaths, among other things). However, VAT turnover data are also entered onto the IDBR. The raw monthly figure is overwritten each month, meaning that only one month’s worth of raw data are available for each VAT reference and these data are not therefore used very much at present. Four annualised figures are stored (from the previous four quarterly datasets) meaning that at any one time, the IDBR contains four annual turnover estimates (one from March, one from June, one from September and one from December). These annualised figures are used in sample selection and as an auxiliary variable on various surveys.
History of VAT turnover in the usage of short-term output indicators
Data from VAT sources have previously been used in deriving short-term output indicators. In the 1990s, quarterly turnover inquiries covering service sector industries were launched. These mirrored the monthly surveys covering the production sector and VAT turnover data were used to benchmark estimates.
With the move towards monthly services surveys in the late 1990s, VAT turnover data were considered and often used to deliver monthly estimates. However, the main issues with VAT data were the lack of timeliness and the divergence between aggregate VAT and survey data, which were constructed with different industrial classifications to those used through the national accounts. As the monthly surveys were steadily developed, the use of VAT as a benchmark and a data source declined. In 2009 a new Monthly Business Survey (MBS) replaced the last industry to use a VAT turnover dataset in its previous format (taxi operations) and since that time, VAT turnover has not been in use.
In summary, previous issues that prevented the use of VAT turnover data have been overcome by having access to VAT microdata at business level to construct monthly data (as outlined in the Exploitation of HMRC VAT data article, published in October 2015). These micro processing methods are further explained in section 3.2.
Moreover, by feeding the microdata through the IDBR, we can achieve a more consistent approach in the reporting of businesses according to their Standard Industrial Classifications across HMRC and ONS and, more importantly, across the integrated system of national accounts.
2.4 VAT data – international context
International statistical bodies have advocated the use of VAT data, which is a common proportional tax on consumption. The International Monetary Fund provides guidance in the Quarterly National Accounts Manual: Concepts, Data Sources and Compilation:
“An important type of administrative data for QNA [Quarterly National Accounts] is from Value Added Tax (VAT)… VAT systems have the benefit of offering comprehensive or, at least, very wide coverage. Since the VAT systems would collect information in any case, the extra costs and burdens of statistical collections can be avoided.”
The European Statistical System’s Network of Excellence (ESSNet) examined best practise in Use of administrative data and accounts data for business statistics, enabling commonality between different EU member states. The UK played an active and central role in this work programme and developed methods to address many of the previous challenges, which are discussed earlier in this article.
Other National Statistics Institutes (NSIs), such as Statistics Canada and Statistics Finland (SCF), use more turnover data sourced from a VAT return in their national accounts and short-term output indicators than we do at present, with Scandinavian countries being the most advanced.
International comparison with Finland
Monthly tax return data have been the main source to produce Finnish monthly indices on turnover, wage and salaries since 1999. They receive data from the National Board of Taxes, which contains tax return data for around 320,000 enterprises per reference month. Since 93% of businesses, representing 99.8% of turnover for the whole economy, report turnover monthly, calendarisation and disaggregation methods for quarterly and annual returns are of lesser importance. Data from enterprises that do report quarterly or annually, which may be temporarily missing for the reference month, do not significantly impact the index. Where it is necessary to use a calendarisation method, the SCF uses the common-ratio method to convert quarterly and yearly returns to a monthly level. For more information, see the Use of monthly tax return data – transforming raw data to statistical data – Tilastokeskus ESS working paper 2010.
International comparison with Canada
Statistics Canada has used tax microdata for statistics since the 1980s and 1990s, and has achieved a 20% reduction in survey burden by utilising microdata from tax returns. This is estimated to have saved Canadian businesses more than CA$600,000 a year in compliance costs. However, Statistics Canada has had to overcome issues with timeliness. Due to a significant number of businesses reporting quarterly, there must be a calendarisation method in place to produce monthly estimates of revenue. For more information, see Calendarisation of the Goods and Sales Tax (GST) Data: Issues and Solutions, Statistics Canada, 2008
International comparison with The Netherlands
Statistics Netherlands (CBS) took a different approach in that they opted to replace a part of their survey data, particularly for small- and medium-sized businesses, with VAT data. This is due to a significant difference in the way that their VAT data are collected. Only monthly data are available in the first and second months of each quarter and annual data are only delivered in December. This means there are no quarterly staggers. This is not the case within the UK VAT reporting scheme.
Despite this, the conclusion was made that the near census of businesses attained from the use of VAT observations could lead to an improved accuracy of measurement, especially when compared to the sampling error often seen within their sample-size restricted business surveys. For more information, see Representativity of VAT and survey data for short term business statistics, CBS, 2011.
Like the cases of Canada and the Netherlands, the UK position has been disadvantaged by the lack of availability of monthly VAT data. Only 22% of UK VAT turnover is reported monthly (with 78% reported quarterly and less than 1% reported annually), one of the lowest in the European Union (EU). This is compared with over 90% of turnover reported monthly in Finland. In terms of count of businesses, 9% report monthly, with the remaining 91% reporting on one of the three quarterly staggers. However, as demonstrated by the countries mentioned previously, this longstanding timeliness issue can be overcome.
To achieve this, we construct “monthly” estimates from staggered quarterly VAT reports, meaning that, for the latest month, data will be available from monthly reporters and approximately one-third of businesses whose quarterly stagger covers this latest month. During the project, we have engaged with colleagues from other NSIs to learn and enhance UK methods in processing this administrative dataset.
2.5 Overview of Monthly Business Survey
The ONS short-term Economic Statistics Surveys are used to collect information on monthly turnover from selected industries covering Services, Construction and Retail in Great Britain, and Production in the UK. The overall sample size is approximately 45,000 businesses, out of a population of 1,900,000 businesses.
The coverage of the different surveys is best described in the Gross domestic product (output approach) (GDP(O)) source catalogue, which also highlights how various sources such as government and household final consumption expenditure are used as current price data series in the compilation of short-term indicators. Within each industry, the businesses are split into five sampling strata, based on the registered employment, recorded on the Inter-Departmental Business Register (IDBR).
Stratum or employment band one represents the smallest businesses in each industry and the sample is selected at random from the universe of businesses contained on the IDBR for the sampling period. Strata or employment bands two and three similarly represent small- and medium-sized businesses, which are selected at random. For a few smaller industries, stratum or employment band three can also be a census of activity.
In the Construction survey, there are six consistent stratum level employment bands in comparison with the five for production and services. This is to account for the variability between business size and turnover. Stratum or employment band four represents the largest businesses in each industry, and the selection constitutes a census of businesses more than the employment cut-off for that industry.
In addition, businesses below the census cut-off with turnover more than £60 million can represent a significant part of an industry and so these undergo a forced selection at stratum or employment band five. There are relatively few of these businesses, but they are required to be sampled period-on-period due to the size of their turnover and uniqueness within the strata they would normally be sampled within.
Although stratum one selections for many industries are confined to the 0 to 9 employment size-band, for some industries stratum one covers 0 to 4 employment. Similarly, strata two and three can differ in make-up between different industries in terms of the employment size-bands used to delineate the strata.
MBS selection for June 2017
We show a snapshot of the size of the Monthly Business Survey (MBS) from June 2017, a typical month, chosen because it is the last month in selection for the data published in the Quarterly national accounts (July to September 2017) on 22 December 2017. There is little month-to-month change in MBS selection.
In the production industries, UK Standard Industrial Classification 2007: SIC 2007 divisions 07 to39, the MBS covered 5,700 businesses and the fully enumerated cut-off is primarily at 100 employment. For the period June 2017, the selected businesses covered 74.1% of the total registered turnover of the industries selected on the IDBR, with 71.0% of that figure from strata four and five employment bands and an additional 3.1% from strata one to three employment bands.
Figures 1 and 2 consider the sample in more detail at stratum level. They also highlight that 900 forms for stratum one employment band industries (17% of total forms despatched to production industries each month) cover only 5% of the registered turnover universe within the strata they are sampled within.
Figure 1: Characteristics of the Monthly Business Survey June 2017 sample for the production industries: percentage share of universe turnover
Source: Monthly Business Survey, Construction Survey, Retail Sales Index (Office for National Statistics)
Download this chart Figure 1: Characteristics of the Monthly Business Survey June 2017 sample for the production industries: percentage share of universe turnover
Image .csv .xls
Figure 2: Characteristics of the Monthly Business Survey June 2017 sample for the production industries: percentage share of sample
Source: Monthly Business Survey, Construction Survey, Retail Sales Index (Office for National Statistics)
Download this chart Figure 2: Characteristics of the Monthly Business Survey June 2017 sample for the production industries: percentage share of sample
Image .csv .xls
Table 5: Characteristics of the MBS June 2017 sample for the Production industries
| Size band | Forms despatched |
|---|---|
| Band 4/5 | 2,900 |
| Band 3 | 1,100 |
| Band 2 | 900 |
| Band 1 | 1,000 |
| Total | 5,900 |
| Source: Monthly Business Survey, Office for National Statistics | |
Download this table Table 5: Characteristics of the MBS June 2017 sample for the Production industries
.xls (26.6 kB)In the services industries, UK SIC 2007 divisions 45 to 96, the MBS covered 27,200 businesses and the fully enumerated cut-off is primarily at 100 employment. For the period June 2017, the selected businesses covered 65.3% of the registered turnover of the industries selected on the IDBR, with strata four and five employment bands totalling 63.6% and strata one to three employment bands an additional 1.7%.
Figures 3 and 4 consider the sample in more detail and it should be noted that stratum or lower employment band one businesses constitute a larger part of the sample than in the production industries – but this is due to the greater significance that stratum or lower employment band one industries have in representing 9% of the registered turnover universe.
Figure 3: Characteristics of the Monthly Business Survey June 2017 sample for the services industries: percentage share of universe turnover
Source: Monthly Business Survey, Construction Survey, Retail Sales Index (Office for National Statistics)
Download this chart Figure 3: Characteristics of the Monthly Business Survey June 2017 sample for the services industries: percentage share of universe turnover
Image .csv .xls
Figure 4: Characteristics of the Monthly Business Survey June 2017 sample for the services industries: percentage share of sample
Source: Monthly Business Survey, Construction Survey, Retail Sales Index (Office for National Statistics)
Download this chart Figure 4: Characteristics of the Monthly Business Survey June 2017 sample for the services industries: percentage share of sample
Image .csv .xls
Table 6: Characteristics of the MBS June 2017 sample for the Services industries
| Size band | Forms despatched |
|---|---|
| Band 4/5 | 11,700 |
| Band 3 | 4,900 |
| Band 2 | 4,300 |
| Band 1 | 6,300 |
| Total | 27,200 |
| Source: Monthly Business Survey, Office for National Statistics | |
Download this table Table 6: Characteristics of the MBS June 2017 sample for the Services industries
.xls (26.6 kB)In the construction industries, UK SIC 2007 divisions 41.2 to 43, the survey covers 7,900 businesses per month. The noticeable aspect with the construction sample is the large percentage of surveys dispatched to stratum or employment band one businesses each month, where 43% of forms are dispatched to obtain 20% of the universe turnover. In the construction sector stratum or lower band one businesses have a standard 0 to 4 employment range.
Figure 5: Characteristics of the Monthly Business Survey June 2017 sample for the construction industries: percentage share of universe turnover
Source: Monthly Business Survey, Construction Survey, Retail Sales Index (Office for National Statistics)
Download this chart Figure 5: Characteristics of the Monthly Business Survey June 2017 sample for the construction industries: percentage share of universe turnover
Image .csv .xls
Figure 6: Characteristics of the Monthly Business Survey June 2017 sample for the construction industries: percentage share of sample
Source: Monthly Business Survey, Construction Survey, Retail Sales Index (Office for National Statistics)
Download this chart Figure 6: Characteristics of the Monthly Business Survey June 2017 sample for the construction industries: percentage share of sample
Image .csv .xls
Table 7: Characteristics of the Construction June 2017 sample for the Construction industries
| Size band | Forms despatched |
|---|---|
| Band 4/5 | 900 |
| Band 3 | 1,500 |
| Band 2(6+7) | 2,100 |
| Band 1 | 3,300 |
| Total | 7,900 |
| Source: Monthly Business Survey, Office for National Statistics | |
Download this table Table 7: Characteristics of the Construction June 2017 sample for the Construction industries
.xls (26.6 kB)In the retail industries, UK SIC 2007 division 47, the Retail Sales Index (RSI) covers about 5,000 businesses per month. The fully enumerated businesses (strata four and five) dominate the industry, with over three-quarters of the sample based on turnover share. The stratum or lower employment band one businesses only cover 7% of the turnover, but in terms of number sampled each month these stratum or employment band one businesses make up over one-third of the sample.
Figure 7: Characteristics of the Monthly Business Survey June 2017 sample for the retail sales industries: percentage share of universe turnover
Source: Monthly Business Survey, Construction Survey, Retail Sales Index (Office for National Statistics)
Download this chart Figure 7: Characteristics of the Monthly Business Survey June 2017 sample for the retail sales industries: percentage share of universe turnover
Image .csv .xls
Figure 8: Characteristics of the Monthly Business Survey June 2017 sample for the retail sales industries: percentage share of sample
Source: Monthly Business Survey, Construction Survey, Retail Sales Index (Office for National Statistics)
Download this chart Figure 8: Characteristics of the Monthly Business Survey June 2017 sample for the retail sales industries: percentage share of sample
Image .csv .xls
Table 8: Characteristics of the RSI June 2017 sample for the Retail sales industries
| Size band | Forms despatched |
|---|---|
| Band 4/5 | 900 |
| Band 3 | 1,400 |
| Band 2 | 900 |
| Band 1 | 1,700 |
| Total | 4,900 |
| Source: Monthly Business Survey, Office for National Statistics | |
Download this table Table 8: Characteristics of the RSI June 2017 sample for the Retail sales industries
.xls (26.6 kB)Overall, ONS short-term surveys sample around 45,000 businesses every month. Out of this, 45% of forms dispatched are to strata one and two businesses, which cover 29% of turnover. Interestingly, these are businesses with less than 20 employees. As a result, there is already a significant burden for these units to complete ONS short-term surveys. A high proportion of these units have a direct relationship between their VAT unit and reporting unit, and therefore, where appropriate, can be transferred onto VAT returns. From ONS’s perspective, the improvement in coverage in terms of number of units far outstrips the monthly samples and therefore improves coverage.
Figure 9: Characteristics of the entire Office for National Statistics short-term surveys sample June 2017: percentage share of universe turnover
Source: Monthly Business Survey, Construction Survey, Retail Sales Index (Office for National Statistics)
Download this chart Figure 9: Characteristics of the entire Office for National Statistics short-term surveys sample June 2017: percentage share of universe turnover
Image .csv .xls
Figure 10: Characteristics of the entire Office for National Statistics short-term surveys sample June 2017: percentage share of sample
Source: Monthly Business Survey, Construction Survey, Retail Sales Index (Office for National Statistics)
Download this chart Figure 10: Characteristics of the entire Office for National Statistics short-term surveys sample June 2017: percentage share of sample
Image .csv .xls
Table 9: Characteristics of the entire ONS sample June 2017
| Size band | Forms despatched |
|---|---|
| Band 4/5 | 16,400 |
| Band 3 | 8,900 |
| Band 2 | 8,200 |
| Band 1 | 12,300 |
| Total | 45,800 |
| Source: Monthly Business Survey, Office for National Statistics | |
Download this table Table 9: Characteristics of the entire ONS sample June 2017
.xls (26.6 kB)2.6 Comparison of definitions of VAT against ONS monthly surveys
In the Monthly Business Survey for Production and Services, businesses respond to the “What was the value of the business’s turnover, excluding VAT?” field. In construction, the question is different, intended to remove the effect of sub-contracting work between companies – “What was the total value of work carried out?” This is not directly asking for turnover, but a close resemblance of it. In the Retail Sales Index, the question asks for “Total retail sales”, which would exclude turnover coming from non-retail sources. Most small- and medium-sized retail businesses would have turnover primarily made up from retail sales. These are all trying to compare with the question “Total value of sales and all other outputs excluding any VAT”, asked on the VAT returns.
Microdata analysis has been conducted for each stratum, comparing the turnover data for both VAT and MBS at the reporting unit level. This has demonstrated strong, positive correlations between the two series overall, providing reassurance that the data sources are well matched and VAT turnover can be used to supplement and enhance industry estimates. The analysis has shown that over 60% of strata have a Pearson’s correlation coefficient value greater than 0.7. Where differences have occurred, it has tended to be in the higher employment strata where apportionment methodologies can be more of a factor. This has led to fewer high employment strata (band three) being selected within the matrix.
Back to table of contents3. How VAT data will be used in the national accounts
Many data challenges have presented themselves during the research and implementation phase, requiring new processes and methodologies to be developed to validate, clean and apportion Value Added Tax (VAT) data for incorporation into the national accounts. A set of principles and standards have also been developed to ensure the implementation of VAT turnover data within the national accounts. These have provided a framework and structure to the work. These principles and processes are described in this section.
3.1 National Accounts principles and standards
Because of using VAT turnover within the national accounts, a set of principles and standards have been developed. These principles, defined in the VAT turnover implementation into national accounts: November update article, are detailed in this section.
Principle 1: VAT turnover data are used to supplement Monthly Business Survey measured industries only
A decision was taken to make use of VAT turnover data for industries where comparable survey data are already used in the national accounts, where we have already established the mutual concept of turnover as a proxy to output. The surveys that provide coverage of these industries are the Monthly Business Survey (MBS) for production in the UK and services in Great Britain, the Retail Sales Index (RSI) and the Monthly Business Survey for Construction and Allied Trades.
Further selection decisions will be taken regarding the quality and suitability of the VAT turnover data. Many selection criteria have been established and a supporting suite of analyses are being created to support this process.
One criterion evaluates the degree of comparability between VAT turnover data and other economic indicators, such as the monthly business surveys, reviewing the relative quality of our existing survey data and their sampling coverage of industries for the smaller employment strata. Another criterion involves analysis of the revisions to VAT turnover data over time, resulting from any new information regarding business structures or updated returns data from HM Revenue and Customs (HMRC).
Principle 2: VAT turnover data are used for selected strata only
The VAT turnover data have been implemented in specific employment strata within industries. These strata are those constructed ranges of business employment-level specified by the sampling methodology for the relevant monthly surveys (such as MBS, RSI and Construction surveys), which try to establish equitable coverage of comparable business populations within industries.
VAT returns do not always directly correspond with single reporting units as defined by the Inter- Departmental Business Register (IDBR). In fact, multiple VAT returns may be submitted for an enterprise consisting of multiple reporting units. This leads to difficulty allocating turnover to different industries covered by the same return.
More than 90% of reporting units have a one-to-one correspondence with a single VAT return. However, as turnover is more concentrated in businesses with more complex business structures, only 20% to 40% of turnover is reported by “simple” reporting units with a single VAT return. Most commonly, these businesses will belong to a small employment stratum. With this in mind, we have taken the decision to use VAT to replace the small employment strata only (bands one to three).
Principle 3: Only relative changes of VAT turnover over time are used
Analysis of VAT turnover data across industries shows the current price level to be different from both the MBS and Annual Business Survey (ABS) datasets.
Some conceptual differences exist in the measurement of turnover from the monthly business surveys and the HMRC VAT returns, which may explain some of the discrepancy. Analysis work is underway, which aims to improve understanding of the issue by comparing contemporaneous observations of turnover from businesses that feature in both the newly-developed VAT turnover dataset and the business surveys data.
The use of this overall VAT turnover-derived level of turnover to inform output levels in the UK economy is not feasible until a better understanding of this discrepancy is established. Therefore, VAT turnover data will be used as an index of growth for each of the industries and the relevant employment strata. The VAT turnover indices derived for each industry and employment stratum combination uses the same methodology as that used for the monthly business surveys output data.
Principle 4: VAT turnover indices will be used on a quarterly frequency
VAT turnover data will be used to create a quarterly index of growth for the various industries and employment strata. This follows from the identification of quarterly VAT returns being the dominant contributing frequency, making up around 90% of all returns and representing around 75% of all turnover received. The monthly path for the short-term output indicators will be benchmarked to these quarters to form an index that makes use of both data sources where appropriate.
Principle 5: Short-term output indicators indices will be constrained to quarterly national accounts datasets
VAT turnover data are implemented for sections of industries, delimited according to the number of employees of the relevant statistical units.
Indices of growth will be derived from the VAT turnover data and used to supplement the short-term output indicators in the national accounts.
The short-term output indicators are constrained to the relevant quarterly national accounts datasets. This requires making changes to the current revisions policy to maintain consistency between the outputs, which we are addressing by making changes described in section 3.1.
3.2 Data processing: national accounts inclusion methods – microdata
To process VAT data, a new statistical processing platform was developed, with new methodologies to support. This has allowed the transformation of the administrative dataset to a level that is consistent with our business surveys. These datasets and processing are detailed in this section.
Data validation
Monthly VAT turnover data received from HMRC in the format described in section 2.2 must first be validated and cleaned according to the principles detailed in this section.
The first stage of the cleaning process validates each VAT record against several validation rules. These rules check that:
- each record contains an expected period code
- is of the correct record type (a normal VAT submission or a change made to a previous submission)
- has a valid turnover figure (less than 99999999999)
- valid VAT reference number (not 000000000 or 999999999)
- that a valid stager code has been recorded (from stagger 0 to 15)
- contains a valid return type of either 1 (when a report has been submitted to HMRC), or 0 (a placeholder for an expected return)
Any record failing the validation process is discarded, with values for each failed record being estimated for later in the process. Very few records fail at this initial stage and these validation rules are consistent with similar validation rules applied to ONS surveys.
Duplicate records are also removed at this stage. The VAT reference number of a business and its period code are checked for duplication, with the duplicates then being ranked by the latest return date and highest record type. The record ranked at the top is kept while the others are discarded.
Content editing
This cleaning of VAT data provides a challenge in processing the data, in that we cannot follow the same methods used for MBS data and contact the business to confirm their return. This is a trade-off between the greater coverage of the dataset and that we are unable to speak to businesses to gain anecdotal evidence and confirm erroneous data. As such, we have developed the following cleaning and suspicious turnover rules that provide us with the opportunity to take evidence-based action should this be needed.
Thousand pounds rule
Businesses should submit a VAT return to HMRC in British pounds; however, it is possible for businesses to make clerical errors when submitting their VAT return by submitting in thousand pounds. These errors are identified by dividing the current turnover value on their VAT return by the previous turnover value on their VAT return and calculating a ratio between the two. If the ratio is between 0.00065 and 0.00135, the turnover value for the current month fails the thousand pounds rule and is corrected by multiplying the value by 1,000. This rule is the same as that adopted by ONS business surveys in adjusting for thousand-pound errors on a business survey.
Quarterly pattern rule
The quarterly pattern rule identifies quarterly reporters (staggers 1, 2 and 3 – see Table 4) not following a “true” quarterly pattern. There are three variations of this rule:
- VAT unit reports the same turnover value in any three consecutive quarters followed by a different value in the fourth quarter (x,x,x,y) – in these cases, it implies that the business has assessed its annual turnover value and allocated it between the four quarters; the fourth quarter is then adjusted to reflect the true annual value
- VAT unit reports the same turnover value in any four consecutive quarters (x,x,x,x) – in these cases, it suggests that the business is reporting one annual figure and allocating this equally between the four quarters
- VAT unit reports a turnover value of zero in any three quarters followed by a positive value in the fourth quarter (0,0,0,x) – in these cases, it implies that the business is submitting an annual value
In the previous examples, the annual value is re-assigned to the corresponding quarters by:
- calculating median proportions between the quarters from businesses in the same strata with genuine reporting values; a strata is defined as a grouping of businesses within the same industry classification and with a similar number of employees
- calculating the annual turnover figure for the business in error to derive quarterly turnover figures
- applying the relevant strata quarterly median to the business in error to derive quarterly turnover figures
This content editing rule is important to adjust for, due to most of VAT data being returned in a quarterly form. Due to the processing methods and ONS’s need to have the data in a monthly time series to produce its various monthly indicators, we need to have true quarterly data for the later microdata processing methodologies to work as specified.
First return rule
This rule identifies all first returns for a period at the VAT unit level and flags the highest 5%. This cleaning therefore identifies, but does not treat the individual returns in an automated fashion. This is where the manual intervention, described in the following paragraphs, can be used to treat a return that looks odd or requires further return to validate the entry.
Suspicious turnover rule
This rule checks to see if the turnover is more or less than one-third of the previous turnover, if it is then it has failed the rule. Like the first return rule, this identifies suspicious turnover, but does not treat the individual returns in an automated fashion. Manual intervention using national accounts knowledge of the industry and business can then adjust the return to something more in line if needed.
Manual intervention
A number of manual methods are employed to further identify and clean any suspicious data:
- comparing VAT time series to MBS-derived time series to identify suspicious movements
- analysis of VAT business-level data to identify and correct potential reporting errors
For most of these rules, the VAT return data narrowly just passes one of the content editing rules mentioned or has certain characteristics that are hard to treat via automated content editing rules.
Matching and linking
VAT data are matched against a corresponding IDBR snapshot each month using a unique identifier – the VAT registration number of each business. This process enriches the source data with features from the IDBR that can be used in later processing of VAT data. Matching rates are over 99% each month.
Figure 11 shows a typical simple relationship between VAT registration units and ONS statistical units in detail. As can be seen, a business’s VAT registration unit can be linked to an enterprise on IDBR and this enterprise can be linked to lower-level statistical units such as reporting units and smaller local units. In some instances, enterprises commonly feature in complex corporate structures and form part of a larger enterprise group.
Figure 11: Types of Inter-Departmental Business Register unit and structures – a “simple” structure

Download this image Figure 11: Types of Inter-Departmental Business Register unit and structures – a “simple” structure
.png (22.8 kB)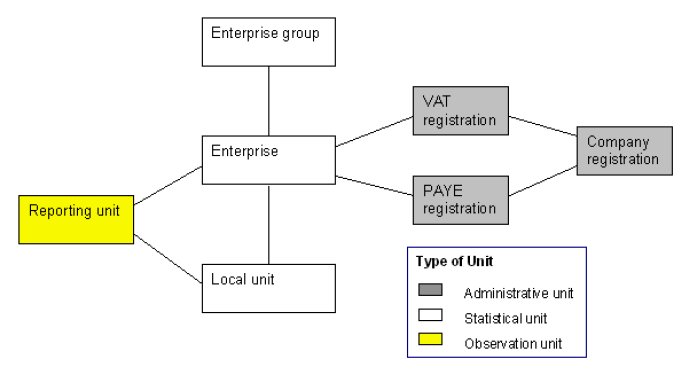
Matching VAT turnover to statistical units on the IDBR is advantageous as this process enables the production of microdata with consistent units and definitions across UK National Accounts. Additionally, data from the IDBR (such as geography and industry classification) can be added through this matching process to deliver a richer data source. This is a significant development over previous attempts to use VAT turnover within the national accounts.
The ability to match and link the near complete administrative dataset to the IDBR allows the creation of microdata, which can then be aggregated to the necessary levels of the UK SIC 2007. Previously, when VAT data were used in the national accounts, this was never possible meaning that understanding the reasons behind unusual data movements could not be investigated.
Apportionment
HMRC delivers microdata at VAT registration unit level. However, for VAT data to be in line with the detailed requirements of national accounts, they must be presented at ONS Reporting Unit (RU) level. For much of VAT traders, the VAT registration unit is the same as their reporting unit structure such that one VAT unit equals one IDBR enterprise, which equals one ONS RU.
These are known as “simple” businesses and account for some 90% of all returns. No apportionment is required as the VAT registration unit turnover can be wholly attributed to the sole RU of the business.
However, a group of businesses can decide to register under one VAT registration unit and so one VAT trader will report the turnover of the entire VAT group. In this instance, one VAT unit is likely to be matched to multiple enterprises. Each enterprise can then be represented by one or more RU. These businesses are considered to be “complex” and consist of one of the following relationships:
- one VAT unit to many reporting units
- many VAT units linked to one or more reporting units
In these complex cases, we must determine how turnover provided by businesses at VAT unit level is apportioned to (or shared between) the IDBR enterprises assigned to a specific VAT unit – and then how this turnover is apportioned further from each enterprise down to the associated reporting units.
At present, complex businesses are apportioned based on registered employment, or the employment as notified on the IDBR. This method involves dividing the VAT registration unit turnover amongst the associated IDBR enterprises based on the proportion of employment associated with each enterprise. For example, if a VAT registration unit is linked to two enterprises with employment in the ratio 60 to 40, then the turnover reported by the VAT unit will be divided such that 60% of turnover is allocated to the first enterprise and 40% to the second. This process is repeated to apportion turnover from enterprise level to RU level and to the smallest Local Unit level.
This apportionment method assumes a direct relationship between VAT turnover and employment and is not appropriate for all industries. This is one of the main reasons as to why VAT turnover has not been selected for more strata including those that are fully enumerated. We will be investigating alternative approaches to apportionment over the coming months to see if this can be improved upon.
Calendarisation
VAT returns can be submitted on a monthly, quarterly or annual basis. These quarters and years can start in any month, meaning that returns are not all returned on the same basis. The aim of calendarisation is to assign turnover from quarterly and annual returns to each of the calendar months covered by the reporting period.
Seasonal and trading days are used to calendarise the data. This method proportionally allocates quarterly and annual returns to months based on long-term trends of time series data, seasonal components that repeat every year, the number of trading days in a given month, systematic behaviours caused by Easter period moving between March and April, and other irregular variations that cannot be explained by other components (for example, decreased construction activity caused by bad weather). The proportions are stratum-specific and are derived from stratum-level MBS time series data. VAT returns adopt a standard period through this approach, enabling a subsequent monthly estimation process.
Estimation
At the point when turnover data are required not all VAT returns are available. The purpose of the estimation method is to calculate a turnover value for all reporting units where a return is yet to be submitted to HMRC. This could be due to businesses reporting to HMRC late, or even not at all for any given month. Also, due to the way in which reporting stagger patterns fall, this may mean that VAT returns for the reference period are yet to be submitted, but will be at a future month. The estimation method also provides a figure for reporting units in the universe that are not VAT registered. This is an important improvement as it allows a total turnover figure for the industry.
Ratio estimation using the IDBR frozen turnover variable is the method selected for those strata that do not have a 100% response rate. This method uses the relationship between VAT turnover and frozen turnover from the IDBR to estimate for the whole population using a process already used within current ONS surveys by:
- calculating the amount of real VAT turnover that has arrived in each stratum, relative to the proportion of IDBR frozen turnover for those businesses that have provided a VAT return in the strata
- the ratio is multiplied by IDBR turnover value for the strata to provide an estimate for VAT turnover missing from the stratum for the target period
The estimation has been assessed by applying the method as if it were a set point in the past and comparing the calculated estimate with the known “truth” when looking at the data in the present day. This has allowed us to assess the effectiveness of estimation methods against the real data. Using this and assessing against the requirements of the short-term output indicators, it has been agreed that the estimation is of a sufficient standard at five months after the reference period.
Aggregation
After processing the VAT returns at a micro level, data are aggregated using the UK SIC 2007 and strata structure used for MBS data. The aggregate data are then passed to the Central ONS Repository for Data (CORD) for processing into the national accounts.
3.3 Data processing: national accounts inclusion methods – macro processing
The use of VAT turnover data within the national accounts is intended to augment the other data sources currently used for measuring output in the UK economy, including a range of surveys such as the MBS. VAT turnover data are unsuitable for use on a monthly basis so the approach that has been implemented is to aggregate VAT turnover data to MBS data to form a composite measure. The VAT turnover dataset is used as a quarterly series, replacing the quarterly path previously derived from the MBS. Monthly time series within each quarter is then derived using the monthly path from MBS data.
To achieve this, the following steps are taken:
a new “VAT-consistent” annual series is created that equates to growth in the MBS prior to the year in which VAT data have been taken on; the annual growth rate derived from VAT data are benchmarked and spliced onto the established level of the annual MBS series – the Cholette-Dagum method of benchmarking is employed, according to ONS established best practice
this series is then used as a benchmark for the creation of a quarterly “VAT-consistent” series that follows a quarterly VAT path; in a case where further quarterly VAT data are available for an incomplete calendar year, growth in the quarterly tail is also spliced on
a final monthly “VAT-consistent” series is then created, which benchmarks MBS monthly growth data to the quarterly “VAT-consistent” series; where additional MBS data are available for a later period than VAT, these data are spliced in to create an MBS only tail
the final series is therefore consistent with VAT annual and quarterly growth rates when they are available and with monthly growth rates derived from the MBS data
to create the industry totals for use in national accounts, an industry selection matrix is used to select the most appropriate data source (either MBS, VAT, or composite data) for any given industry by employment combination; industry totals can therefore consist of composite series for the two smallest strata and of MBS-only series for the larger strata, making use of the best and most appropriate data for each stratum within an industry
these “composite output total” time series are then run through the remaining part of the monthly gross domestic product, Index of Production, Index of Services and Construction systems as per usual
VAT impacts in the MBS-only tail months
As described previously, monthly growth rates derived from MBS-only data are used to construct the latest months beyond the last complete VAT quarter. The creation of this MBS-only tail is necessary because the percentage of available VAT returns that require estimation, due to the stagger pattern they return their VAT returns on, drops below an acceptable quality threshold.
Whilst this provides a consistent month-on-month growth profile for individual industries, upon aggregation of these time series to published levels (such as the Index of Production) the overall growth rate will not match that which could be derived from purely survey data. This result derives from the splicing of monthly MBS-only data in the latest quarter onto the individual industry index levels that have been calculated using both MBS and VAT data. Subsequent growth rates in the MBS-only tail calculated from these quarterly index levels result in aggregated and published index levels that show distinct growth rates from those that would be derived using survey data alone in the entire time series.
3.4 Overcoming data challenges
During the project to incorporate VAT data within the national accounts, numerous data challenges have been overcome.
Improvements in microdata processing methods
Over the last year, extensive improvements have been made to microdata processing of VAT turnover data, which have allowed the data collected by HMRC for one purpose to be used by ONS in the compilation of its economic statistics for another. Notably, the methods that calendarise, estimate and clean the data have allowed the data to be of good enough quality to be used in the national accounts.
Creation of an IT technical processing system to transform the data to the required level
The size and complexity of the VAT turnover dataset required improved ONS systems and accompanying methods. Therefore, new production areas on new IT platforms have been developed. In moving to new processing systems, the processing time was greatly reduced (down from 1.5 days in a prototype system to just over an hour) thus ensuring more time to quality assure the data.
Timeliness of VAT turnover data
Where VAT turnover data are not available in subsequent monthly short-term statistics, survey data alone will be used to create month-on-month growths on the latest positions of the relevant output time series, until the next quarterly national accounts can inform the quarterly path for those periods. These growths are spliced onto the VAT data, meaning that the MBS series for the latest periods will have been benchmarked to ensure that there is no jump from the latest VAT month to the next MBS month. The process described in section 3.3 of combining the two datasets takes the strengths of both the survey and VAT data to ensure the best indicator of economic activity as possible.
Revision policy changes
The revisions policy for short-term indicators has been revised to minimise the frequency of revisions and ensure consistency with the accounts, as set out in the National Accounts Revisions Policy. This ensures that the time series published for the production and construction industries will not receive two revisions in the same month, one being from the latest survey data and the second from the VAT turnover supplemented data used in the quarterly national accounts. The planned VAT release calendar is shown in section 5.3.
Back to table of contents4. VAT data coverage and response
4.1 VAT data coverage in the short-term output indicators
VAT data coverage by industry
As at Quarterly National Accounts (QNA) published on 22 December 2017, Value Added Tax (VAT) data are used to revise output for small- and medium-sized businesses in selected strata, replacing data previously published from the periods January 2016 to June 2017. This replaces data previously sourced from the Monthly Business Survey (MBS) and Construction survey. Data from July 2017 to the present uses the existing survey data sources. The time periods for implementing VAT will be updated at future Quarterly National Accounts publications. The current VAT matrix selection is available. Sectors of the economy where data are not sourced from an ONS survey are not affected. The size of the data sources is shown in Figures 12 and 13.
No data from Wholesale or Retail Sales Index are being replaced by VAT data, due to the upcoming transformation of the Retail Trade Sector (wholesale, retail and motor trades; UK Standard Industrial Classification 2007: SIC 2007 divisions 45 to 47). Although these industries have large gross value added (GVA) weights, it has been decided to not use VAT data on these industries, to prevent multiple data source changes in a relatively short timeframe.
At an economic sector level break down, no sector of the economy is being replaced by more than 20% VAT data. No VAT data are replacing survey data from the largest and fully enumerated businesses from higher employment strata (bands four and five). We are only replacing at lower employment strata (bands one to three). Time series breakdowns of the Index of Production, Index of Services and Construction Survey contributions are shown in Figures 14 to 16.
Figure 12: Gross domestic product percentage contribution from UK SIC 2007 sectors, broken down by data sources, UK, GVA 2015 weights
Source: Monthly Business Survey (Office for National Statistics); Value Added Tax (HM Revenue and Customs), Gross Value Added (Office for National Statistics)
Download this chart Figure 12: Gross domestic product percentage contribution from UK SIC 2007 sectors, broken down by data sources, UK, GVA 2015 weights
Image .csv .xls
Figure 13: Gross domestic product percentage contribution from UK SIC 2007 manufacturing sub-sectors, broken down by data sources, UK, gross value added 2015 weight
Source: Monthly Business Survey (Office for National Statistics); Value Added Tax data (HM Revenue and Customs); Gross Value Added (Office for National Statistics)
Download this chart Figure 13: Gross domestic product percentage contribution from UK SIC 2007 manufacturing sub-sectors, broken down by data sources, UK, gross value added 2015 weight
Image .csv .xlsAs can be seen in Figures 12 and 13, the implementation of VAT across the sectors within the economy is varied and of different magnitudes. Where available, VAT turnover data have replaced part of the short-term survey for all sectors.
VAT data coverage by stratum
The data within Figures 14 to 16 provide a breakdown of the monthly turnover share for each employment stratum from November 2015 to October 2017 for production, services, and construction industries separately and for the overall economy. These data are not published at this level. However, the industry level aggregates are published as MBS turnover for the Production and Services industries respectively, but were published up to November 2017 as a combined Turnover and orders in production and services industries (TOPSI). All data within Figures 14 to 16 are on a current price, non-seasonally adjusted basis.
From Figures 14 to 16, three points are evident. VAT data are shown in the periods it replaces MBS and Construction Survey data, which demonstrates the times VAT data are utilised, and the quantity of MBS data being replaced. Approximately 70% of turnover data come from higher employment strata (employment bands four and five) and are not being replaced by VAT turnover data. This ensures a more timely return of genuine monthly data, which we can validate. The other point is the importance and stability of lower employment strata (employment bands one and two). These are relatively flat in their profile and have around 15% of the turnover share monthly across the time series.
Figure 14: Monthly Business Survey (production) share of turnover by bandstratum and data source, January 2016 to June 2017
Source: Monthly Business Survey (Office for National Statistics); Value Added Tax data (HM Revenue and Customs)
Download this chart Figure 14: Monthly Business Survey (production) share of turnover by bandstratum and data source, January 2016 to June 2017
Image .csv .xls
Figure 15: Monthly Business Survey (services) share of turnover by stratum and data source, January 2016 to June 2017
Source: Monthly Business Survey (Office for National Statistics); Value Added Tax data (HM Revenue and Customs
Download this chart Figure 15: Monthly Business Survey (services) share of turnover by stratum and data source, January 2016 to June 2017
Image .csv .xls
Figure 16: Monthly Construction Output Survey share of turnover by stratum data source, January 2016 to June 2017, UK
Source: Monthly Business Survey (Office for National Statistics); Value Added Tax data (HM Revenue and Customs)
Download this chart Figure 16: Monthly Construction Output Survey share of turnover by stratum data source, January 2016 to June 2017, UK
Image .csv .xls4.2 Comparative response rates
In the MBS survey, the responses deadline for production and services is seven days after the reference period. The response is typically over 80% (based on count of forms) and is highest in the production industries, and amongst the largest employment strata. Although late responders and later revisions to data do occur and are published in later periods, incorporated as revisions, there is minimal impact on the response. It is worth highlighting that this 80% response is only achieved after significant efforts to re-contact businesses.
Table 10: Sample size and business responses from June 2017 for total Monthly Business Survey for Index of Production, Index of Services, Construction, and combined MBS and Construction
| June 2017, UK | ||||||||||
| Index of Production | Index of Services | Construction | Combined surveys | |||||||
|---|---|---|---|---|---|---|---|---|---|---|
| Universe | Response | Universe | Response | Universe | Response | Universe | Response | |||
| Entire MBS | 5,724 | 5,028 | 26,954 | 22,297 | 7,893 | 5,789 | 40,571 | 33,114 | ||
| Band 1 | 944 | 693 | 6,292 | 4,686 | 3,311 | 1,996 | 10,547 | 7,375 | ||
| Band 2 (2+6+7) | 921 | 777 | 4,234 | 3,283 | 2,137 | 1,609 | 7,292 | 5,669 | ||
| Band 3 | 1,058 | 957 | 4,826 | 4,077 | 1,508 | 1,318 | 7,392 | 6,352 | ||
| Band 4 | 2,628 | 2,441 | 10,873 | 9,618 | 858 | 798 | 14,359 | 12,857 | ||
| Band 5 | 173 | 160 | 614 | 536 | 79 | 68 | 866 | 764 | ||
| Source: Value Added Tax data, Her Majesty's Revenue and Customs | ||||||||||
Download this table Table 10: Sample size and business responses from June 2017 for total Monthly Business Survey for Index of Production, Index of Services, Construction, and combined MBS and Construction
.xls (37.4 kB)The MBS sample that is being replaced by VAT data shows a similar response pattern as the overall VAT data. VAT has not been used to replace any businesses in strata four and five, with the highest response, meaning that the sample response is lower than the overall response.
Table 11: Sample size and business responses from June 2017 Monthly Business Survey sections replaced by VAT data for Index of Production, Index of Services, Construction, and combined MBS and Construction
| June 2017, UK | ||||||||
| Index of Production | Index of Services | Construction | Combined surveys | |||||
|---|---|---|---|---|---|---|---|---|
| Universe | Response | Universe | Response | Universe | Response | Universe | Response | |
| MBS Survey VAT matrix | 1,840 | 1,472 | 3,969 | 3,036 | 2,399 | 1,582 | 8,208 | 6,090 |
| Band 1 | 786 | 567 | 2,366 | 1,778 | 1,514 | 891 | 4,666 | 3,236 |
| Band 2 (2+6+7) | 638 | 528 | 1,011 | 793 | 576 | 426 | 2,225 | 1,747 |
| Band 3 | 416 | 377 | 592 | 465 | 309 | 265 | 1,317 | 1,107 |
| Source: Monthly Business Survey, Office for National Statistics | ||||||||
Download this table Table 11: Sample size and business responses from June 2017 Monthly Business Survey sections replaced by VAT data for Index of Production, Index of Services, Construction, and combined MBS and Construction
.xls (27.6 kB)
Table 12: Sample size and business responses from June 2017 for published VAT data for Index of Production, Index of Services, Construction, and combined Monthly Business Survey and Construction
| June 2017, UK | ||||||||
| Index of Production | Index of Services | Construction | Combined surveys | |||||
|---|---|---|---|---|---|---|---|---|
| Universe | Response | Universe | Response | Universe | Response | Universe | Response | |
| VAT | 88,038 | 76,390 | 582,284 | 469,440 | 100,215 | 86,549 | 770,537 | 632,379 |
| Band 1 | 64,625 | 54,172 | 470,879 | 369,047 | 89,907 | 76,817 | 625,411 | 500,036 |
| Band 2 (2+6+7) | 19,310 | 18,275 | 75,053 | 67,164 | 8,921 | 8,376 | 103,284 | 93,815 |
| Band 3 | 3,849 | 3,754 | 36,352 | 33,229 | 1,387 | 1,356 | 41,588 | 38,339 |
| Source: Value Added Tax data, Her Majesty's Revenue and Customs | ||||||||
Download this table Table 12: Sample size and business responses from June 2017 for published VAT data for Index of Production, Index of Services, Construction, and combined Monthly Business Survey and Construction
.xls (27.6 kB)
Table 13: Response percentage for June 17 from MBS and VAT data, separated by economic activity and employment sizeband
| June 2017, UK | ||||||||||
| Index of Production | Index of Services | Construction | Combined surveys | |||||||
|---|---|---|---|---|---|---|---|---|---|---|
| MBS | VAT | MBS | VAT | MBS | VAT | MBS | VAT | |||
| All Bands | 80.0 | 86.8 | 76.5 | 80.6 | 65.9 | 86.4 | 74.2 | 82.1 | ||
| Band 1 | 72.1 | 83.8 | 75.1 | 78.4 | 58.9 | 85.4 | 69.4 | 80.0 | ||
| Band 2 (2+6+7) | 82.8 | 94.6 | 78.4 | 89.5 | 74.0 | 93.9 | 78.5 | 90.8 | ||
| Band 3 | 90.6 | 97.5 | 78.5 | 91.4 | 85.8 | 97.8 | 84.1 | 92.2 | ||
| Source: Monthly Business Survey, Office for National Statistics; Value Added Tax data, Her Majesty's Revenue and Customs | ||||||||||
Download this table Table 13: Response percentage for June 17 from MBS and VAT data, separated by economic activity and employment sizeband
.xls (36.9 kB)For the VAT data used, the most recent published month, June 2017 shows a higher response proportion than for MBS, with a marked improvement of 20 percentage points in construction data. More significantly, the number of responses in VAT shows the primary improvement from using VAT data, of the number of responses given. For the selected industries, the survey now shows an overall number of responses for these industries has increased over a hundredfold, mostly for services and the lowest employment stratum.
4.3 VAT Response time lag
The MBS VAT universe for combined construction, production, services and retail sales has around 1.6 million units in it, which can slightly increase over time for any given reporting month. This is because new businesses can be added to the register, requiring a backdated VAT response. From a snapshot of five runs, dated September 2016 to January 2017, we can count the number of total VAT strata. The size of the VAT universe for all MBS industries remains mostly stable over time.
Figure 17: Size of Value Added Tax universe covering Monthly Business Survey industries at different snapshot months
Source: Value Added Tax data (HM Revenue and Customs)
Download this chart Figure 17: Size of Value Added Tax universe covering Monthly Business Survey industries at different snapshot months
Image .csv .xlsONS receives VAT data from HMRC on the first working day of each relevant month, that is, the Month 1 response number is taken on the first working day after the reference period, resulting in a very low response in Month 1. The response rate fills up steadily until Month 5 (response taken four months and one working day after the reference month period), after which it is mostly stable, with just a few revisions and annual VAT returns coming in.
Most businesses report on a quarterly stagger (Table 3), which is then calendarised into a monthly pattern (see section 3.2). This quarterly pattern means that three months must pass until the majority of VAT returns for any given month have been asked to return. Due to the higher number of VAT returns reporting on the quarter-end months (March, June, September, December; see Table 3), these months have a higher response rate, readily apparent in the response numbers after Months 2 and 3 for quarter-end months. Due to the unevenness of the response numbers in different months, it is necessary to only use VAT data once a high number of responders have returned, which we use here as after five months.
Figure 18: Number of Value Added Tax responses covering Monthly Business Survey industries at different snapshot months
Source: Value Added Tax data (HM Revenue and Customs)
Download this chart Figure 18: Number of Value Added Tax responses covering Monthly Business Survey industries at different snapshot months
Image .csv .xlsTo cope with the effect of the uneven monthly stagger, the breakdown analysis that follows has accounted for an equal sample from each quarterly stagger. Although insufficient VAT snapshots are available to provide an annual analysis, there are sufficiently few businesses with annual VAT returns to have much impact on the annual return.
At stratum level, there is a clear distinction, with the lowest employment businesses, stratum or employment band one, having the lowest response throughout the considered period, with a maximum of 80% response. The largest businesses, in stratum or employment band four, show the highest response, ending at over 95% after five months. They also tend to have a faster response, reaching close to the ideal 33% response each month (after one month’s delay). Businesses in strata or employment bands two and three tend to have more delays in VAT returns, but eventually end up with more than 90% response.
Please note a 100% response rate would indicate all VAT returns have been returned for the period based on the Inter-Departmental Business Register (IDBR) universe for the period. This would indicate all businesses held on the IDBR are VAT registered. This is not the case as the IDBR uses multiple data sources to update its information and not all businesses are VAT registered for numerous different reasons.
Figure 19: Value Added Tax response after a number of months, based on three months data, by employment stratum, UK
Source: Value Added Tax data (HM Revenue and Customs)
Download this chart Figure 19: Value Added Tax response after a number of months, based on three months data, by employment stratum, UK
Image .csv .xlsBreaking down by economic sector, production industries have the fastest response rates and have the highest response at a mature stage. The services sector VAT responses are returned at a similar rate to those of construction and retail sales, but at Month 5, end lower and do not noticeably increase from this point. Within each sector, most responders are in lower employment strata (such as employment band one), meaning that the overall response rate after five months is in the 80% to 90% range. Production industries have a lower proportion of stratum one businesses (see Figure 1), meaning that their response is higher.
Figure 20: Value Added Tax response after a number of months, based on three months data, grouped by economic sector
Source: Value Added Tax data (HM Revenue and Customs)
Download this chart Figure 20: Value Added Tax response after a number of months, based on three months data, grouped by economic sector
Image .csv .xls5. Next steps
5.1 Improvement of processing methods
The development of Value Added Tax (VAT) turnover data is an important part of the transformation of short-term turnover statistics, which aims to efficiently use survey and administrative data for each of the retail, construction, production and services bulletins by the end of 2019.
At present, we are unable to use VAT data for the most recent months in incomplete quarters as the limited VAT response is unable to support reasonable estimates. Further research and analysis is required to review the quality of our estimation method and forecasted data. This will be an important feature of the work to support the transformation of the Retail sales bulletin by the end of 2018, which will be our primary target over this year.
The use of VAT data for the latest period would permit a potentially significant reduction in the survey sample of small- and medium-sized businesses. The transformation programme is also exploring the possibility of processing two datasets together using one to quality assure and help inform the other at the business level.
5.2 Expanding the use of VAT data
Monthly Business Survey industries
A significant amount of VAT data have yet to be assessed and there are areas where the comparison between VAT and survey data must be more fully explained. In that sense, we are still developing our knowledge of the dataset and its applicability across further strata and industries.
Similarly, we should be clear that the new VAT processing system is in its early stages of development and further investment is required to maximise the opportunities offered by the dataset. Here too there are areas such as apportionment where we have identified the need to improve upon our current methods.
We will continue to assess and quality assure VAT data, both for the strata and industries selected for inclusion and those where we have currently decided we will not proceed. The scope for inclusion will be reviewed in time for Blue Book 2018 with a view to expand our scope in the services, construction and production sectors. We recognise that the extension of the VAT data series before January 2016 would improve the seasonal stability of our outputs. However, this may only be achievable from Blue Book 2020.
Non-Monthly Business Survey industries
In addition, we are also committed to review the use of VAT in industries outside the MBS. Table 14 lists industries where the use of VAT turnover data may be helpful to improve the quality of our estimates. Our initial interest will be in considering agriculture, forestry and fishing; commercial property; financial auxiliaries; rail, sea and air transport; and iron and steel.
Table 14: Industries under review for future use of Value Added Tax
| Industry | Current Source | GVA weight | |
|---|---|---|---|
| Agriculture, forestry and fish | Agricultural indicators and annual harvest estimates; annual forestry accounts and deep sea fishing data | 0.70% | |
| Social Care | Government expenditure and ONS jobs data | 1.90% | |
| Mining and quarrying | BEIS volume data and ONS jobs data | 1.60% | |
| Energy | BEIS volume data | 1.50% | |
| Commercial property | Investment Property Databank | 1.40% | |
| Financial auxiliaries | Financial market indicators; output of the Insurance and pension funds industry | 1.30% | |
| Rail, sea and air transport | Office of Rail and Road; Chamber of Shipping and Department for Transport; Civil Aviation Authority | 1.20% | |
| Others | 1.30% | ||
| - Gambling | |||
| - Non-state schools | |||
| - Oil refineries | BEIS | ||
| - Iron and steel | International Steel Statistics | ||
| Source: Office for National Statistics, GDP source catalogue | |||
Download this table Table 14: Industries under review for future use of Value Added Tax
.xls (28.2 kB)5.3 Continued delivery of VAT turnover in the national accounts
For strata where VAT data have already been included, the data will be used in national accounts when the revisions policy allows for its inclusion. Table 15 outlines when VAT will be used.
Table 15: Planned revisions for the monthly GDP cycle commencing with the gross domestic product second estimate, Quarter 3 (July to Sept) 2017
| Month of publication | First period being revised | Comments | VAT data taken on | VAT periods | VAT periods taken on for first time |
|---|---|---|---|---|---|
| Dec-17 | Q1 (Jan to Mar) 2016 | Quarterly national accounts estimate Q3 (July to Sept) 2017 | Yes | 2016Q1 - 2017Q2 | 2016Q1 - 2017Q2 |
| Jan-18 | Q4 (Oct to Dec) 2017 | Preliminary estimate of GDP Q4 (Oct to Dec) 2017 | No | N/A | |
| Feb-18 | Q1 (Jan to Mar) 2017 | Second estimate of GDP Q4 (Oct to Dec) 2017 | No | N/A | |
| Mar-18 | Q1 (Jan to Mar) 2017 | Quarterly national accounts estimate Q4 (Oct to Dec) 2017 | Yes | 2017Q1 - 2017Q3 | 2017Q3 |
| Apr-18 | Q1 (Jan to Mar) 2018 | Preliminary estimate of GDP Q1 (Jan to Mar) 2018 | No | N/A | |
| May-18 | Q1 (Jan to Mar) 2018 | Second estimate of GDP Q1 (Jan to Mar) 2018 | No | N/A | |
| Jun-18 | Fully open for revision | Quarterly national accounts estimate Q1 (Jan to Mar) 2018 | Yes | 2016Q1 - 2017Q4 | 2017Q4 |
| Source: Office for National Statistics | |||||
Download this table Table 15: Planned revisions for the monthly GDP cycle commencing with the gross domestic product second estimate, Quarter 3 (July to Sept) 2017
.xls (37.4 kB)In support of this continuing use of VAT data, a Quality and Methodology Information report on VAT will be developed and published during the first half of 2018. This will support the use of VAT data in regional estimates of gross value added, regional short-term indicators and the new national accounts VAT data source building block.
5.4 Use of VAT data in regional accounts
An article Supporting devolution: developments in regional and local statistics published in May 2016 outlines a timetable to produce regional short-term indicators and improved estimates of regional gross value added over the medium-term. Estimates of VAT turnover and expenditure at micro level, with associated metadata, are fundamental to realising these aims and we will report on progress in forthcoming research articles.
An article, Regional gross value added (balanced), UK: 1998 to 2016 was published on 20 December 2017 and used VAT turnover data in 2016, apportioned to the 12 UK regions, to calculate regional gross value added weights.
Back to table of contents6. Previous VAT articles
Office for National Statistics has published ten previous articles about incorporating reporting unit level Value Added Tax (VAT) data into national accounts, describing developments and the path taken. These articles are detailed in this section.
Feasibility study into the use of HMRC turnover data within Short-term Output Indicators and National Accounts (14 August 2015) described how VAT data could be matched to Inter-Departmental Business Register and looked at the response rate lag, as well as the coverage.
Exploitation of HMRC VAT data (7 October 2015) described the international context of VAT and looked at improving apportionment, as well as other uses for VAT data.
HMRC VAT update December 2015 (21 December 2015) examined the stratum breakdown and provided some initial analysis of the comparison of VAT and Monthly Business Survey (MBS) data in a few industries.
HMRC VAT update April 2016 (4 April 2016) introduced a pilot of 10 Index of Services industries to examine.
VAT update July 2016 (12 July 2016) looked at ending the pilot, to allow development of new IT systems. They set a target of incorporating VAT data into gross domestic product (GDP) estimate by the end of 2017.
VAT turnover, initial research analysis, UK: January 2014 to March 2016 (6 October 2016) looked at VAT data for the whole economy.
VAT turnover, research analysis, UK: January 2014 to March 2016 (2 February 2017) announced that VAT data would only be used from small- and medium-sized businesses. It presented a breakdown of current prices VAT data in three Index of Services industries.
VAT turnover implementation into national accounts: June update (1 June 2017) announced adjustments to the national accounts revisions timetable, ensuring that VAT data releases would not cause additional revisions to Index of Production and Index of Construction.
VAT turnover implementation into national accounts: November update (20 November 2017) summarised the methodology used so far.
VAT turnover implementation into national accounts: December 2017 update (22 December 2017) showed the impact of inclusion of the first round of VAT data into UK National Accounts.
Back to table of contents