Table of contents
1. Main points
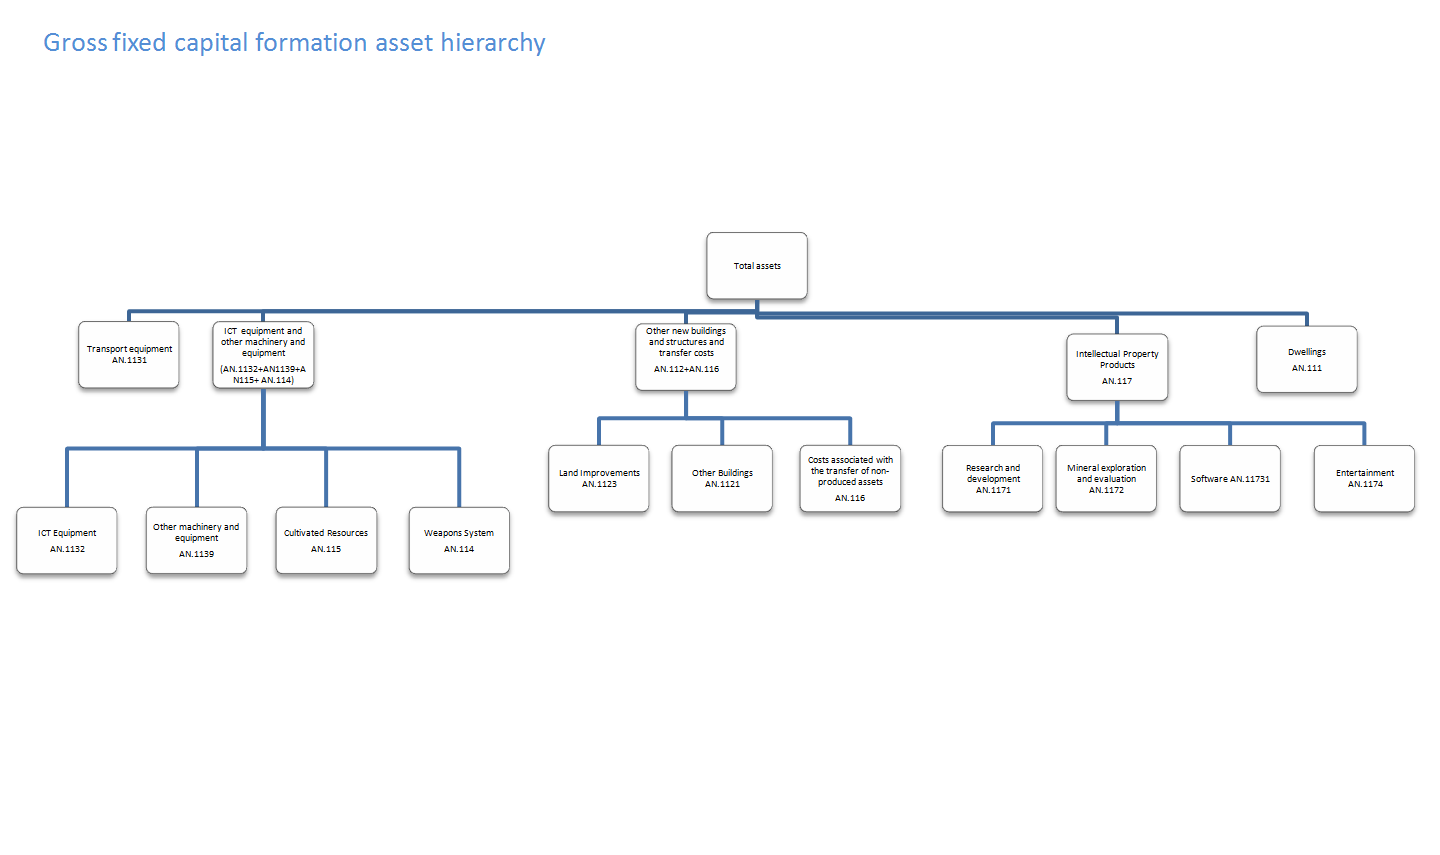
These estimates are short-term indicators of investment in assets, such as dwellings, transport equipment, machinery, buildings and intangible assets. This release covers asset breakdowns of total gross fixed capital formation (GFCF), of which business investment is one component
All investment data referred to are estimates of seasonally adjusted chained volume measures
In Quarter 3 (July to Sept) 2015, GFCF was estimated to have increased by £1.0 billion (1.3%), compared with the previous quarter, to £77.3 billion. This is the highest level since Quarter 4 (Oct to Dec) 2007
In Quarter 3 (July to Sept) 2015, business investment was estimated to have increased by £0.9 billion (2.2%), compared with the previous quarter, to £44.4 billion
In Quarter 3 (July to Sept) 2015, GFCF was estimated to have increased by 3.4% compared with Quarter 3 (July to Sept) 2014
In Quarter 3 (July to Sept) 2015, business investment increased by 6.6% compared with Quarter 3 (July to Sept) 2014
There are no revisions to previous quarters in this release
2. About this release
The estimates in this release are short-term indicators of investment in non-financial assets in the UK, such as dwellings, transport equipment, machinery, buildings and intellectual property products. This release covers not only business investment, but asset and sector breakdowns of total gross fixed capital formation (GFCF), of which business investment is one component.
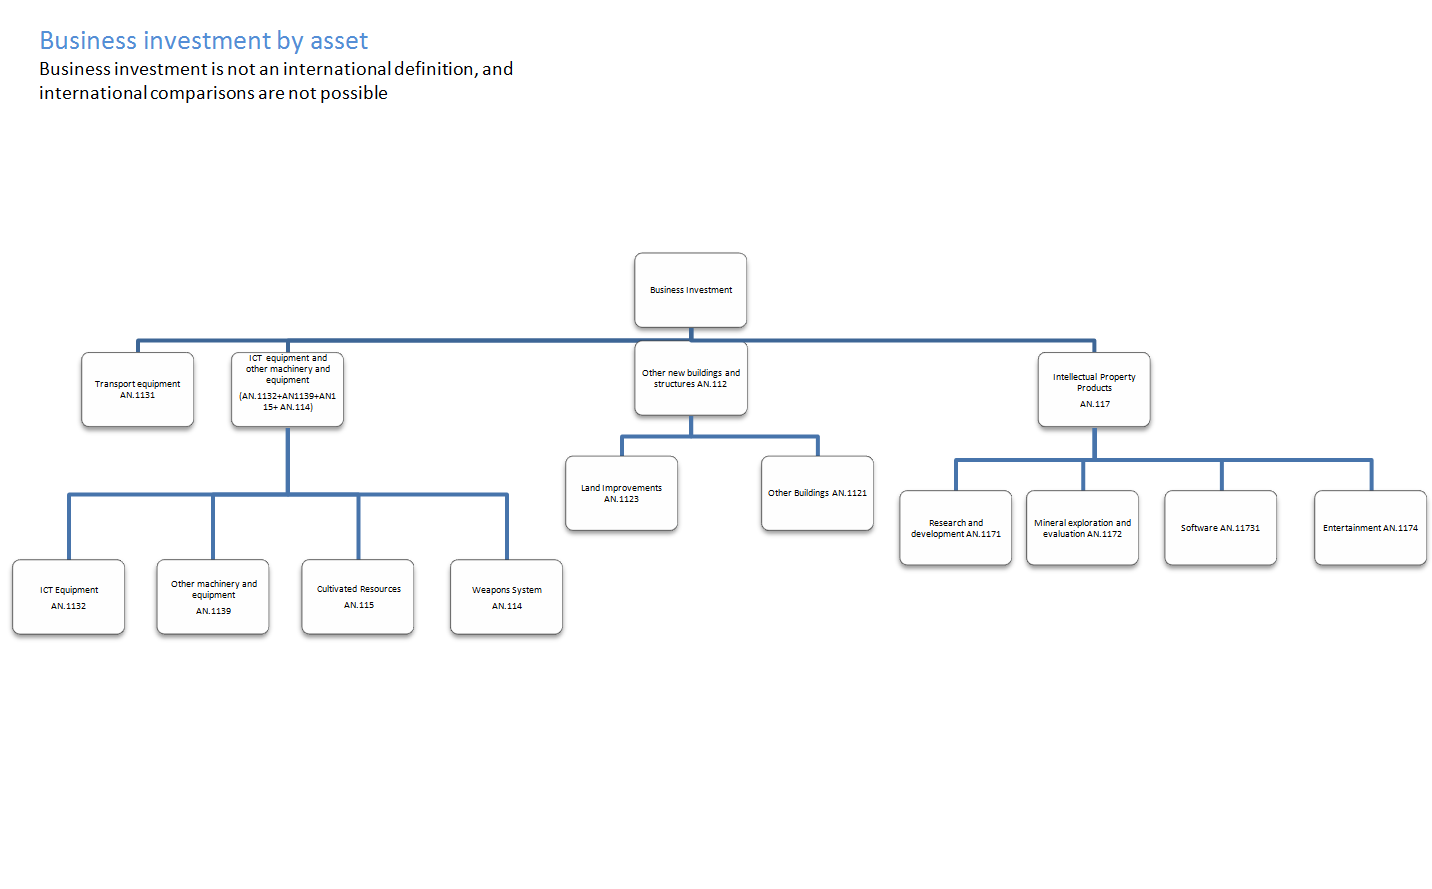
Business investment is net investment by private and public corporations, these include investments in:
transport
information, technology and communications (ICT) equipment
other machinery and equipment
cultivated assets
intellectual property products (IPP, which includes investment in software, research and development, artistic originals and mineral exploration)
buildings and other structures
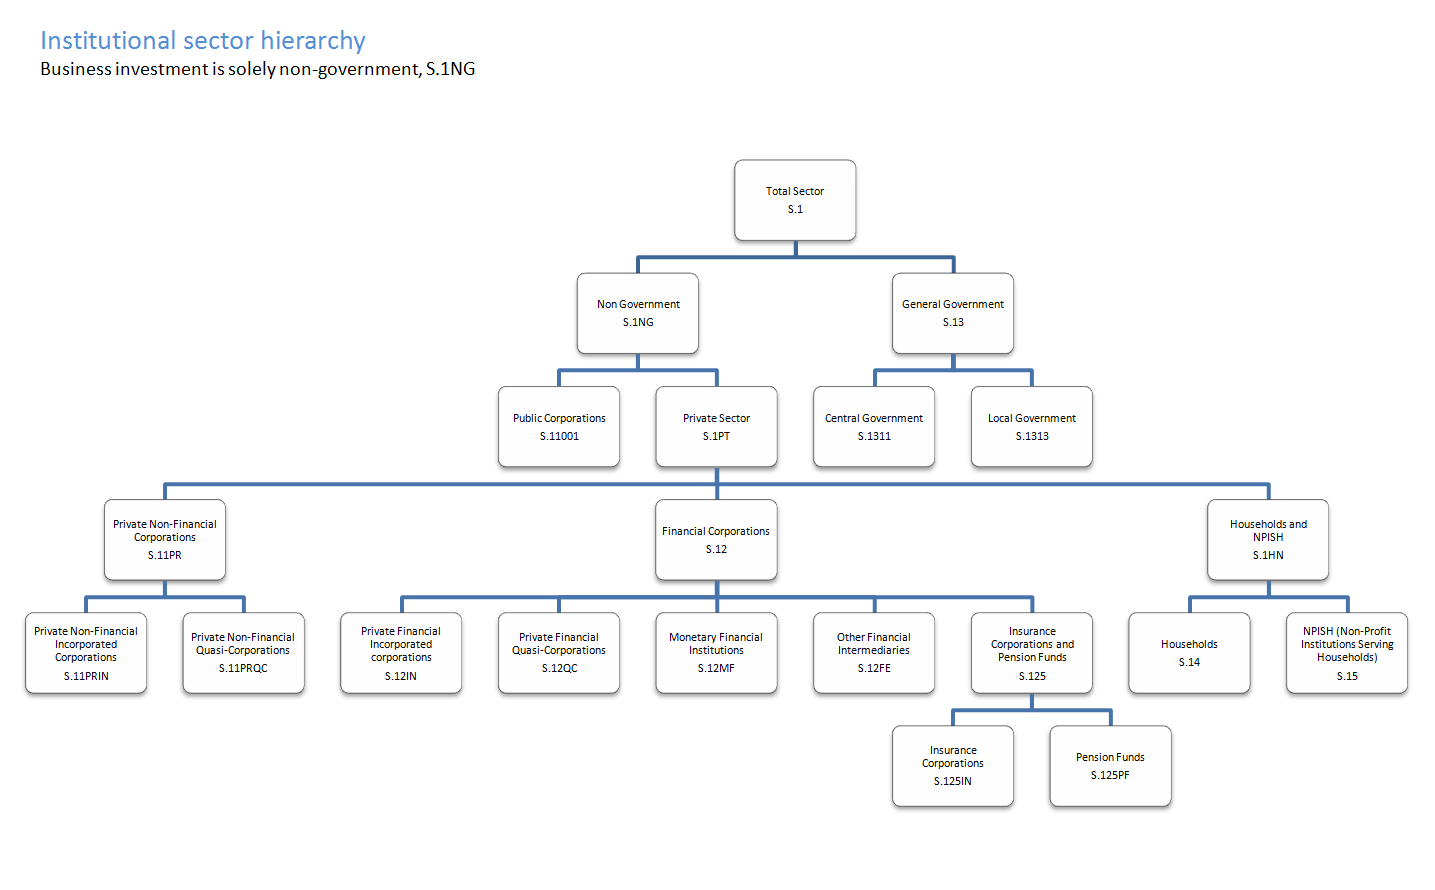
It does not include investment by central or local government, investment in dwellings or the costs associated with the transfer of non-produced assets (such as land). A full sector and asset hierarchy can be found in the background notes. Note that business investment is not an internationally recognised concept and therefore it should not be used to make international comparisons.
All investment data referred to in this bulletin are estimates of seasonally adjusted chained volume measures.
Back to table of contents3. Changes to the Quarterly Survey of Capital Expenditure and methodological information
Changes to the Quarterly Survey of Capital Expenditure in Quarter 1 (Jan to Mar) 2015
As described in the Business Investment, Quarter 4 (Oct to Dec) 2014 Revised Results bulletin and in Changes to the Annual Business Survey, the Quarterly Survey of Capital Expenditure and the Survey into Business Spending on Capital Items, in 2015 (114.3 Kb Pdf) , we moved to the Quarterly Acquisitions and Disposals of Capital Assets Survey (QCAS) from the Quarterly Survey of Capital Expenditure (CAPEX). The main reason is to move to the updated European System of Accounts (ESA) 2010 manual, the international guidance for national accounts.
The main changes to the survey are:
adding new questions to improve the quality of our estimates and to meet the latest European legislation requirements (ESA 2010)
removing the lower limit of £500 for the value of reported assets, so all relevant assets (even those below businesses’ Asset Register threshold) can be reported
including small tools used in production in the definition of GFCF
improving the questionnaire’s layout, including new sections and headings, to make completing the questionnaire easier
The data from the new questions will not be included in estimates of GFCF and its components until 2017, when there will be 2 years of data available for quality assurance.
Further methodological information including changes to the UK National Accounts
Estimates in this release have been compiled under ESA 2010 concepts and definitions, in compliance with the UK’s legal obligations in producing the National Accounts. Articles are available describing the methodology used to estimate GFCF and the impact of the changes implemented for ESA10 in September 2014.
On 19 May 2015 we published several articles explaining the changes that were implemented in the UK National Accounts (Blue Book) 2015, published 30 October 2015. These articles describe changes related to ongoing work to meet ESA 1995 requirements. These include changes that impact GFCF and its components, specifically spending on repairs and maintenance of dwellings and exhaustiveness. There is a comprehensive list of all published articles relating to changes to the UK National Accounts (Blue Book).
Forecast data
Not all data required for the compilation of GFCF and its components are available for the latest period at the time of publication. For these components, the latest period is forecast. In this release this includes government investment, investment in new dwellings and improvements to dwellings, investment in research and development, and investment in artistic originals.
Revisions
No periods have been revised in this release.
Back to table of contents4. Gross fixed capital formation and business investment
Figure 1: Annual gross fixed capital formation chained volume measures
Reference year: 2012, Coverage: UK
Source: Office for National Statistics
Notes:
- The data in this chart covers 1998 to 2014
Download this chart Figure 1: Annual gross fixed capital formation chained volume measures
Image .csv .xls
Figure 2: Quarterly gross fixed capital formation chained volume measures, seasonally adjusted
Reference year: 2012, Coverage: UK
Source: Office for National Statistics
Notes:
- Q1 = Quarter 1 (January to March), Q2 = Quarter 2 (April to June), Q3 = Quarter 3 (July to September), Q4 = Quarter 4 (October to December)
- The data in this chart covers Quarter 3 (July to Sept) 1997 to Quarter 3 (July to Sept) 2015
Download this chart Figure 2: Quarterly gross fixed capital formation chained volume measures, seasonally adjusted
Image .csv .xls
Figure 3: Annual business investment chained volume measures
Reference year: 2012, Coverage: UK
Source: Office for National Statistics
Notes:
- The data in this chart covers 1998 to 2014
Download this chart Figure 3: Annual business investment chained volume measures
Image .csv .xls
Figure 4: Quarterly business investment chained volume measures, seasonally adjusted
Reference year: 2012, Coverage: UK
Source: Office for National Statistics
Notes:
- Q1 = Quarter 1 (January to March), Q2 = Quarter 2 (April to June), Q3 = Quarter 3 (July to September), Q4 = Quarter 4 (October to December)
- The data in this chart covers Quarter 3 (July to Sept) 1997 to Quarter 3 (July to Sept) 2015
Download this chart Figure 4: Quarterly business investment chained volume measures, seasonally adjusted
Image .csv .xlsFigure 4 shows a large spike in business investment in Quarter 2 (Apr to June) 2005. This is due to the transfer of British Nuclear Fuels Ltd (BNFL). In April 2005, nuclear reactors were transferred from BNFL to the Nuclear Decommissioning Authority (NDA). BNFL is classified as a public corporation in National Accounts, while the NDA is a central government body. The business investment series includes investment by public corporations, but not government spending, the positive spike reflects the £15.6 billion transfer. More information on the transfer of BNFL can be found in section 3 of the background notes.
Summary tables
In Quarter 3 (July to Sept) 2015 total gross fixed capital formation increased by an estimated £1.0 billion (1.3%) compared with the previous quarter. Business investment saw an increase of 2.2%, rising by an estimated £0.9 billion. Additionally, general government saw an increase of 4.5%, rising by an estimated £0.6 billion. These increases were partially offset by a decrease in private sector cost of ownership transfer on non-produced assets of an estimated £0.6 billion (12.1%).
Table 1a: Total gross fixed capital formation in the UK by institutional sector, Quarter 3 (July to Sept) 2015
| % change | £ million | |||
| Most recent quarter on previous quarter | Most recent quarter on a year earlier | Most recent level ** | Level change from previous quarter | |
| Gross fixed capital formation | 1.3 | 3.4 | 77,322 | 1,007 |
| Business investment | 2.2 | 6.6 | 44,423 | 945 |
| General government | 4.5 | 5.2 | 12,776 | 556 |
| Public corporations dwellings | 2.7 | 9.0 | 960 | 25 |
| Public corporations cost of ownership transfer on non-produced assets | 0.9 | -28.9 | -113 | -1 |
| Private sector dwellings | 0.6 | -1.9 | 14,871 | 91 |
| Private sector cost of ownership transfer on non-produced assets | -12.1 | -13.5 | 4,405 | -609 |
| Source: Office for National Statistics | ||||
Download this table Table 1a: Total gross fixed capital formation in the UK by institutional sector, Quarter 3 (July to Sept) 2015
.xls (26.6 kB)In Quarter 3 (July to Sept) 2015, other buildings and structures and transfer costs saw the largest level increase rising by an estimated £1.2 billion (5.1%). Dwellings saw the second highest level increase of an estimated £0.5 billion (3.3%). These increases were partially offset by a decrease in intellectual property products of an estimated £0.7 billion (4.1%).
Table 1b: Total gross fixed capital formation in the UK by asset, Quarter 3 (July to Sept) 2015
| % change | £ million | |||
| Most recent quarter on previous quarter | Most recent quarter on a year earlier | Most recent level ** | Level change from previous quarter | |
| Gross fixed capital formation | 1.3 | 3.4 | 77,322 | 1,007 |
| Transport equipment | -9.4 | 0.3 | 2,930 | -304 |
| ICT equipment and other machinery and equipment | 2.0 | 7.5 | 16,590 | 320 |
| Dwellings | 3.3 | -0.3 | 16,037 | 517 |
| Other buildings and structures and transfer costs | 5.1 | 2.9 | 24,733 | 1,210 |
| Intellectual property products | -4.1 | 4.4 | 17,032 | -736 |
| Source: Office for National Statistics | ||||
Download this table Table 1b: Total gross fixed capital formation in the UK by asset, Quarter 3 (July to Sept) 2015
.xls (26.1 kB)5. Economic background
Business investment grew by 2.2% in Quarter 3 (July to Sept) 2015, a 0.6 percentage point increase in the growth rate from the previous quarter. Supported by this stronger growth in business investment, the rate of increase in Gross Fixed Capital Formation (GFCF) also picked up to 1.3% in Quarter 3 (July to Sept) 2015.
This was the fourth consecutive quarter of positive growth in business investment, with the level of investment now 6.6% higher than in the third quarter (July to Sept) of 2014. As the largest component of GFCF, the increase in business investment contributed 1.2 of the 1.3 percentage points (pp) of total quarterly growth. The increase in business investment in Quarter 3 (July to Sept) coincided with an easing in corporate financing conditions, with the cost of borrowing still low as a result of historically low interest rates. These developments have been highlighted in the Bank of England’s November Inflation Report, which also noted that businesses’ investment intentions continue to indicate robust rates of investment growth in the near term.
Growth in investment was also seen in the general government sector, which saw a 4.5% quarterly rate of increase and a 0.7pp contribution to total GFCF growth. However, the growth in business and government investment was partially offset by a 2.6% fall in “other” private sector investment1.
By asset class, the main contributors to the growth in overall GFCF were investment in other buildings and structures and transfer costs, and investment in dwellings, which grew by 5.1% and 3.3% respectively. This increase in investment has coincided with a shortage of supply in the real estate market, which has supported price growth. The Bank of England’s Agents’ Summary of Business Conditions for Q3 reported that shortages of commercial property had put upward pressure on prices. Similarly, the ONS House Price Index continues to show robust house price growth, reflecting a mismatch between supply and demand. With returns on savings so low, the strong price growth in real estate markets could be stimulating an increase in investment in buildings and houses.
ICT equipment and other machinery assets also saw an increase in investment in Quarter 3 (July to Sept) 2015, while falls in intellectual property product investment and transport equipment investment acted as a drag on GFCF growth.
The strong performance in business investment over recent quarters reflects positive outturns from a range of broader economic indicators. Low inflation and an improvement in labour market outcomes has continued to strengthen household real incomes, and coupled with sustained economic growth have helped drive the recovery in domestic demand. This recovery, combined with the increasing capacity constraints highlighted in the October Economic Review, is likely to have supported the recent investment growth.
Notes for economic background
- “Other” private sector investment includes investment in private sector “dwellings” and private sector “costs on ownership transfer of non-produced assets”.
6. Where to find more of our data
We also publish additional analyses of GFCF, business investment, and the Quarterly Acquisitions and Disposals of Capital Assets Survey, which have been created in response to ad hoc user requests. Enquiries about ad hoc requests may be made to gcf@ons.gov.uk.
Back to table of contents7. Adjustments, revisions and response rates
Adjustments
Large capital expenditure tends to be reported later in the data collection period than smaller expenditure. This means that larger expenditures are often included in the revised (month 3) results, but are not reported in time for the provisional (month 2) results, leading to a tendency towards upwards revisions in the later estimates for business investment and GFCF. Following investigation of the impact of this effect, from Quarter 3 (July to Sept) 2013, a bias adjustment was introduced to GFCF and its components in the provisional estimate.
A bias adjustment of £0.5 billion for Quarter 3 (July to Sept) 2015 has been included in this release. This adjustment will be reassessed in the revised results when the survey response rates improve. Users should note that the bias adjustment is a best estimate of the QCAS and the estimate may still be revised either up or down. Therefore, GFCF and business investment will be subject to revision in the Quarter 3 (July to Sept) 2015 revised (month 3) release. The bias adjustment is intended to reduce the average size of revisions over time. It is not possible to ascertain the direction of any such revisions.
The Quarterly Survey of Capital Expenditure was improved by adding clearer instructions. As detailed in the provisional Quarter 1 (Jan to Mar) 2015 Business Investment release, feedback from some respondents indicated that they had been misreporting their asset breakdown and were correcting this on the new questionnaire. We found that some respondents were reporting new construction work (NCW) as other capital equipment (OCE). From Quarter 1 (Jan to Mar) 2015 respondents to the survey are now reporting more in new construction work at the expense of other capital equipment. In order to remain consistent with the previous data, we have made some adjustments to the assets in the current price series in Quarter 3 (July to Sept) 2015, quality adjustments on asset buildings (-£2.1 billion) and other machinery (+£2.1 billion). These adjustments will be reviewed as the survey response increases.
Survey response rates
Table 2 presents the provisional (month 2) response rates for the Quarterly Acquisitions and Disposals of Capital Assets Survey (QCAS). The estimates in this release are based on the Quarter 3 (July to Sept) 2015 month 2 (provisional) survey results.
Table 2: UK response rates for quarterly acquisitions and disposals of capital assets survey, Quarter 3 (July to Sept) 2014 to Quarter 3 (July to Sept) 2015
| Period | Survey response rates / % | |
| At month 2 (Provisional) | ||
| 2014 | Q3 | 78.7 |
| Q4 | 80.1 | |
| 2015 | Q1 | 67.3 |
| Q2 | 70.8 | |
| Q3 | 72.1 | |
| At month 3 (Revised) | ||
| 2014 | Q3 | 91.7 |
| Q4 | 94.4 | |
| 2015 | Q1 | 88.8 |
| Q2 | 81.4 | |
| Source: Office for National Statistics | ||
| Notes: | ||
| 1. Q1 = Quarter 1 (January to March), Q2 = Quarter 2 (April to June), Q3 = Quarter 3 (July to September), Q4 = Quarter 4 (October to December) | ||