Table of contents
- Main points
- Future changes
- About this release
- Gross fixed capital formation and business investment
- Summary tables
- Revisions to gross fixed capital formation (GFCF) and business investment
- Economic background
- Where to find more of our data
- Adjustments and response rates
- Quality and methodology
- Background notes
1. Main points
Gross fixed capital formation (GFCF), in volume terms, was estimated to have increased by 1.6% to £78.1 billion between Quarter 1 (Jan to Mar) 2016 and Quarter 2 (Apr to June) 2016.
Between Quarter 1 2016 and Quarter 2 2016, business investment, in volume terms, was estimated to have increased by 1.0%, from £43.4 billion to £43.8 billion; revised up 0.5 percentage points from the previously estimated 0.5% increase.
Between Quarter 2 2015 and Quarter 2 2016, GFCF was estimated to have increased by 1.0%, from £77.3 billion to £78.1 billion.
Business investment was estimated to have decreased by 0.8% between Quarter 2 2015 and Quarter 2 2016, from £44.2 billion to £43.8 billion. This is unrevised from the previous estimate.
In line with the National Accounts Revisions Policy, the earliest period being revised in this release is Quarter 1 2015.
Back to table of contents2. Future changes
Introduction of theme days
From January 2017 we are improving the way we publish economic statistics, with related data grouped together under new "theme" days. This will increase the coherence of our data releases and involve minor changes to the timing of certain publications. For more information see Changes to publication schedule for economic statistics.
Changes to GFCF estimation system
We are currently redeveloping the GFCF estimation system in line with the 5-year strategy for the UK National Accounts, 2015 to 2020 published in July 2015 and recommendations from the Bean Review. As a result we will be introducing some methodological changes to the new GFCF system, including improved deflation and seasonal adjustment methodology. We will be publishing more information on the impact of these changes on the GFCF dataset prior to its introduction ahead of Blue Book 2017.
Purchased software
Following a quality review it has been identified that the methodology used to estimate elements of purchased software within gross fixed capital formation (GFCF) has led to some double counting from 1997 onwards. When this issue is amended in The Blue Book 2017 it will reduce the level of GFCF across the period by around 1.1% per year. The average impact on quarter-on-quarter GFCF growth is negative 0.02% and the average impact on quarter-on-quarter GDP growth is 0.00%.
Back to table of contents3. About this release
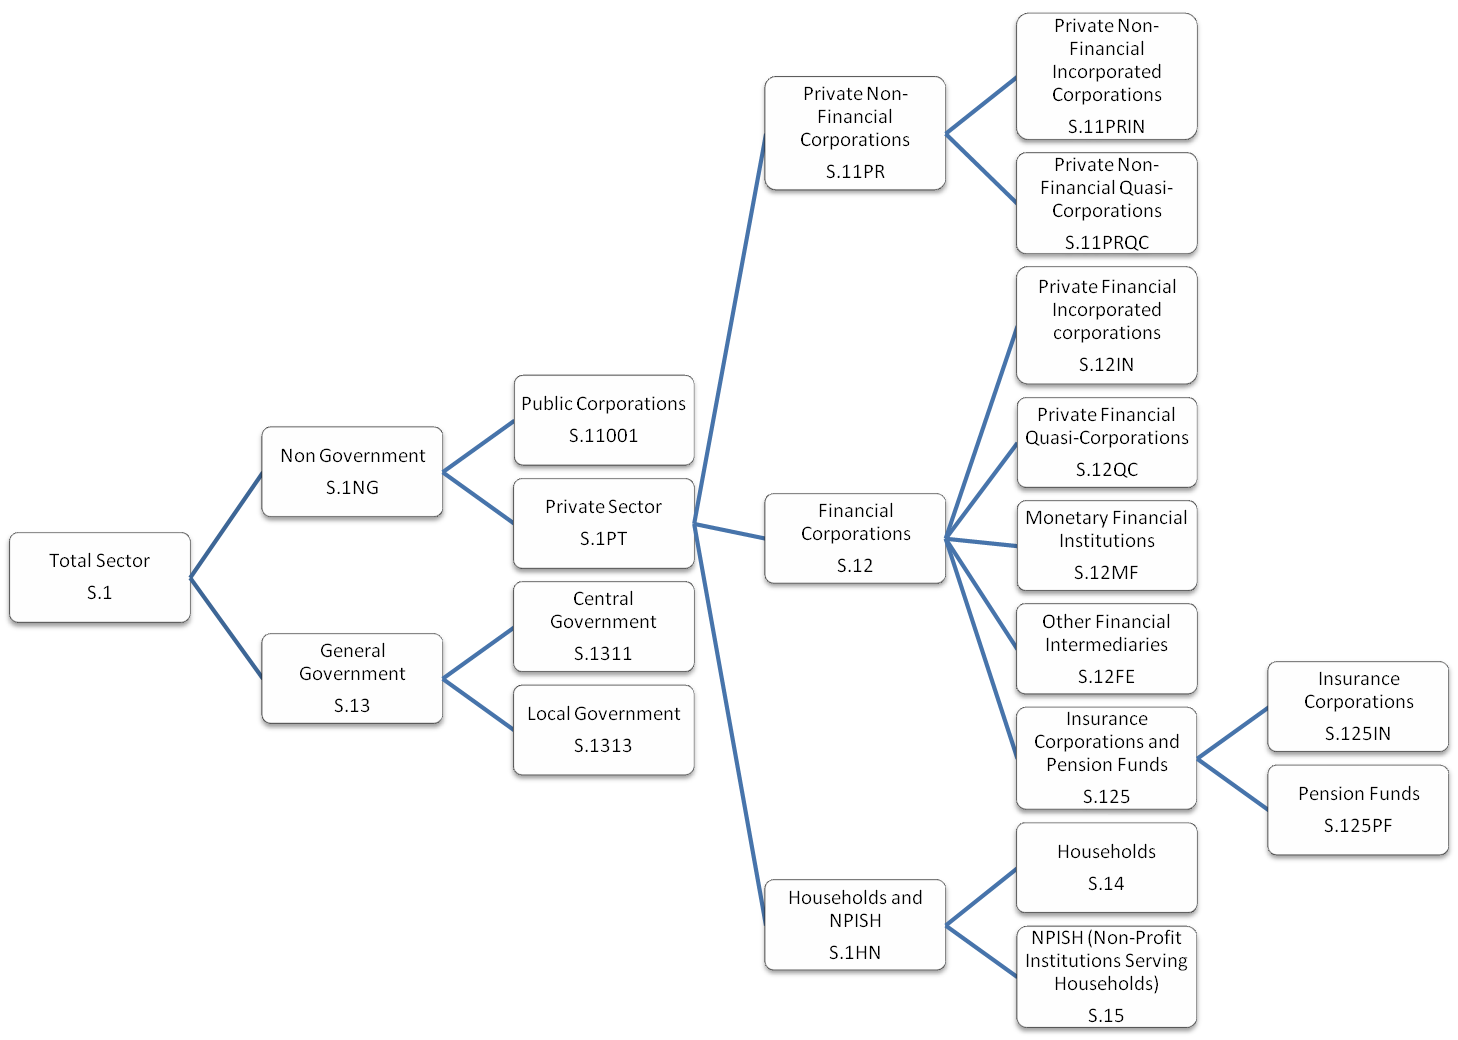
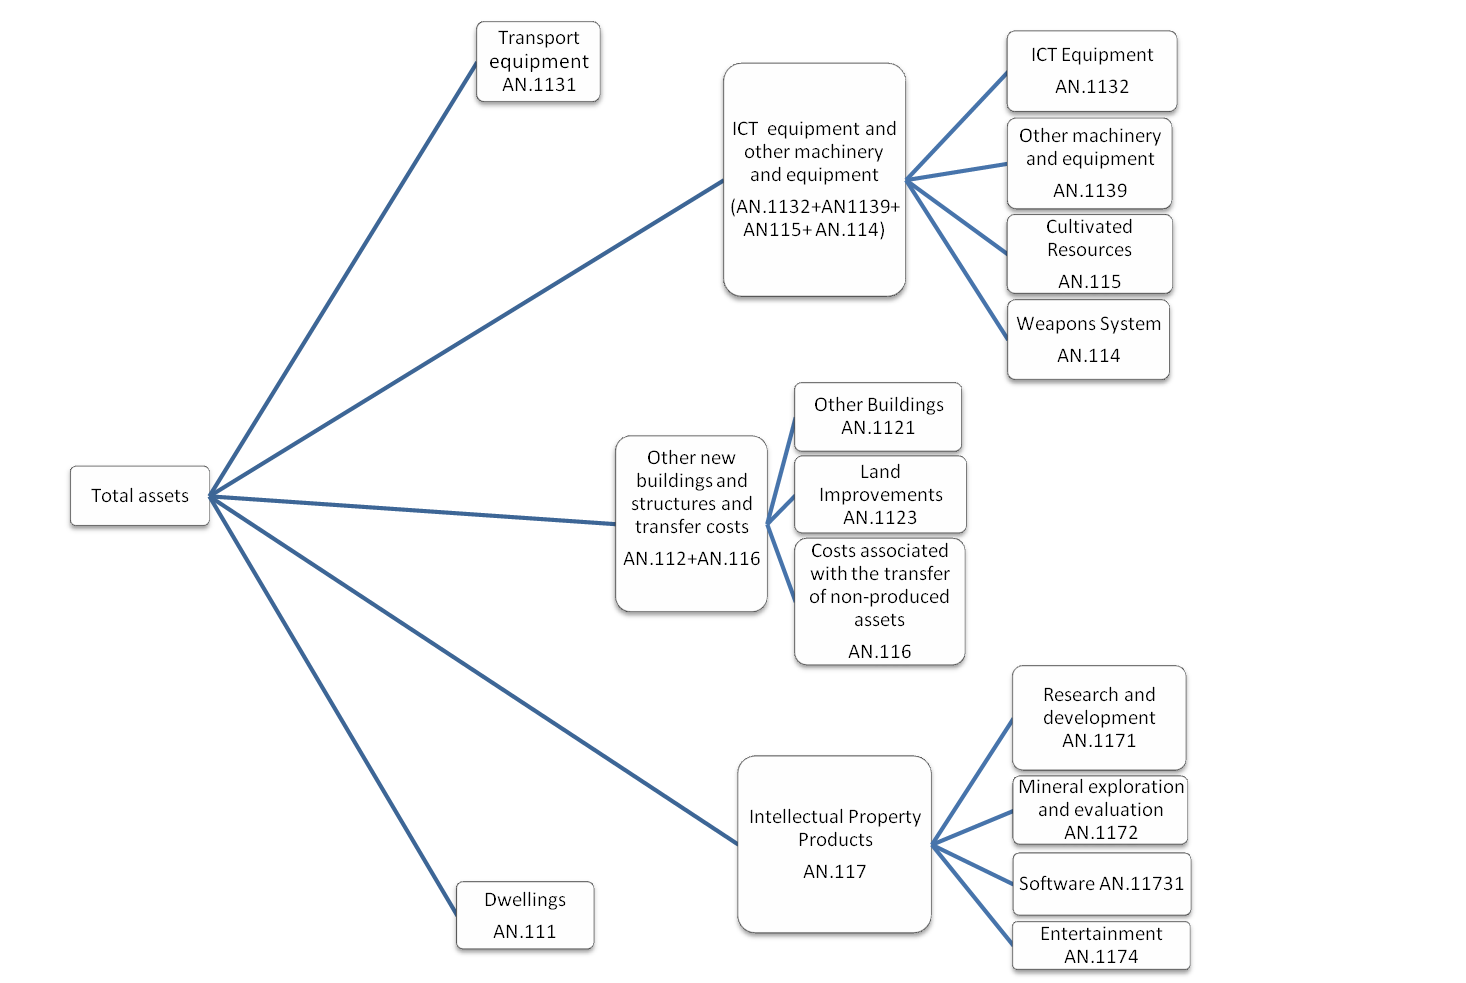
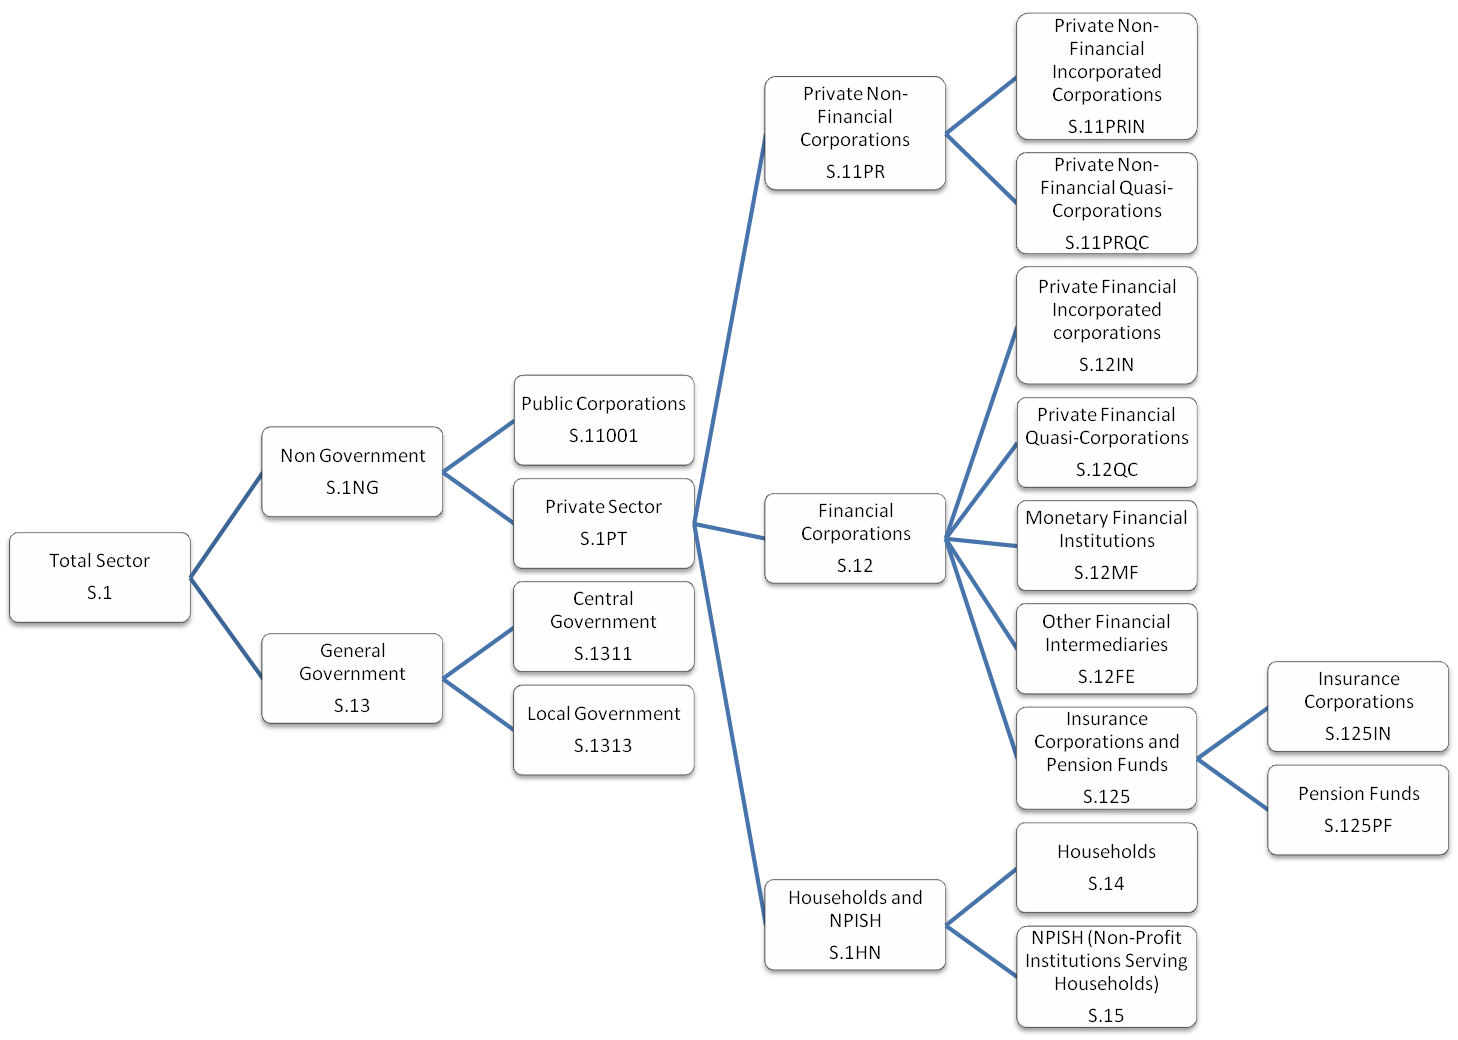
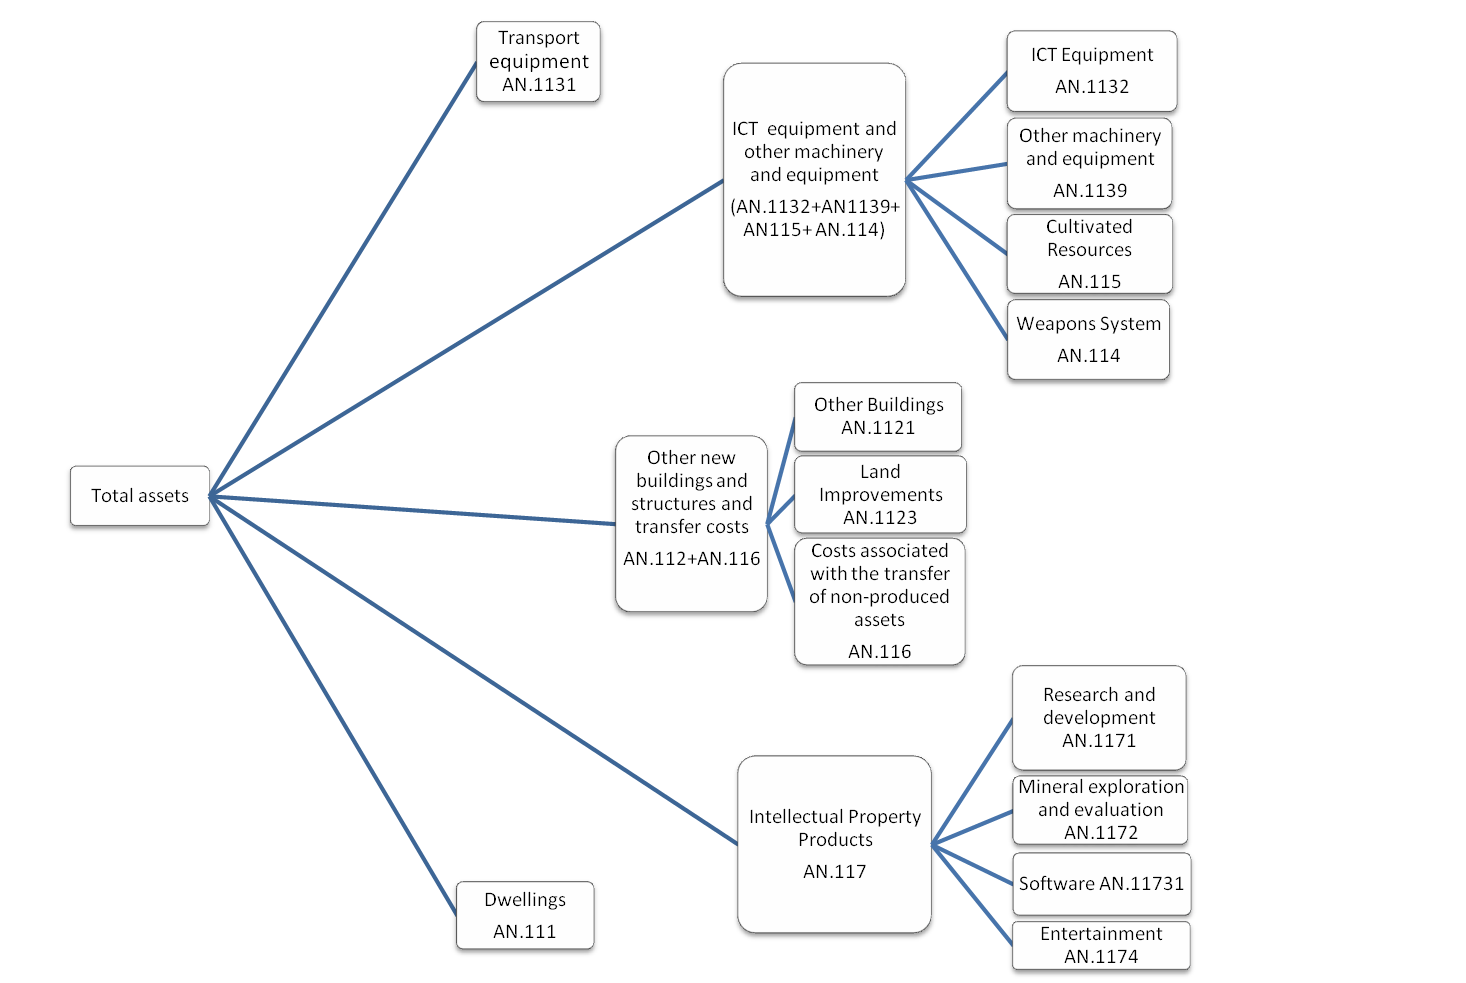
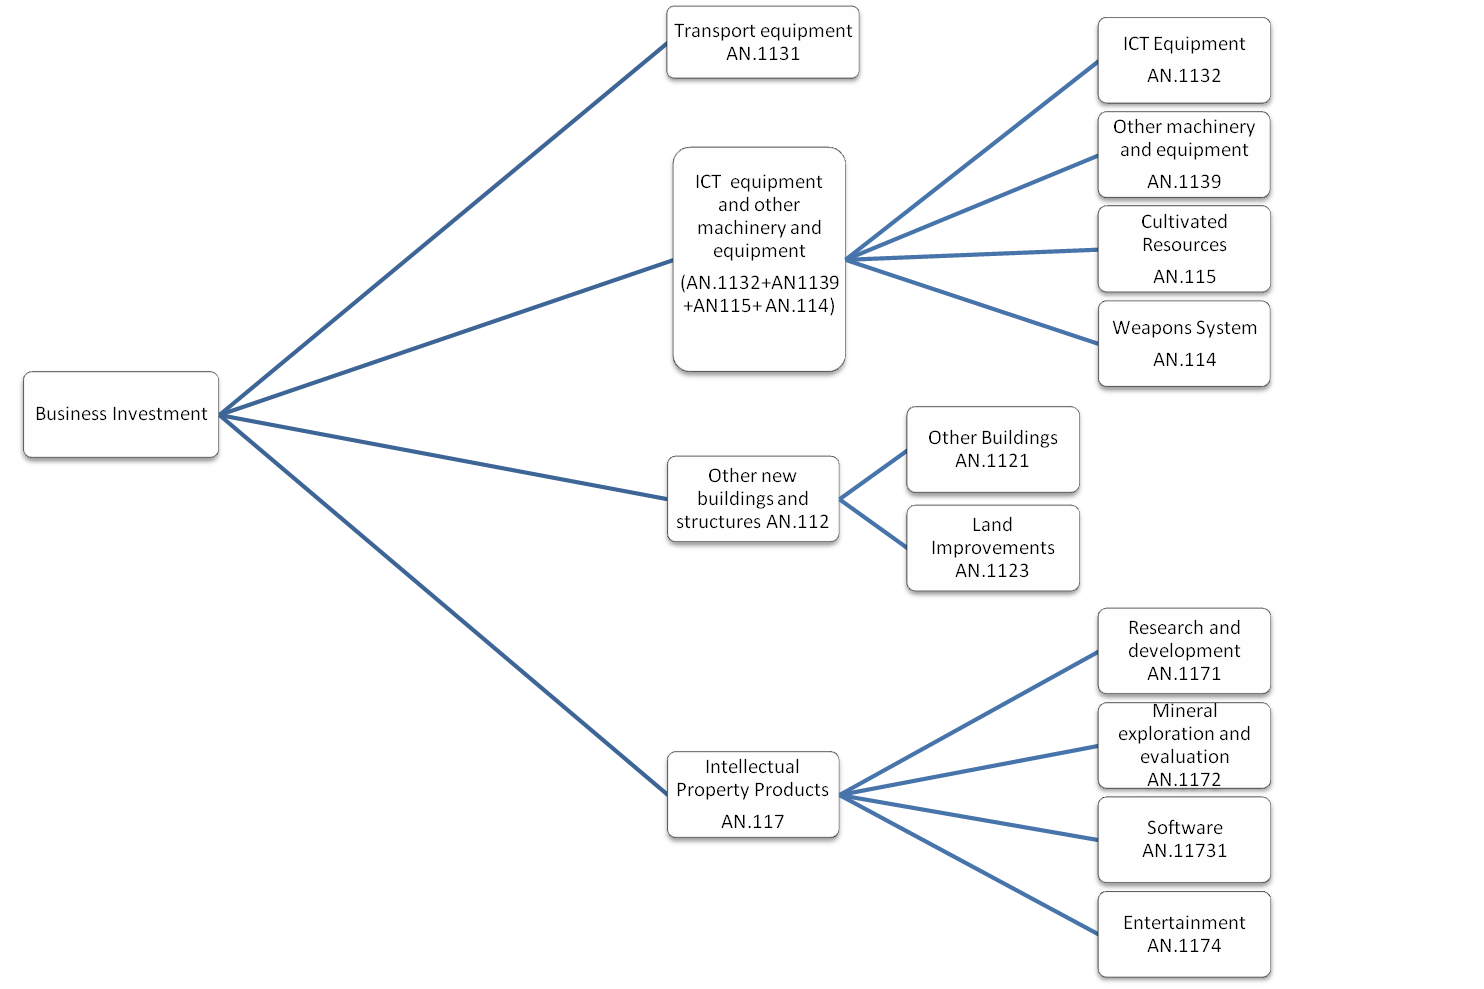
The estimates in this release are short-term indicators of investment in non-financial assets in the UK, such as dwellings, transport equipment, machinery, buildings and intellectual property products. This release covers not only business investment, but asset and sector breakdowns of total gross fixed capital formation (GFCF), of which business investment is one component.
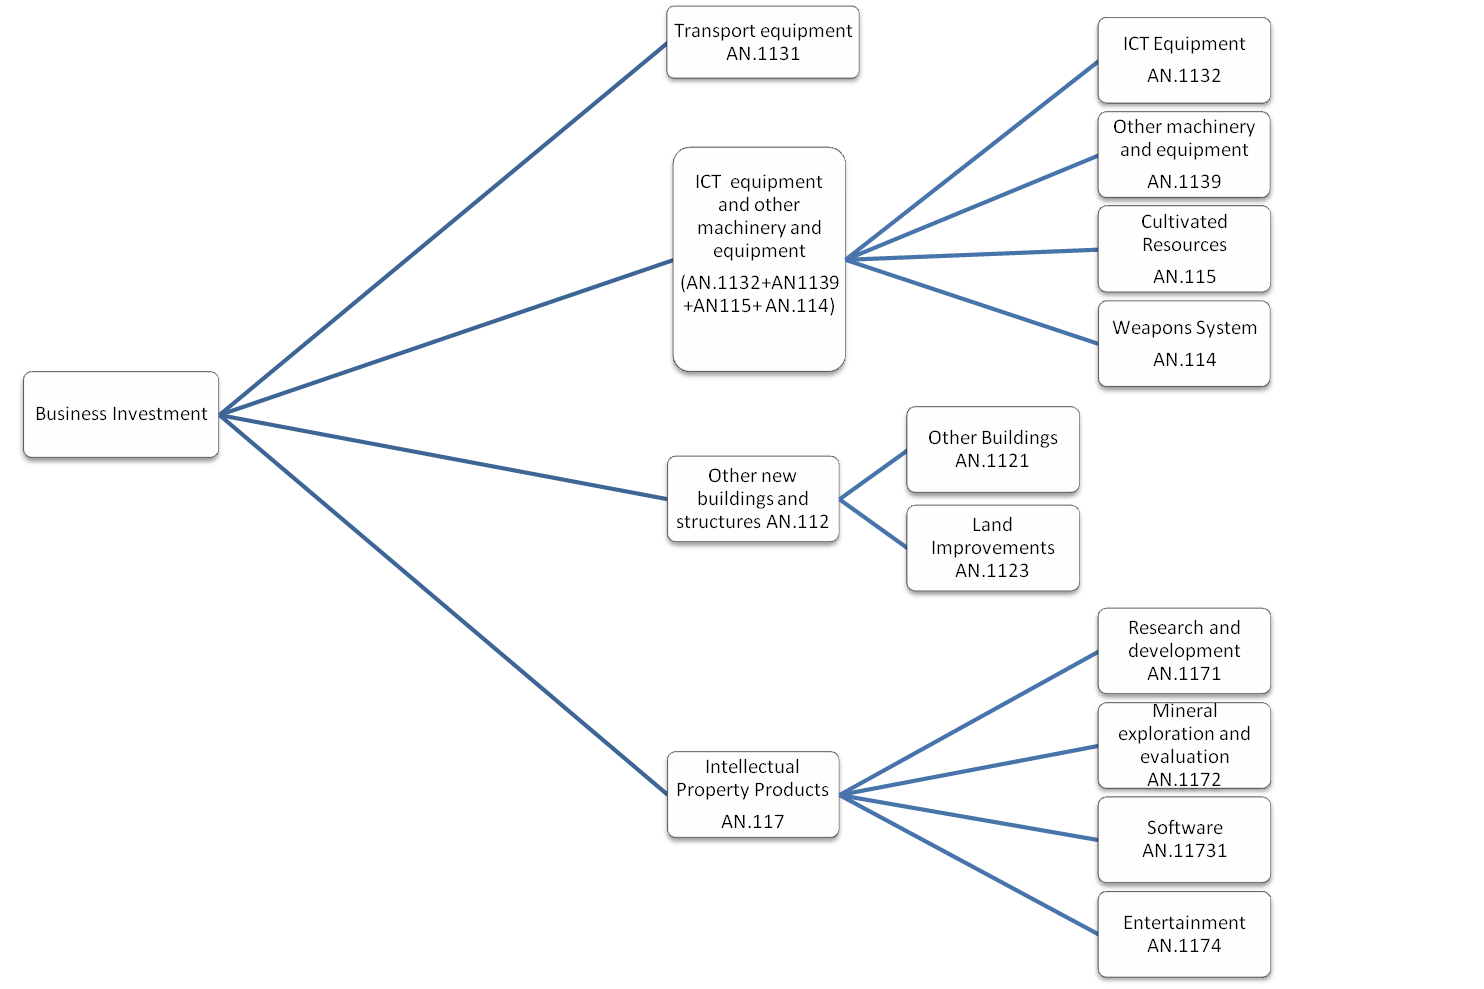
Business investment is net investment by private and public corporations. These include investments in:
transport
information and communication technology (ICT) equipment
other machinery and equipment
cultivated assets
intellectual property products (IPP, which includes investment in software, research and development, artistic originals and mineral exploration)
buildings and other structures
It does not include investment by central or local government, investment in dwellings, or the costs associated with the transfer of non-produced assets (such as land). A full sector and asset hierarchy can be found in the background notes. Business investment is not an internationally recognised concept and therefore it should not be used to make international comparisons.
All investment data referred to in this bulletin are estimates of seasonally adjusted chained volume measures.
Back to table of contents4. Gross fixed capital formation and business investment
Figures 1 and 2 show that in Quarter 2 (Apr to June) 2016, gross fixed capital formation (GFCF) increased by £1.2 billion (1.6%) compared with Quarter 1 (Jan to Mar) 2016. This increase follows 2 consecutive decreases for GFCF of 1.3% in Quarter 4 (Oct to Dec) 2015 and 0.1% in Quarter 1 2016. GFCF in Quarter 2 2016 was £78.1 billion, 1.0% higher than Quarter 2 2015 (Figure 2).
The GFCF increase in Quarter 2 2016 was mainly caused by general government investment, which increased by £0.9 billion compared with the previous quarter. The majority of growth in general government came from investment in other buildings and structures.
The general government increase has been partially offset by falls in private sector cost of ownership transfer on non-produced assets (£0.2 billion). As described in the Quarter 2 2016 Business investment provisional release, this fall in transfer costs follows an increase of 4.5% in Quarter 1 2016. The Bank of England’s Summary of Business Conditions published in May 2016 suggested this increase could be a result of the bringing forward of buy-to-let purchases, ahead of the introduction of the rise in Stamp Duty on additional properties in April 2016.
Figure 1: Quarterly levels of gross fixed capital formation, chained volume measure, seasonally adjusted
Reference year: 2013, Coverage: UK
Source: Office for National Statistics
Notes:
- Q1 = Quarter 1 (Jan to Mar).
- Q2 = Quarter 2 (Apr to June).
- Q3 = Quarter 3 (July to Sept).
- Q4 = Quarter 4 (Oct to Dec).
- The data in this chart covers Quarter 2 (Apr to June) 2008 to Quarter 2 (Apr to June) 2016.
Download this chart Figure 1: Quarterly levels of gross fixed capital formation, chained volume measure, seasonally adjusted
Image .csv .xls
Figure 2: Quarterly growth of gross fixed capital formation, chained volume measure, seasonally adjusted
Reference year: 2013, Coverage: UK
Source: Office for National Statistics
Notes:
- Q1 = Quarter 1 (Jan to Mar).
- Q2 = Quarter 2 (Apr to June).
- Q3 = Quarter 3 (July to Sept).
- Q4 = Quarter 4 (Oct to Dec).
- The data in this chart covers Quarter 2 (Apr to June) 2008 to Quarter 2 (Apr to June) 2016.
Download this chart Figure 2: Quarterly growth of gross fixed capital formation, chained volume measure, seasonally adjusted
Image .csv .xlsBusiness investment in Quarter 2 2016 was £43.8 billion (Figure 3), an increase of 1.0% (Figure 4) when compared with the previous quarter. This was mainly due to an increase in investment in transport equipment. Business investment is now 7.0% above the pre-economic downturn peak of Quarter 1 (Jan to Mar) 2008 (£40.9 billion). As illustrated in Figures 3 and 4, business investment in Quarter 2 2016 saw positive growth quarter-on-quarter following 2 consecutive periods of contraction, in Quarter 4 (Oct to Dec) 2015 and Quarter 1 2016.
Figure 3: Quarterly levels of business investment, chained volume measure, seasonally adjusted
Reference year: 2013, Coverage: UK
Source: Office for National Statistics
Notes:
- Q1 = Quarter 1 (Jan to Mar).
- Q2 = Quarter 2 (Apr to June).
- Q3 = Quarter 3 (July to Sept).
- Q4 = Quarter 4 (Oct to Dec).
- The data in this chart covers Quarter 2 (Apr to June) 2008 to Quarter 2 (Apr to June) 2016.
Download this chart Figure 3: Quarterly levels of business investment, chained volume measure, seasonally adjusted
Image .csv .xls
Figure 4: Quarterly growth of business investment, chained volume measure, seasonally adjusted
Reference year: 2013, Coverage: UK
Notes:
- Q1 = Quarter 1 (Jan to Mar).
- Q2 = Quarter 2 (Apr to June).
- Q3 = Quarter 3 (July to Sept).
- Q4 = Quarter 4 (Oct to Dec).
- The data in this chart covers Quarter 2 (Apr to June) 2008 to Quarter 2 (Apr to June) 2016.
Download this chart Figure 4: Quarterly growth of business investment, chained volume measure, seasonally adjusted
Image .csv .xls5. Summary tables
Table 1 shows that in Quarter 2 (Apr to June) 2016, gross fixed capital formation (GFCF) increased by an estimated 1.6% to £78.1 billion when compared with Quarter 1 (Jan to Mar) 2016. The largest level increase was seen in general government which rose by £0.9 billion (7.6%) to £12.3 billion; its highest level since Quarter 1 2014. The second largest level increase was in business investment which rose by £0.4 billion (1.0%) followed by private sector dwellings which rose by £0.1 billion (0.8%). These were partially offset by a decrease of £0.2 billion (negative 4.2%) in private sector cost of ownership transfer on non-produced assets.
Between Quarter 2 2015 and Quarter 2 2016, the largest level increases were seen by general government (£0.6 billion), private sector costs of ownership transfer on non-produced assets (£0.4 billion) and private sector dwellings (£0.1 billion). These were partially offset by a decrease of £0.4 billion for business investment. The decrease in business investment of 0.8% was the second consecutive quarter on same quarter a year ago fall. The last time there were consecutive falls in business investment, quarter on same quarter a year ago, was when business investment fell for 6 quarters between Quarter 4 ( Oct to Dec) 2008 and Quarter 1 2010.
Table 1: Total gross fixed capital formation in the UK by institutional sector, Quarter 2 (Apr to June) 2016
| % change | % change | £ million | £ million | £ million | |
| Most recent quarter on previous quarter | Most recent quarter on same quarter a year earlier | Most recent level ** | Level change from previous quarter | Level change on same quarter a year earlier | |
| Gross fixed capital formation | 1.6 | 1.0 | 78,108 | 1,209 | 791 |
| Business investment | 1.0 | -0.8 | 43,798 | 430 | -363 |
| General government | 7.6 | 4.8 | 12,349 | 871 | 568 |
| Public corporations dwellings | 0.6 | 9.6 | 1,101 | 7 | 96 |
| Public corporations cost of ownership transfer on non-produced assets | -3.4 | 9.1 | -168 | 6 | -14 |
| Private sector dwellings | 0.8 | 0.8 | 15,746 | 125 | 132 |
| Private sector cost of ownership transfer on non-produced assets | -4.2 | 7.6 | 5,282 | -230 | 372 |
| Source: Office for National Statistics | |||||
| Notes: | |||||
| 1. ** Series may not sum to totals due to rounding. | |||||
Download this table Table 1: Total gross fixed capital formation in the UK by institutional sector, Quarter 2 (Apr to June) 2016
.xls (28.7 kB)Table 2 shows that in asset terms, the largest level increase, quarter-on-quarter, in Quarter 2 2016 was in transport equipment, which grew by £0.7 billion (14.9%) to £5.4 billion. The second largest increase was for information and communication technology (ICT) equipment and other machinery and equipment which increased by £0.3 billion (2.1%). The third largest increase was for dwellings which rose by £0.1 billion (0.8%).
Between Quarter 2 2015 and Quarter 2 2016, transport equipment saw the largest level increase, growing by £0.8 billion (17.3%). This is the highest level of investment in transport assets since the beginning of the series in Quarter 1 1997. Dwellings was the only other asset to increase quarter on same quarter a year ago, having grown by £0.2 billion (1.4%) to £16.9 billion in Quarter 2 2016. These increases were partially offset by decreases in other buildings and structures and transfer costs which decreased by £0.1 billion (0.6%).
Table 2: Total gross fixed capital formation in the UK by asset, Quarter 2 (Apr to June) 2016
| % change | % change | £ million | £ million | £ million | |
| Most recent quarter on previous quarter | Most recent quarter on same quarter a year earlier | Most recent level ** | Level change from previous quarter | Level change on same quarter a year earlier | |
| Gross fixed capital formation | 1.6 | 1.0 | 78,108 | 1,209 | 791 |
| Transport equipment | 14.9 | 17.3 | 5,362 | 694 | 790 |
| ICT equipment and other machinery and equipment | 2.1 | -0.1 | 14,554 | 304 | -21 |
| Dwellings | 0.8 | 1.4 | 16,899 | 134 | 232 |
| Other buildings and structures and transfer costs | 0.5 | -0.6 | 24,398 | 112 | -149 |
| Intellectual property products | -0.2 | -0.4 | 16,895 | -35 | -61 |
| Source: Office for National Statistics | |||||
| Notes: | |||||
| 1. ** Series may not sum to totals due to rounding. | |||||
Download this table Table 2: Total gross fixed capital formation in the UK by asset, Quarter 2 (Apr to June) 2016
.xls (28.2 kB)6. Revisions to gross fixed capital formation (GFCF) and business investment
Data in this release have been revised from Quarter 1 (Jan to Mar) 2015 to Quarter 2 (Apr to June) 2016 in line with the National Accounts Revisions Policy.
The main causes of revisions in the data are:
later responses to the Quarterly Acquisitions and Disposals of Capital Assets Survey (QCAS) for Quarter 1 2016 and Quarter 2 2016
revised data for government estimates of investment (all quarters) which are expected at this point in the reporting cycle
normal changes to the seasonally adjusted series following the addition of an extra data point
Figure 5 shows quarterly growth of GFCF at the provisional compared with the revised estimates.
Figure 5: Quarterly gross fixed capital formation growth of GFCF compared with previously published GFCF growth, chained volume measure, seasonally adjusted
Reference year: 2013 Coverage: UK
Source: Office for National Statistics
Notes:
- Q1 = Quarter 1 (Jan to Mar).
- Q2 = Quarter 2 (Apr to June).
- Q3 = Quarter 3 (July to Sept).
- Q4 = Quarter 4 (Oct to Dec).
- The data in this chart covers Quarter 1 (Jan to Mar) 2015 to Quarter 2 (Apr to June) 2016.
Download this chart Figure 5: Quarterly gross fixed capital formation growth of GFCF compared with previously published GFCF growth, chained volume measure, seasonally adjusted
Image .csv .xlsFigure 6 shows quarterly growth of business investment compared with the previously published estimate. Business investment for Quarter 1 2016 was revised down mainly due to later QCAS survey data. The lower level of business investment in Quarter 1 2016 is the main reason for the upwards revision to growth in Quarter 2 2016. The revisions in 2015 are mainly due to changes in the seasonal profile of the data.
Figure 6: Quarterly growth of business investment compared with previously published business investment growth, chained volume measure, seasonally adjusted
Reference year: 2013, Coverage: UK
Source: Office for National Staistics
Notes:
- Q1 = Quarter 1 (Jan to Mar).
- Q2 = Quarter 2 (Apr to June).
- Q3 = Quarter 3 (July to Sept).
- Q4 = Quarter 4 (Oct to Dec).
- The data in this chart covers Quarter 1 (Jan to Mar) 2015 to Quarter 2 (Apr to June) 2016.
Download this chart Figure 6: Quarterly growth of business investment compared with previously published business investment growth, chained volume measure, seasonally adjusted
Image .csv .xls7. Economic background
Gross fixed capital formation (GFCF) grew by 1.0% in the year to Quarter 2 (Apr to June) 2016 following a 0.3% increase in Quarter 1 (Jan to Mar) 2016, marking 13 consecutive periods of quarter on same quarter a year ago growth. However, the rate of growth in GFCF has slowed consistently since 2014. Quarter on same quarter a year ago growth averaged 6.8% in 2014; falling to 3.4% in 2015 and 0.7% in 2016.
The increase in GFCF quarter on same quarter a year ago was mainly driven by investment by the general government sector, which contributed 0.7 percentage points to overall GFCF growth. In contrast, business investment made an offsetting negative contribution to GFCF growth over the same period (negative 0.5 percentage points). An important factor to consider when looking at business investment is the availability or supply of lending. In the most recent Bank of England’s Credit Conditions Review the supply of lending to companies was reported to be unchanged in Quarter 2 2016. Over the same period, credit demand fell for large firms but increased for small and medium sized enterprises.
Developments in the housing market can also be important for investment and wider activity. Investment in residential dwellings (the new construction and repair of homes) grew by 0.8% in Quarter 2 2016 on a quarter-on-quarter basis and by 1.4% on the same quarter a year ago basis. This follows recent trends in the construction industry; for example, new build housing from the private sector increased by 8.4% on a same quarter a year ago basis (Construction output in Great Britain: July 2016 and New Orders Quarter 2 (Apr to June) 2016). Over the same period, house prices as measured by the Office for National Statistics also rose by 8.5%.
On an asset basis, the quarter on same quarter a year ago increase in GFCF was mainly driven by transport equipment, which contributed 1.0 percentage point to the growth, while other buildings and structures made the largest negative contribution to GFCF (negative 0.2 percentage points).
Back to table of contents8. Where to find more of our data
We also publish additional analyses of GFCF, business investment and the Quarterly Acquisitions and Disposals of Capital Assets Survey, which have been created in response to user requests. For enquiries about user-requested data email gcf@ons.gov.uk.
Back to table of contents9. Adjustments and response rates
Adjustments
Large capital expenditure tends to be reported later in the data collection period than smaller capital expenditure. This means that larger expenditures are often included in the revised (month 3) results, but are not reported in time for the provisional (month 2) results, leading to a tendency towards upwards revisions in the later estimates for business investment and gross fixed capital formation (GFCF). Following investigation of the impact of this effect, from Quarter 3 (July to Sept) 2013, in the revised estimate a bias adjustment was introduced to GFCF and its components.
A bias adjustment of £0.5 billion has been included in the revised (month 3) release for Quarter 2 (Apr to June) 2016. This has been revised down from £1.0 billion since the Quarter 2 2016 provisional estimate. This adjustment will be reassessed in line with previous revisions and will be updated when Quarter 2 2016 is next revised in the Quarter 3 (July to Sept) 2016 revised release.
To try and improve the quality of the response from our respondents, clearer instructions were added to the Quarterly Survey of Capital Expenditure. These updates are outlined in the provisional Quarter 1 2015 business investment release. Feedback from some respondents indicated that they had been misreporting their asset breakdown and were correcting this on the new questionnaire. We found that some respondents were reporting new construction work (NCW) as other capital equipment (OCE). From Quarter 1 2015, respondents to the survey are now reporting more in NCW at the expense of OCE. To remain consistent with the previous data, we have made some adjustments to the assets in the current price series in Quarter 1 2015, Quarter 2 2015, Quarter 3 2015, Quarter 4 (Oct to Dec) 2015, Quarter 1 2016 and Quarter 2 2016. These adjustments are shown in Table 3.
Table 3: Adjustments made to buildings and other machinery to account for improved survey information, UK, Quarter 1 (Jan to Mar) 2015 to Quarter 2 (Apr to June) 2016
| Period | Adjustment to buildings (£ billion) | Adjustment to machinery (£ billion) |
| Q1 2015 | -1.5 | 1.5 |
| Q2 2015 | -2.1 | 2.1 |
| Q3 2015 | -1.9 | 1.9 |
| Q4 2015 | -1.9 | 1.9 |
| Q1 2016 | -1.9 | 1.9 |
| Q2 2016 | -1.9 | 1.9 |
| Source: Office for National Statistics | ||
| Notes: | ||
| 1. Q1 is Quarter 1 (Jan to Mar) | ||
| 2. Q2 is Quarter 2 (Apr to June) | ||
| 3. Q3 is Quarter 3 (July to Sept) | ||
| 4. Q4 is Quarter 4 (Oct to Dec) | ||
Download this table Table 3: Adjustments made to buildings and other machinery to account for improved survey information, UK, Quarter 1 (Jan to Mar) 2015 to Quarter 2 (Apr to June) 2016
.xls (27.6 kB)Survey response rates
Table 4 presents the provisional (month 2) and revised (month 3) response rates for the Quarterly Acquisitions and Disposals of Capital Assets Survey (QCAS). The estimates in this release are based on the Quarter 2 2016 month 3 (revised) survey results.
Table 4: UK response rates for quarterly acquisitions and disposals of capital assets survey, Quarter 2 (Apr to June) 2015 to Quarter 2 (Apr to June) 2016
| At month 2 (provisional) | At month 3 (revised) | ||||||
| Period | Survey response rates / % | Period | Survey response rates / % | ||||
| 2015 | Q2 | 70.8 | 2015 | Q2 | 88.5 | ||
| Q3 | 72.1 | Q3 | 88.4 | ||||
| Q4 | 68.6 | Q4 | 89.8 | ||||
| 2016 | Q1 | 69.2 | 2016 | Q1 | 89.4 | ||
| Q2 | 71.4 | Q2 | 85.6 | ||||
| Source: Office for National Statistics | |||||||
| Notes: | |||||||
| 1. Q1 is Quarter 1 (Jan to Mar) | |||||||
| 2. Q2 is Quarter 2 (Apr to June) | |||||||
| 3. Q3 is Quarter 3 (July to Sept) | |||||||
| 4. Q4 is Quarter 4 (Oct to Dec) | |||||||
Download this table Table 4: UK response rates for quarterly acquisitions and disposals of capital assets survey, Quarter 2 (Apr to June) 2015 to Quarter 2 (Apr to June) 2016
.xls (25.6 kB)10. Quality and methodology
The Business investment Quality and Methodology Information document contains important information on:
the strengths and limitations of the data
the quality of the output, including the accuracy of the data and how it compares with related data
uses and users
how the output was created