Table of contents
- Main points
- Summary
- Understanding this release
- Summary of latest public sector net borrowing position
- Summary of latest public sector net debt position
- Net borrowing and debt statistics compared with OBR forecast
- International comparisons of borrowing and debt
- Public sector net cash requirement
- Central government receipts and expenditure
- Recent events and methodological changes
- Revisions since previous bulletin
- New for the bulletin
- Background notes
- Methodology
1. Main points
Public sector net borrowing excluding public sector banks decreased by £14.0 billion to £70.7 billion in the current financial year-to-date (April 2015 to February 2016) compared with the same period in the previous financial year.
Public sector net borrowing excluding public sector banks decreased by £0.5 billion to £7.1 billion in February 2016 compared with February 2015.
Public sector net debt excluding public sector banks at the end of February 2016 was £1,577.1 billion, equivalent to 83.1% of Gross Domestic Product; an increase of £46.3 billion compared with February 2015.
Central government net cash requirement decreased by £23.5 billion to £40.6 billion in the current financial year-to-date (April 2015 to February 2016) compared with the same period in the previous financial year.
Due to the volatility of the monthly data, the cumulative financial year-to-date borrowing figures provide a better indication of the progress of the public finances than the individual months.
Back to table of contents2. Summary
This section provides a summary of the key messages of this statistical bulletin which some users may find helpful. Some users may also like to receive Twitter updates by following @frasermunropsf. We recently published an article titled The debt and deficit of the UK public sector explained which some users may also find useful.
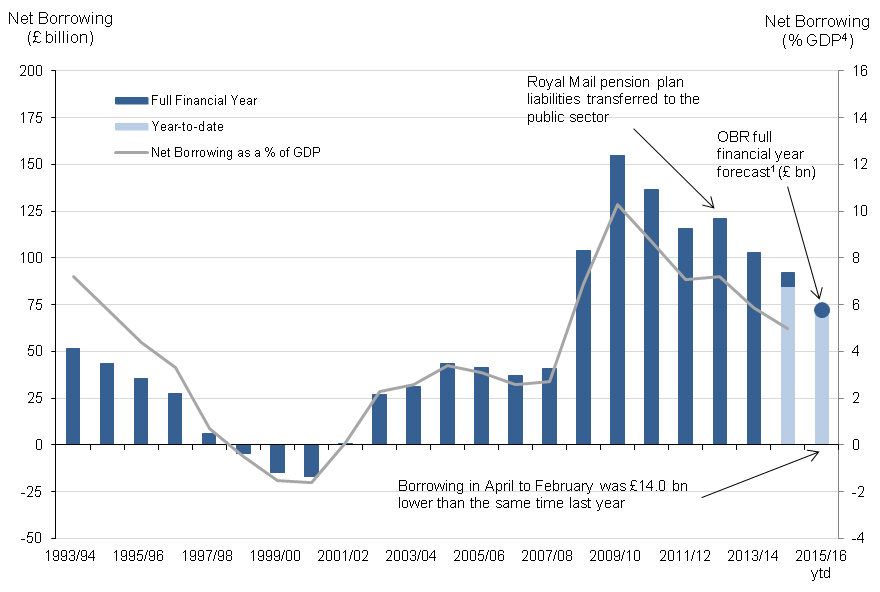
The amount borrowed by the public sector has been falling since the peak in the financial year ending March 2010
UK public sector borrowing, April 1993 to February 2016

Source: Office for National Statistics
Notes:
- OBR full financial year forecast for PSNB ex from March 2016 Economic & Fiscal Outlook (EFO).
- ytd = year-to-date (April to February).
- Financial year 1993/94 represents financial year ending 1994 (April 1993 to March 1994).
- GDP = Gross Domestic Product.
Download this image The amount borrowed by the public sector has been falling since the peak in the financial year ending March 2010
.png (27.9 kB) .xls (56.8 kB)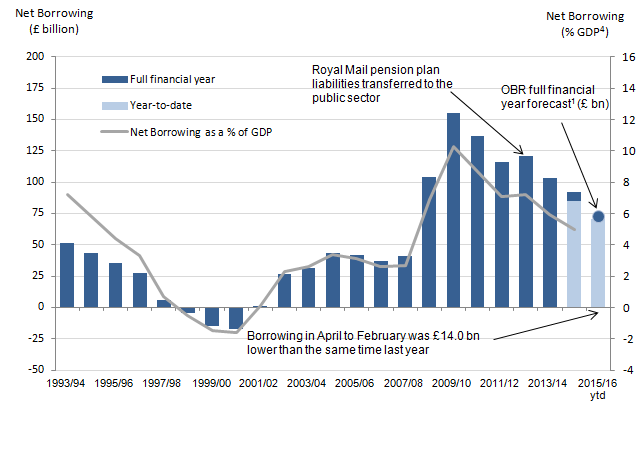
Public sector borrowing (or deficit)
In February 2016, the public sector spent more money than it received in taxes and other income. This meant it had to borrow £7.1 billion to balance the books. Of this £7.1 billion, £2.6 billion were spent on the cost of the “day-to-day” activities of the public sector (the current budget deficit), while it spent £4.5 billion on infrastructure (net investment).
Annual borrowing has generally been falling since the peak in the financial year ending March 2010. So far this financial year (April 2015 to February 2016), the public sector has borrowed £70.7 billion. This was £14.0 billion lower than at the same point in the previous financial year.
The Office for Budget Responsibility, who produces economic and fiscal forecasts for government, expects that the public sector will borrow £72.2 billion during the financial year ending March 2016.
Income and spending by central government
Central government’s income and spending make the largest contribution to the amount borrowed by the public sector. Central government received £53.6 billion in income in February 2016. This was around 5% higher than in the same month last year, largely due to receiving more income tax and taxes on production such as VAT and stamp duty, compared with the previous year.
Central government spent £57.1 billion, in February 2016, around a 1% decrease compared with the previous year. Of this amount, just below two-thirds was spent by central government departments (such as health, education and defence), around a third on social benefits (such as pensions, unemployment payments, child benefit and maternity pay) with the remaining being spent on capital investment and interest on the government’s outstanding debt.
Debt
While deficit represents the difference between income and spending at a point in time, debt represents the total amount of money owed over time. Debt has been built up by successive government administrations over many years. When the government borrows, this adds to the debt total. So reducing the deficit is not the same as reducing the debt.
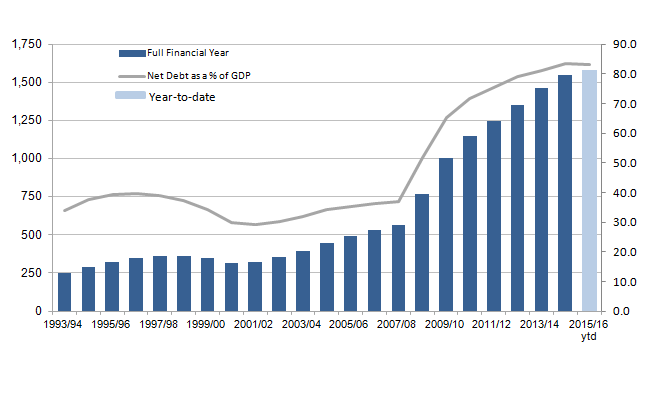
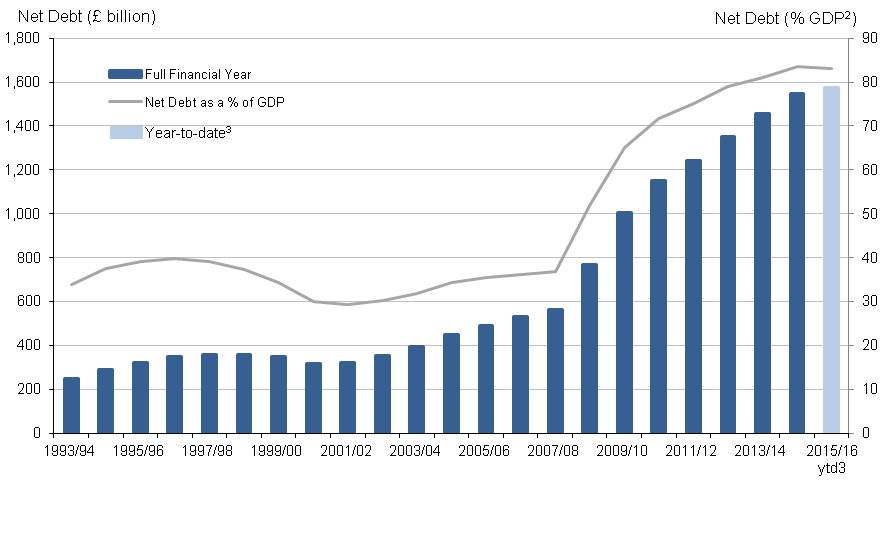
The amount of money owed by the government to the private sector stood at £1.6 trillion at the end of February 2016, which equates to 83.1% of value of all the goods and services currently produced by the UK economy in a year (or gross domestic product - GDP).
Public sector debt increased rapidly following the banking crisis in the financial year ending March 2008
UK public sector debt, March 1994 to end of February 2016
Source: Office for National Statistics
Notes:
- GDP = Gross Domestic Product.
- Financial year 1993/94 represents financial year ending 1994 (April 1993 to March 1994).
- ytd = year-to-date (April to February).
Download this image Public sector debt increased rapidly following the banking crisis in the financial year ending March 2008
.png (21.7 kB) .xls (44.0 kB)
Self-assessed income tax receipts
Self-assessed income tax receipts increased by £0.3 billion to £3.1 billion in February 2016 compared with February 2015.
The proportion of self-assessed income tax recorded in January and February can vary year-on-year and it is therefore advisable to consider data for the 2 months (January and February) together.
The total self-assessed income tax receipts in January and February 2016 (together), increased by £0.4 billion to £15.5 billion compared with the same period in 2015.
EU government deficit and debt
On 15 January 2016, we published the latest EU Government Deficit and Debt Return which reported that:
general government net borrowing (Maastricht Borrowing) in the financial year ending 2015 (April 2014 to March 2015) was £91.9 billion, equivalent to 5.0% of GDP
general government gross debt (Maastricht Debt) at the end of March 2015 was £1,601.3 billion, equivalent to 87.5% of GDP
This publication reports a slightly revised Maastricht Borrowing, in the financial year ending 2015, to £91.1 billion and an unchanged Maastricht Debt at the end of March 2015 of £1,601.3 billion.
Please refer to section 5, International comparisons of borrowing and debt for further detail.
Requests for user feedback
Country and Regional (sub-UK) Public Sector Finances
We would like to gather your suggestions for a Country and Regional Public Sector Finances publication.
In the current climate of devolution there is growing demand for sub-national statistics and in an effort to understand these demands, we have begun looking into the feasibility of producing such statistics at a NUTS1 level, comprising Wales, Scotland, Northern Ireland and the 9 statistical territories of England.
We would welcome responses to a short set of (7) questions by 11 April 2016.
We will publish a summary of the comments made approximately 12 weeks after the close of the consultation period.
The use of GDP in public sector fiscal ratio statistics
Our public consultation on the use of Gross Domestic Product (GDP) in our presentation of public sector finances closed on 18 March 2016. We will publish a summary of the information gathered as a part of this exercise approximately 12 weeks after the close of the consultation period and implement any recommendations thereafter.
More information on the calculation of GDP ratios can be found in The Use of GDP in Public Sector Fiscal Ratio Statistics.
Back to table of contents3. Understanding this release
This statistical bulletin provides important information on the UK government financial position. It enables government, the public, economists and financial analysts to monitor public sector expenditure, receipts, investments, borrowing and debt. By comparing these data with forecasts from The Office for Budget Responsibility (OBR) the current UK fiscal position can be evaluated.
We recently published an article titled The debt and deficit of the UK public sector explained which some users may also find useful.
The following tables and diagram are intended to provide users with the important terms needed to understand these data and how the statistics relate to each other.
Table 1: the main terms needed to understand the data
| Term | Description |
| Accruals/accrued recording | – financial recording based on when ownership transfers or the service is provided (sometimes different to when cash is paid). |
| Asset Purchase Facility Fund (APF) | – an arm of The Bank of England able to purchase financial assets including government securities (gilts). The APF has earnt interest which is periodically transferred back to central government. |
| Cash recording | – financial recording based on when cash is paid or received. Net cash requirement is recorded on a cash basis and net debt is close to being a cash measure. |
| Current budget deficit | – the gap between current expenditure and current receipts (having taken account of depreciation). |
| Current expenditure | – spending on government activities including: social benefits, interest payments, and other government department spending (excluding spending on capital assets). |
| Current receipts | – income mainly from taxes (e.g. VAT, income and corporation taxes) but also includes interest, dividend and rent income. |
| ESA 1995 | – European System of Accounts 1995 was the European legal requirement for the production of National Accounts prior to September 2014. |
| ESA 2010 | – European System of Accounts 2010 is the European legal requirement for the production of National Accounts from September 2014. |
| Maastricht deficit | – general government net borrowing as defined within the Maastricht Treaty and Stability and Growth Pact (and as supplied to Eurostat) |
| Maastricht debt | – general government gross debt as defined within the Maastricht Treaty and Stability and Growth Pact (and as supplied to Eurostat). |
| Net borrowing | – measures the gap between revenue raised (current receipts) and total spending (current expenditure plus net investment). A positive value indicates borrowing while a negative value indicates a surplus. |
| Net cash requirement | – is a measure of how much cash the government needs to borrow (or lend) to balance its accounts (see cash recording). |
| Net debt | – is a measure of how much the government owes at a point in time. |
| Net investment | – spending on capital assets, e.g. infrastructure projects, property and I.T equipment, both as grants and by public sector bodies themselves minus capital receipts (sale of capital assets). |
| Table Source: Office for National Statistics | |
Download this table Table 1: the main terms needed to understand the data
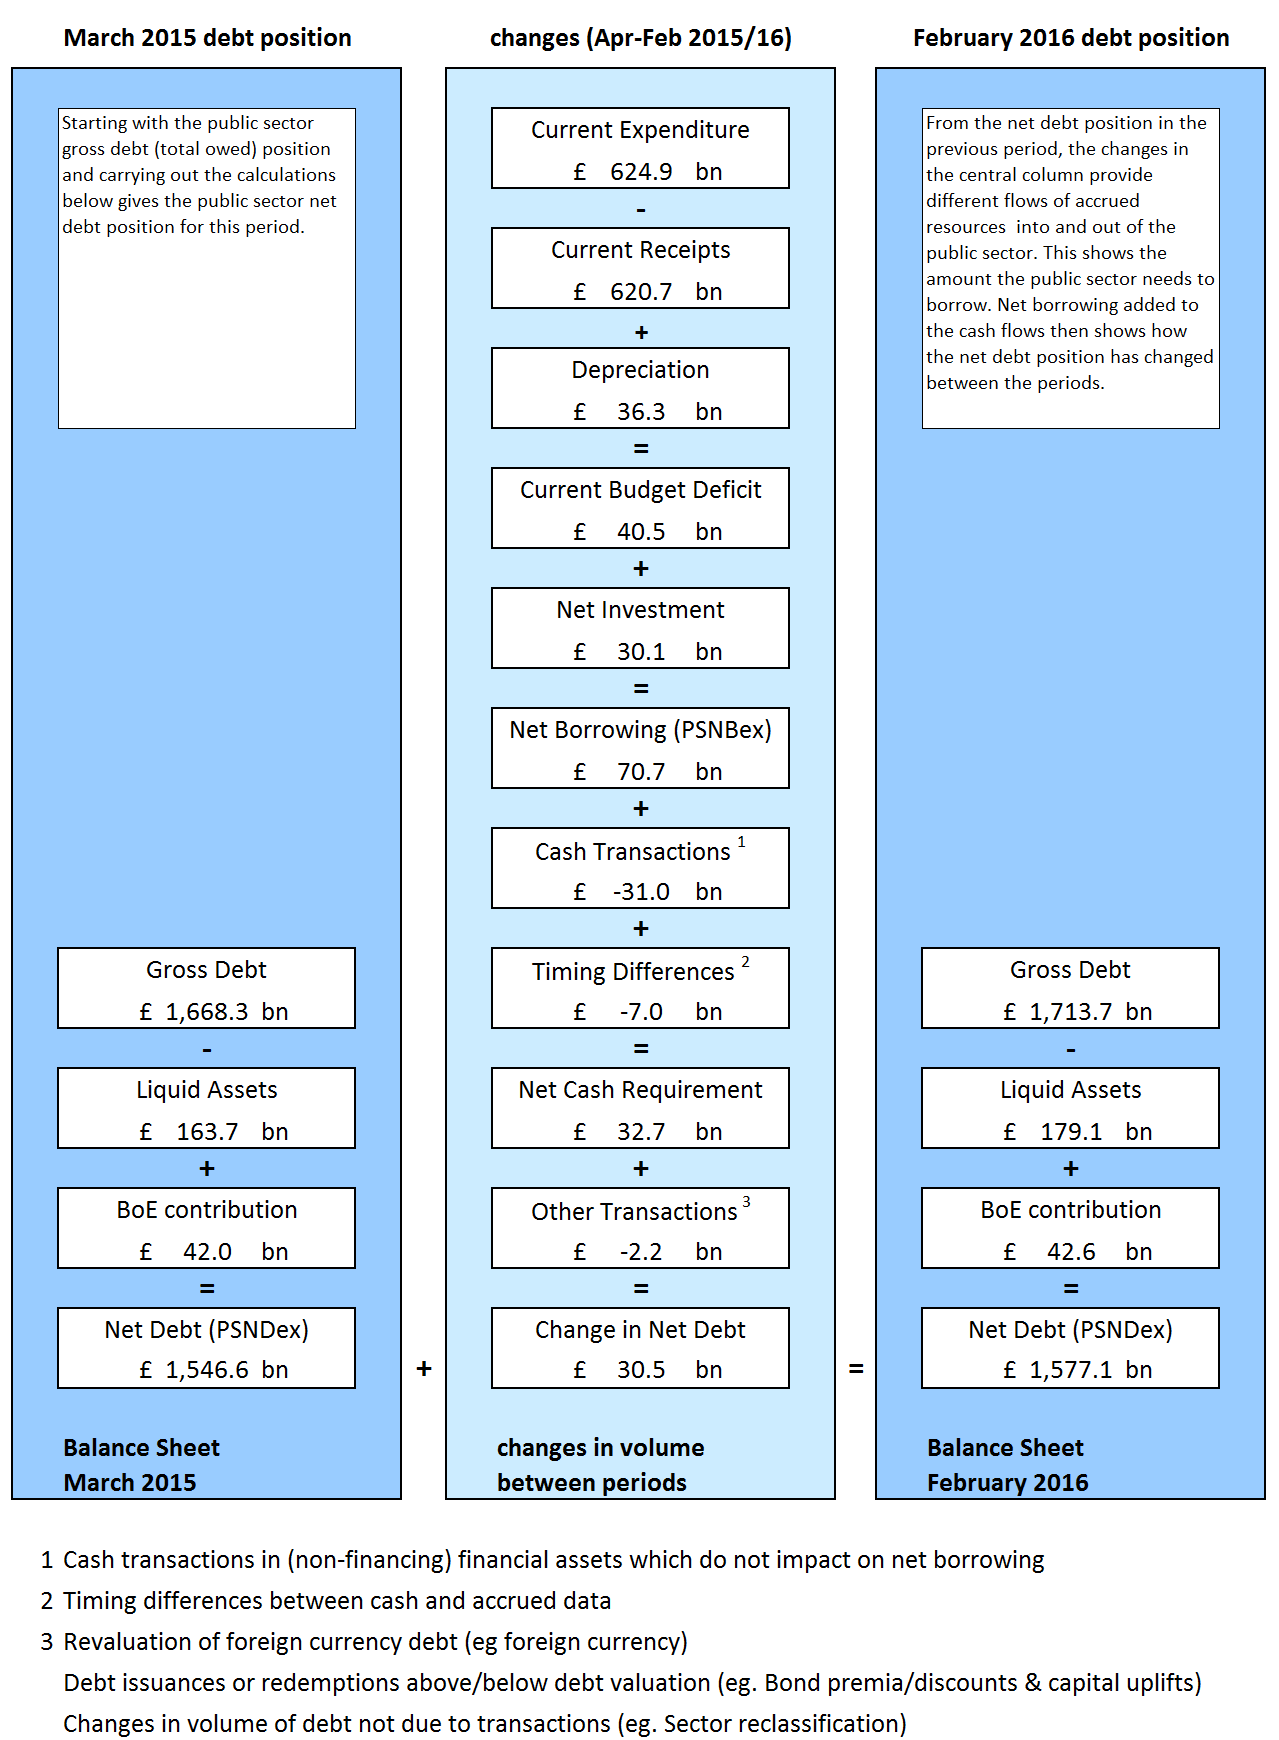
.xls (30.2 kB)Figure 1 illustrates how debt between periods changes as a result of transaction flows (for example expenditure and receipts) on an accrued and cash basis. The transaction flows are provided for the current financial year-to-date (April 2015 to February 2016).
The headline measures of current budget deficit, net borrowing, net cash requirement and net debt are highlighted in the diagram as they provide the important indicators for the performance of the UK public finances.
When expenditure is greater than income, the public sector runs a deficit, known as the current budget deficit. Net borrowing is made up of the current budget deficit plus net investment (spending on capital less capital receipts). The diagram shows how net borrowing contributes to the change in net debt.
The net cash requirement is closely related to net debt (the amount owed). It is important because it represents the cash needed to be raised from the financial markets to service the government’s borrowing deficit. Changes in net debt between 2 points in time are normally similar to the net cash requirement for the intervening period, though the relationship is not an exact one.
Figure 1: Changes in Public Sector Finances (excluding public sector banks) financial year-to-date ending March 2016 (£ billion)
Source: Office for National Statistics
Download this image Figure 1: Changes in Public Sector Finances (excluding public sector banks) financial year-to-date ending March 2016 (£ billion)
.png (139.0 kB) .xls (39.9 kB)
This release presents the first estimate of February 2016 public sector finances and updates previous financial years’ data.
Table 2 summarises the latest headline public sector finances measures, comparing the latest month and cumulative totals for the financial year-to-date for each with the equivalent period in the previous year. Time series for each component are available in Table PSA1.
Table 2: Headline Public Sector Finances data, by month and financial year to date
| UK, excluding public sector banks | £ billion1 | ||||||
| February | Financial year-to-date7 | ||||||
| 2016 | 2015 | Change | 2015/168 | 2014/158 | Change | ||
| Current Budget Deficit2 | 2.6 | 3.4 | -0.8 | 40.5 | 56.3 | -15.7 | |
| Net Investment 3 | 4.5 | 4.1 | 0.3 | 30.1 | 28.4 | 1.7 | |
| Net Borrowing 4 | 7.1 | 7.5 | -0.5 | 70.7 | 84.7 | -14.0 | |
| Net Debt 5 | 1,577.1 | 1,530.8 | 46.3 | 1,577.1 | 1,530.8 | 46.3 | |
| Net Debt as a % of annual GDP6 | 83.1 | 82.9 | 0.2 | 83.1 | 82.9 | 0.2 | |
| Source: Office for National Statistics | |||||||
| Notes: | |||||||
| 1. Unless otherwise stated. | |||||||
| 2. Current Budget Deficit is the difference between current expenditure (including depreciation) and current receipts. | |||||||
| 3. Net Investment is gross investment (net capital formation plus net capital transfers) less depreciation. | |||||||
| 4. Net Borrowing is Current Budget Deficit plus Net Investment. | |||||||
| 5. Net Debt is financial liabilities (for loans, deposits, currency and debt securities) less liquid assets. | |||||||
| 6. GDP = Gross Domestic Product (at current market price). | |||||||
| 7. Financial year-to-date refers to the period from April to February. | |||||||
| 8. 2015/16 refers to financial year ending in March 2016 and 2014/15 refers to financial year ending in March 2015. | |||||||
Download this table Table 2: Headline Public Sector Finances data, by month and financial year to date
.xls (33.8 kB)4. Summary of latest public sector net borrowing position
In the UK, the public sector consists of 5 sub-sectors: central government, local government, public non-financial corporations, Bank of England and public financial corporations (that is, public sector banks).
Table 3 summarises the current monthly and year-to-date borrowing position of each of these sub-sectors along with the public sector aggregates. Full time series for these data can be found in Table PSA2.
Table 3: Sub-sector Breakdown of Public Sector Net Borrowing
| £ billion (not seasonally adjusted) | |||||||
| February | Financial year-to-date2 | ||||||
| 2016 | 2015 | Change | 2015/16 | 2014/15 | Change | ||
| General Government | 7.9 | 8.4 | -0.5 | 70.1 | 82.9 | -12.8 | |
| of which | |||||||
| Central Government | 5.1 | 8.1 | -3.0 | 65.5 | 81.5 | -16.0 | |
| Local Government | 2.8 | 0.3 | 2.5 | 4.5 | 1.4 | 3.2 | |
| Public Non-Financial Corporations | 0.1 | 0.2 | -0.1 | 2.8 | 2.5 | 0.4 | |
| Bank of England | -0.9 | -1.0 | 0.1 | -2.2 | -0.7 | -1.5 | |
| Public Sector ex (PSNB ex) | 7.1 | 7.5 | -0.5 | 70.7 | 84.7 | -14.0 | |
| Public Financial Corporations | -0.6 | -0.6 | 0.0 | -6.6 | -7.8 | 1.2 | |
| Public Sector (PSNB) | 6.5 | 6.9 | -0.5 | 64.0 | 76.8 | -12.8 | |
| Table source: Office for National Statistics | |||||||
| Table notes: | |||||||
| 1. 2015/16 refers to financial year ending in March 2016 and 2014/15 refers to financial year ending in March 2015. | |||||||
| 2. Financial year-to-date refers to the period from April to February. | |||||||
Download this table Table 3: Sub-sector Breakdown of Public Sector Net Borrowing
.xls (32.8 kB)While public sector finance data are available on a monthly basis, due to the volatility of the monthly time series, it is often more informative to look at the financial year-to-date or complete financial year data in order to discern underlying patterns. Estimates are revised over time as additional data becomes available.
Figure 2 illustrates public sector net borrowing excluding public sector banks (PSNB ex) for the last 22 financial years. For all but 3 years in the period the public sector has been in deficit and had to borrow to fund the gap between expenditure and revenue.
Figure 2: Public sector net borrowing excluding public sector banks; the financial year ending 1994 to date
UK, all data excluding public sector banks
Source: Office for National Statistics
Notes:
- OBR full financial year forecast for PSNB ex from 16 March 2016 Economic & Fiscal Outlook (EFO).
- Financial year 1993/94 represents financial year ending 1994 (April 1993 to March 1994).
- Ytd = year-to-date (April to February).
- GDP = Gross Domestic Product.
Download this image Figure 2: Public sector net borrowing excluding public sector banks; the financial year ending 1994 to date
.png (40.2 kB) .xls (175.1 kB)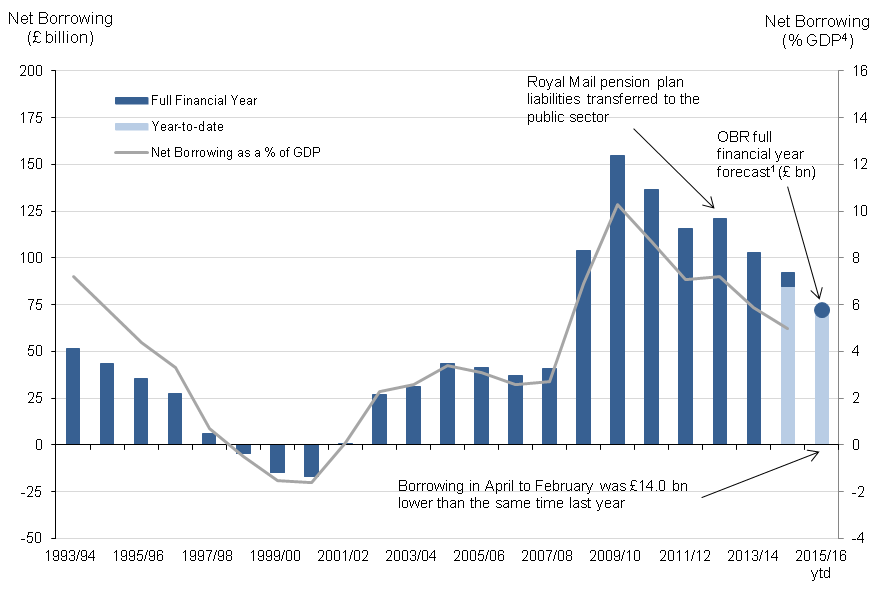
PSNB ex peaked in the financial year ending 2010 (April 2009 to March 2010) as the effects of the economic downturn impacted on the public finances (reducing tax receipts while expenditure continued to increase). PSNB ex has reduced since then, although remained higher than before the financial year ending 2008 (April 2007 to March 2008) and the 2007 global financial market shock.
PSNB ex in the financial year ending 2013 (April 2012 to March 2013) was higher than in the previous financial year largely as a result of the recording of an £8.9 billion payable capital transfer in April 2012, as recognition that the liabilities transferred from the Royal Mail Pension Plan exceeded the assets transferred.
Net borrowing for the financial year-to-date (April 2015 to February 2016)
Due to the volatility of the monthly data, the cumulative financial year-to-date borrowing figures provide a better indication of the progress of the public finances than the individual months.
In the financial year-to-date (April 2015 to February 2016), public sector net borrowing excluding banking groups (PSNB ex) was £70.7 billion; a decrease of £14.0 billion, or 16.5% compared with the same period in the previous financial year.
This decrease in net borrowing was predominantly due to a decrease of £16.0 billion in central government net borrowing, partially offset by increases in both local government and public corporations’ net borrowing of £3.2 billion and £0.4 billion respectively.
Over the same period, Bank of England (BoE) net borrowing was £1.5 billion lower than in the same period in the previous financial year, almost entirely due to Asset Purchase Facility (APF) transfers to central government. The combined net borrowing of central government and the BoE in the financial year-to-date (April 2015 to February 2016) was £17.5 billion lower than in the same period in the previous financial year.
Central government receipts for the financial year-to-date (April 2015 to February 2016) were £580.5 billion, an increase of £19.0 billion, or 3.4%, compared with the same period in the previous financial year. Of which:
- income tax-related payments increased by £6.9 billion, or 4.5%, to £160.7 billion
- VAT receipts increased by £4.7 billion, or 4.1%, to £119.3 billion
- social (national insurance) contributions increased by £4.0 billion, or 4.1%, to £102.7 billion
- corporation tax increased by £1.4 billion, or 3.5%, to £42.4 billion
- interest & dividends decreased by £1.7 billion, or 9.5%, to £16.1 billion
Central government expenditure (current and capital) for the financial year-to-date (April 2015 to February 2016) was £629.1 billion, an increase of £2.6 billion, or 0.4%, compared with the same period in the previous financial year. Of which:
- net social benefits (mainly pension payments) increased by £1.8 billion, or 1.0%, to £186.9 billion; largely as a result of increases in state pension payments (within National Insurance Fund benefits) and public sector pension payments, being partially offset by a fall in public sector pension contributions
- central government net investment (capital expenditure) increased by £0.5 billion, or 1.7%, to £29.6 billion; largely as a result of an increase in gross capital formation and transfers from central government to other sectors, partially offset by transfers to central government from other sectors
- other current expenditure (mainly departmental spending) increased by £0.2 billion, or 0.1%, to £368.3 billion; largely as a result of increases in departmental spending on goods & services and subsidies, being offset by decreases in transfers to local government
- debt interest was £44.4 billion, equivalent to that in the previous financial year-to-date; of this £44.4 billion, £12.4 billion is the interest payable to the Bank of England Asset Purchase Facility on its gilt holdings (see Table PSA9) which are PSNB ex neutral
Local government net borrowing (LGNB) for the financial year-to-date (April 2015 to February 2016) was estimated to be £4.5 billion, an increase of £3.2 billion on the same period in the previous financial year. This increase was mainly due to decreases in grants received from central government, particularly in April, being partially offset by decreases in expenditure on goods & services.
Local government data for the current financial year-to-date are provisional estimates mainly based on budget figures received from the Department for Communities and Local Government (DCLG) and the devolved administrations, while estimates for the previous financial year-to-date are largely based on final outturn figures.
Public corporations’ net borrowing (PCNB) for the financial year-to-date (April 2015 to February 2016) was estimated to be £2.8 billion, an increase of £0.4 billion on the same period in the previous financial year.
Public corporation data for the current financial year-to-date are mainly provisional estimates.
Net borrowing in February 2016
In February 2016, public sector net borrowing excluding public sector banks (PSNB ex) was £7.1 billion; a decrease of £0.5 billion, or 6.0% compared with February 2015. This decrease in borrowing was largely due to a decrease in central government borrowing of £3.0 billion partially offset by a £2.5 billion increase in local government net borrowing.
Central government receipts in February 2016 were £53.6 billion, an increase of £2.8 billion, or 5.4% compared with February 2015. Of this:
- income tax-related payments increased by £1.1 billion, or 6.5%, to £17.6 billion
- VAT receipts increased by £0.3 billion, or 3.2%, to £10.6 billion
- social (national insurance) contributions increased by £0.2 billion, or 2.2%, to £10.2 billion
- corporation tax increased by £0.2 billion, or 11.5%, to £1.9 billion
Central government expenditure (current and capital) in February 2016 was £57.1 billion, a decrease of £0.3 billion, or 0.5%, compared with February 2015. Of this:
- debt interest increased by £0.7 billion, or 17.9%, to £4.5 billion; of this £4.5 billion, £1.0 billion is the interest paid to the Asset Purchase Facility Fund (APF) on its gilt holdings (see Table PSA9) which are PSNB ex neutral
- net social benefits (mainly pension payments) increased by £0.6 billion, or 4.1%, to £15.9 billion; largely as a result of increases in state pension payments (within National Insurance Fund benefits) and social assistance payments.
- central government net investment (capital expenditure) increased by £0.5 billion, or 18.0%, to £3.6 billion; largely as a result of increases in gross capital formation and capital transfers from central government to other sectors
- other current expenditure (mainly departmental spending) decreased by £2.2 billion, or 6.1%, to £33.1 billion; largely as a result of a decrease in current grants from central government
Detailed time series for each of the expenditure and revenue component series of central government net borrowing are presented in Tables PSA6B to 6F attached to this bulletin.
In February 2016, local government net borrowing (LGNB) was estimated at £2.8 billion; an increase of £2.5 billion compared with February 2015, mainly due to a decrease in current grants from central government.
Local government data for February 2016 are provisional estimates mainly based on budget figures received from the Department for Communities and Local Government (DCLG) and the devolved administrations, while estimates for February 2015 are largely based on final outturn figures.
Detailed time series for each of the expenditure and revenue component series of local government net borrowing are presented in Tables PSA6G to 6K attached to this bulletin.
In February 2016, public corporations’ net borrowing (PCNB) was estimated to be £0.1 billion, a decrease of £0.1 billion compared with February 2015.
Public corporation data for February 2016 are mainly provisional estimates.
Back to table of contents5. Summary of latest public sector net debt position
Public sector net debt ex (PSND ex) represents the amount of money the public sector owes to UK private sector organisations and overseas institutions, largely as a result of government financial liabilities on the bonds (gilts) and Treasury bills it has issued.
While deficit represents the difference between income and spending over a period of time, debt represents the total amount of money owed at a point in time. This debt has been built up by successive government administrations over many years. When the government borrows (that is, runs a deficit), this adds to the debt total. So reducing the deficit is not the same as reducing the debt.
At the end of February 2016, PSND ex stood at £1,577.1 billion; an increase of £46.3 billion compared with February 2015. This increase in net debt is a result of:
- £78.6 billion of public sector net borrowing
- less £0.7 billion in timing differences between cash flows for gilt interest payments and the accrued gilt interest flows
- less £46.3 billion in net cash transactions related to acquisition or disposal of financial assets of equivalent value (for example loans) and timing of recording
In recent months PSND ex has begun to fall with a drop in PSND ex of £28.4 billion between the end of December 2015 and the end of February 2016. Some of this drop is as a result of the depreciation of the pound increasing the sterling value of the UK’s foreign currency reserves. This revaluation effect accounts for around £7 billion of the decrease in debt in this period.
Figure 3 illustrates public sector net debt excluding banking groups (PSND ex) from the financial year ending March 1994 to date. PSND ex represents the amount of money the public sector owes to UK private sector organisations and overseas institutions, largely as a result of government liabilities on the bonds (gilts) and Treasury bills it has issued.
Figure 3: Public sector net debt excluding public sector banks; the financial year ending 1994 to date
UK, all data excluding public sector banks
Source: Office for National Statistics
Notes:
- Financial year ending 1994 (April 1993 to March 1994) to the financial year ending 2015 (April 2014 to March 2015).
- GDP = Gross Domestic Product.
- ytd = year-to-date (April to February).
Download this image Figure 3: Public sector net debt excluding public sector banks; the financial year ending 1994 to date
.png (29.9 kB) .xls (162.8 kB)
The increases in debt between the financial year ending 2009 (April 2008 to March 2009) and the financial year ending 2011 (April 2010 to March 2011) were larger than in the early part of the decade, as the economic downturn meant public sector net borrowing excluding public sector banks (PSNB ex) increased. Since then it has continued to increase but at a slower rate.
For the purposes of UK fiscal policy, net debt is defined as total gross financial liabilities less liquid financial assets, where liquid assets are cash and short-term assets which can be released for cash at short notice and without significant loss. These liquid assets mainly comprise foreign exchange reserves and bank deposits.
Figure 4 presents public sector debt excluding public sector banks at the end of February 2016 by sub-sector. Time series for each of these component series are presented in Tables PSA8A to D attached to this bulletin.
Figure 4: Sub-sector split of public sector net debt excluding public sector banks at February 2016 (£ billion)

Source: Office for National Statistics
Notes:
- Cross holdings between sub-sectors are removed in calculating public sector net debt, gross debt and liquid assets.
- PC Corporations' debt (consolidated) = non-financial PC gross debt (EYYD) Less CG/NFPCs' gross debt (KSC8) Less LG/NFPCs' cross holdings of debt (KSC9).
- APF - Bank of England Asset Purchase Facility.
Download this image Figure 4: Sub-sector split of public sector net debt excluding public sector banks at February 2016 (£ billion)
.png (48.4 kB) .xls (164.9 kB)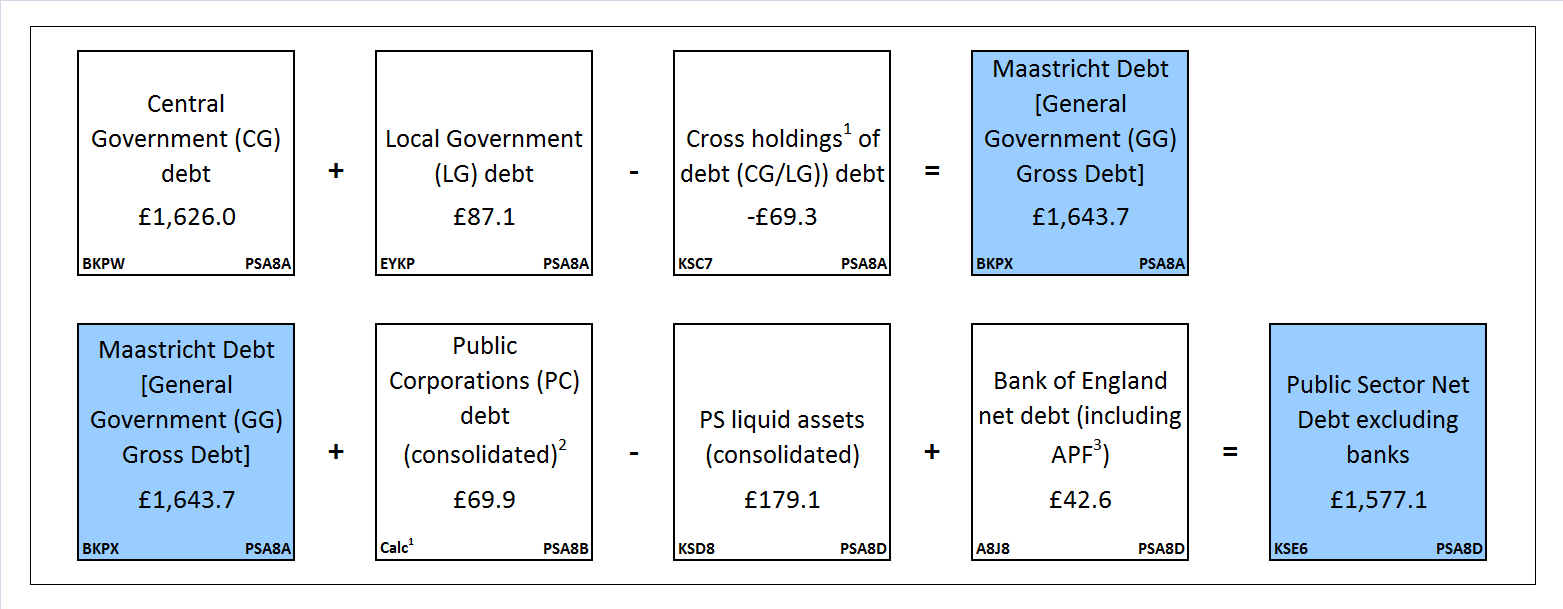
Changes in net debt between 2 points in time are normally similar to the net cash requirement for the intervening period, though the relationship is not an exact one because the net cash requirement reflects actual prices paid while the net debt is at nominal prices. For instance, gilts are recorded in net debt at their redemption (or face) value, but they are often issued at a different price due to premia or discounts being applied. The net cash requirement will reflect the actual issuance and redemption prices, but net debt only ever records the face (or nominal) value.
Net cash requirement is discussed further in Section 8 of this bulletin.
Back to table of contents6. Net borrowing and debt statistics compared with OBR forecast
The Office for Budget Responsibility (OBR) normally produces forecasts of the public finances twice a year (normally in March and December). The latest OBR forecast was published on 16 March 2016.
Figure 5 and Table 4 enable users to compare emerging data against the OBR forecasts. Caution should be taken when comparing public finance data with OBR figures for the full financial year, as data are not finalised until after the financial year ends. Initial estimates soon after the end of the financial year can be subject to sizeable revisions in later months. In addition, in-year timing effects on spending and receipts can affect year-to-date comparisons with previous years.
There can also be some methodological differences between OBR forecasts and outturn data. In its latest publication, OBR published a table within their Economic and fiscal outlook supplementary fiscal tables – March 2016 titled “Table: 2.45 Items included in OBR forecasts that ONS have not yet included in outturn”.
Figure 5 illustrates the public sector net borrowing excluding public sector banks (PSNB ex) for the financial year ending 2015 (April 2014 to March 2015), along with the first 11 month’s borrowing of the financial year ending 2016 (April to February 2016).
Figure 5: Cumulative public sector net borrowing by month
UK, all data excluding public sector banks
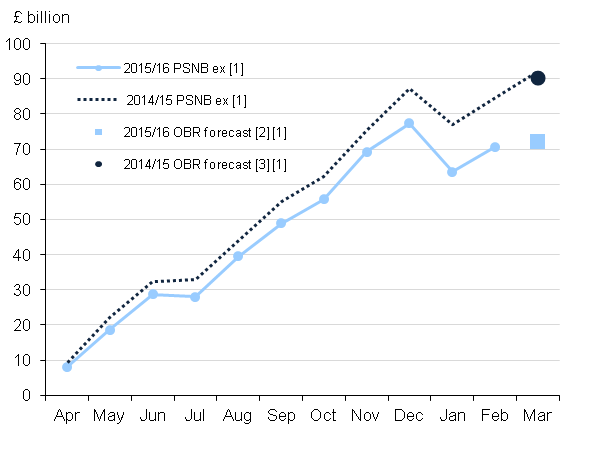
Source: Office for National Statistics
Notes:
- For the financial year ending 2015 (April 2014 to March 2015) and the financial year ending 2016 (April 2015 to March 2016).
- OBR forecast for PSNB ex from March 2016 Economic & Fiscal Outlook (EFO).
- OBR forecast for PSNB ex from March 2015 Economic & Fiscal Outlook (EFO).
Download this image Figure 5: Cumulative public sector net borrowing by month
.png (21.4 kB) .xls (151.6 kB)
In the financial year-to-date (April 2015 to February 2016), borrowing fell by £14.0 billion to £70.7 billion compared with the same period in the previous financial year.
The OBR forecast for the financial year ending 2016 (April 2015 to March 2016) is £72.2 billion which is £19.9 billion below the outturn in financial year ending 2015 (April 2014 to March 2015) of £92.1 billion presented in this bulletin.
Table 4 summarises the percentage change between the latest data for the financial year-to-date (April 2015 to February 2016) and in the previous financial year (April 2014 to February 2015). It contrasts these data with the percentage change between the latest full year outturn data for the financial year ending 2015 (April 2014 to March 2015) and the OBR forecast for the financial year ending 2016 (April 2015 to March 2016) (as published in March 2016).
Table 4: Public Sector Latest Outturn Estimates vs Office for Budget Responsibility (OBR) Forecasts
| UK, excluding public sector banks | £ billion1 (not seasonally adjusted) | ||||||
| Financial year-to-date7 | Full financial year8 | ||||||
| 2015/16 | 2014/15 | Increase/ Decrease % | 2015/16 OBR Forecast6 | 2014/15 Outturn | Forecast Increase/Decrease % | ||
| Current Budget Deficit2 | 40.5 | 56.3 | -27.9 | 39.0 | 57.1 | -31.7 | |
| Net Investment3 | 30.1 | 28.4 | 6.1 | 33.2 | 35.0 | -5.1 | |
| Net Borrowing 4 | 70.7 | 84.7 | -16.5 | 72.2 | 92.1 | -21.6 | |
| Net Debt 5 | 1,577.1 | 1,530.8 | 3.0 | 1,591.0 | 1,546.6 | 2.9 | |
| Net Debt as a % of GDP | 83.1 | 82.9 | NA | 83.7 | 83.6 | NA | |
| Source: Office for National Statistics | |||||||
| Notes: | |||||||
| 1. Unless otherwise stated. | |||||||
| 2. Current Budget Deficit is the difference between current expenditure (including depreciation) and current receipts. | |||||||
| 3. Net Investment is gross investment (net capital formation plus net capital transfers) less depreciation. | |||||||
| 4. Net Borrowing is Current Budget Deficit plus Net Investment. | |||||||
| 5. Net Debt is financial liabilities (for loans, deposits, currency and debt securities) less liquid assets. | |||||||
| 6. All OBR figures are from the OBR Economic and Fiscal Outlook published in March 2016. | |||||||
| 7. Financial year-to-date refers to the period from April to February. | |||||||
| 8. Full financial year ending 2015 (April 2014 to March 2015) and full financial year ending 2016 (April 2015 to March 2016). | |||||||
Download this table Table 4: Public Sector Latest Outturn Estimates vs Office for Budget Responsibility (OBR) Forecasts
.xls (34.3 kB)On the same day as this bulletin is released, the OBR publishes a commentary on the latest figures and how these reflect on its forecasts. The OBR provides this commentary to help users interpret the differences between the latest outturn data and the OBR forecasts by providing contextual information about assumptions made during the OBR’s forecasting process.
Back to table of contents7. International comparisons of borrowing and debt
The EU Government Deficit and Debt statistical bulletin is published quarterly (in January, April, July and November each year), to coincide with when the UK and other European Union member states are required to report on their deficit (or net borrowing) and debt to the European Commission.
On 15 January 2016, we published the latest EU Government Deficit and Debt Return. In this publication we report that:
- general government net borrowing (Maastricht Borrowing) in the financial year ending 2015 (April 2014 to March 2015) was £91.9 billion, equivalent to 5.0% of GDP; a decrease of £12.2 billion compared with the financial year ending March 2014
- general government gross debt (Maastricht Debt) at the end of March 2015 was £1,601.3 billion, equivalent to 87.5% of GDP; an increase of £79.9 billion compared with the end of the financial year ending March 2014
Eurostat published a government debt and deficit comparison from the information collated across its 28 member states.
The data used to produce the 15 January 2016 publication are consistent with those used in the production of the public sector finances statistical bulletin published on 22 December 2015. The latest public sector finances data in this bulletin reports that:
- general government net borrowing in the financial year ending 2015 (April 2014 to March 2015) was £91.1 billion, equivalent to 5.0% of GDP; a decrease of £12.1 billion compared with the previous financial year
- general government gross debt at the end of March 2015 was £1,601.3 billion, equivalent to 87.5% of GDP; an increase of £79.9 billion compared with March 2014
It is important to note that the GDP measure used as the denominator in the calculation of the debt ratios in the EU Government Deficit and Debt Return differs from that used within the public sector finances statistical bulletin.
An article, the use of GDP in fiscal ratio statistics, explains that for debt figures reported in the monthly public sector finances, a 12 month GDP total centred on the month is employed, while in the EU Government Deficit and Debt Return the total GDP for the preceding 12 months is used.
Back to table of contents8. Public sector net cash requirement
Net cash requirement is a measure of how much cash the government needs to borrow (or lend) to balance its accounts. In very broad terms, net cash requirement equates to the change in the level of debt.
Central government net cash requirement is reconciled against the change in central government net debt in Table REC3 attached to this bulletin.
The public sector net cash requirement excluding public sector banks (PSNCR ex) follows a similar trend to that of public sector net borrowing: peaking in the financial year ending 2010, though in recent years transfers from the Asset Purchase Facility have had a substantial impact on PSNCR ex but are PSNB ex neutral.
Public sector net cash requirement excluding public sector banks (PSNCR ex) in the financial year-to-date (April 2015 to February 2016) was £32.7 billion; £24.1 billion, or 42.4% less than in the same period in the previous financial year.
Figure 6 presents public sector cash requirement by sub-sector for the current financial year-to-date (April 2015 to February 2016). Time series for each of these component series are presented in Table PSA7A attached to this bulletin.
Figure 6: Sub-sector split of public sector net cash requirement excluding public sector banks, financial year-to-date (April to February 2016) (£ billion)

Source: Office for National Statistics
Notes:
- APF - Bank of England Asset Purchase Facility
- Effects of cash transactions between sub-sectors are removed in calculating public sector total net cash requirement (and consolidated expenditure and income totals).
Download this image Figure 6: Sub-sector split of public sector net cash requirement excluding public sector banks, financial year-to-date (April to February 2016) (£ billion)
.png (50.3 kB) .xls (145.4 kB)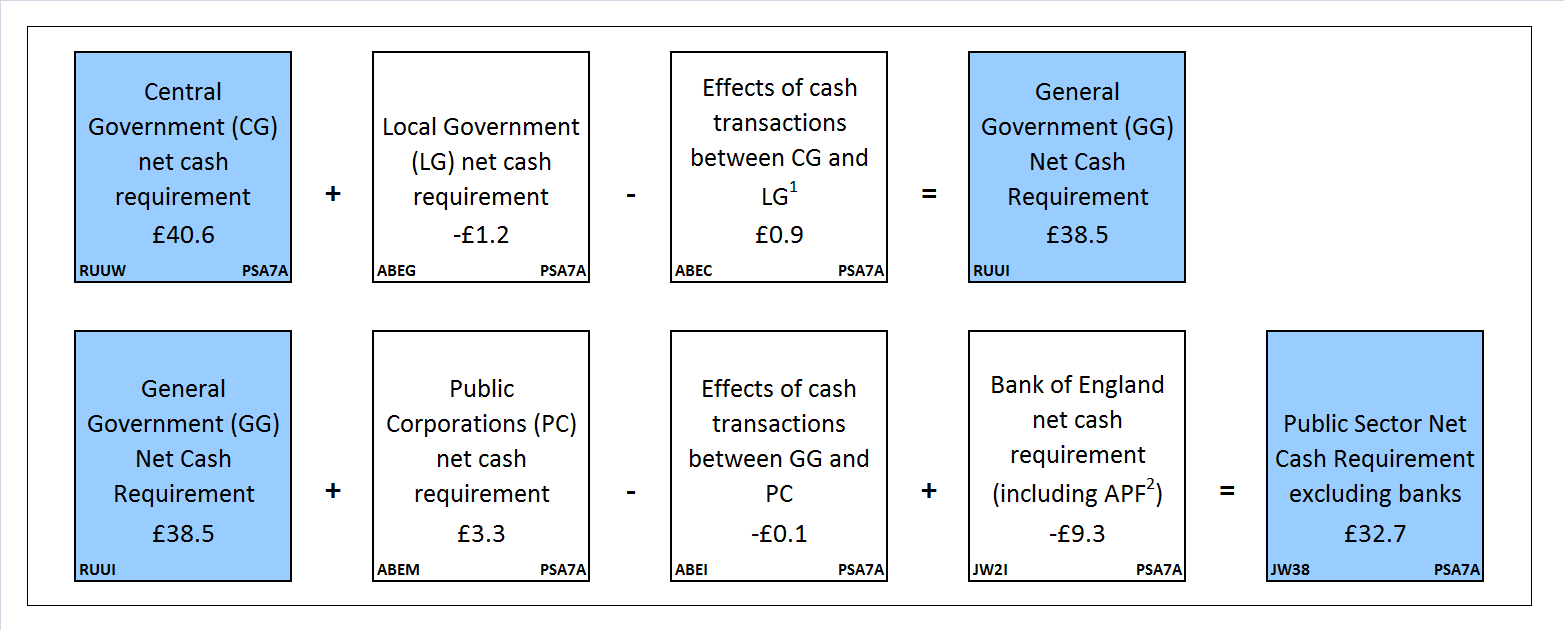
Central government net cash requirement (CGNCR) is a focus for some users, as it provides an indication of how many gilts (government bonds) the Debt Management Office may issue to meet the government’s borrowing requirements.
CGNCR was in surplus by £1.0 billion in February 2016; a decrease in CGNCR of £3.8 billion, or 135.2% compared with February 2015.
In the current financial year-to-date (April 2015 to February 2016), CGNCR was £40.6 billion; a decrease of £23.5 billion, or 36.7%, compared with the same period in the previous financial year.
Cash transfers from the Asset Purchase Facility (APF) were £2.2 billion lower in the current financial year-to-date (April 2015 to February 2016), than the previous financial year. Without the impact of these transfers, CGNCR would have been £25.7 billion lower in the current financial year-to-date (April 2015 to February 2016) than the same period in the previous financial year.
Recent events impacting on CGNCR
In the financial year ending 2016 (April 2015 to March 2016) the following events reduced the CGNCR:
- the transfers between the Bank of England Asset Purchase Facility Fund (BEAPFF) and central government
- the sale of shares in Lloyds Banking Group
- the sale of shares in Eurostar
- the sale of shares in Royal Mail
- the sale of shares in Royal Bank of Scotland
- the sale of UKAR assets
- the re-imbursement of support payments made to Ice Save
In the financial year ending 2015 (April 2014 to March 2015) the following events reduced the CGNCR:
- the transfers between the BEAPFF and central government
- the sale of shares in Lloyds Banking Group
In the financial year ending 2014 (April 2013 to March 2014) the following events reduced the CGNCR:
- the transfers between the BEAPFF and central government
- the sale of shares in Lloyds Banking Group
- the sale of shares in Royal Mail
In the financial year ending 2013 (April 2012 to March 2013) the following events reduced the CGNCR:
- the transfers between the BEAPFF and central government
- the Royal Mail Pension Plan transfer and subsequent sale of assets
- the transfer of the Special Liquidity Scheme final profits between BoE and central government
- the 4G Spectrum sale
Public sector net cash requirement
Although the central government net cash requirement is the largest part of the public sector net cash requirement excluding public sector banks (PSNCR ex), the total public sector net cash requirement (PSNCR) can be very different. The reason is that the PSNCR includes the net cash requirement of the public sector banking groups. In recent years, the public sector banking groups have recorded large cash surpluses which have had a substantial impact on the public sector net cash requirement.
Back to table of contents9. Central government receipts and expenditure
Current receipts
The government receives income mainly from taxes but also from national insurance contributions, interest & dividends, fines and rent.
As cash receipts are generally accrued back to earlier periods when the economic activity took place, the first monthly estimate for receipts is by nature provisional, and must include a substantial amount of forecast data.
Central government receipts follow a strong cyclical pattern over the year, with high receipts in April, July, October and January due to quarterly corporation tax returns being accrued to these months.
In both January and July (to a lesser extent) accrued receipts are particularly high due to receipts from quarterly corporation tax combining with those from income tax self-assessment. The revenue raised through income tax self-assessment, as well as primarily affecting January and July receipts, also tends to lead to high receipts in the following month (February and November respectively), although to a lesser degree.
Pay as you earn (PAYE) tends to vary little throughout the financial year on a monthly basis (excluding bonus months).
In recent years transfers from both the Bank of England Asset Purchase Facility Fund (BEAPFF) and the Special Liquidity Scheme (SLS) have boosted central government receipts. Though these transfers to central government have no impact on public sector borrowing due to the central government receipts being offset by the payments from the Bank of England.
Current expenditure
Current expenditure is the government’s spending on activities such as: social benefits (mainly pension payments), interest payments and other current expenditure including government departmental spending (excluding spending on capital assets).
Trends in central government current expenditure can be affected by monthly changes in debt interest payments which can be volatile as they depend on the movements in the Retail Prices Index. Excluding debt interest makes this statistic less volatile.
There is however one regular peak in net social benefits, which are higher in November than in other months due to the annual payment of the winter fuel allowance.
Year on year growth in net social benefits is affected by the up-rating of benefits to compensate for inflation based on the Consumer Prices Index (CPI). For recent years these are 5.2% for the financial year ending 2013, 2.2% in the financial year ending 2014, 2.7% in the financial year ending 2015 and 1.2% in the financial year ending 2016. However, for State Pensions there is a “triple guarantee” that means that they are up-rated by the highest of the CPI, increases in earnings or 2.5%. Also since the financial year ending 2014 (April 2013 to March 2014), the up-rating only applies to benefits received by disabled people and pensioners – benefits for people of working age have only been increased by 1% in these 3 years.
It can be difficult to compare the profile of monthly central government expenditure even when excluding both debt interest and net social benefits. Since the financial year ending 2014, there have been continuous changes to the profile of central government grants to local government and a number of changes to central government funding for local authorities (in particular the timing of grants).
In the latest financial year (ending 2016), the Revenue Support Grant, the main general grant paid to local authorities has been paid with a third of the total in April and the remainder in equal instalments in all the other months, whereas last year more than half of it was paid in April with the bulk of the remaining balance paid in February. This means that for this financial year, other current expenditure growth in April and February will be lower while year on year growth in other months will generally be higher.
Current budget deficit
The gap between current expenditure and current receipts (having taken account of depreciation) is referred to as the current budget. When current expenditure is greater than current receipts (income), the public sector runs a current budget deficit.
In February 2016, the central government current budget deficit was £1.5 billion, a decrease of £3.6 billion, or 71.0% compared with February 2015.
In the current financial year-to-date (April 2015 to February 2016), the central government current budget deficit was £35.9 billion, a decrease of £16.5 billion, or 31.4% compared with the same period in the previous financial year.
Figure 7 illustrates that the central government current budget deficit (as a percentage of GDP) has reduced since the financial year ending 2010 (April 2009 to March 2010), but is still larger than before the global financial shock.
Figure 7: Central government receipts, expenditure and current budget deficit as a percentage of GDP by financial year; the financial year ending 1994 to the financial year ending March 2015
UK all data excluding public sector banks
Source: Office for National Statistics
Notes:
- The financial year ending 1994 (April 1993 to March 1994) to the financial year ending 2015 (April 2014 to March 2015).
- Current budget deficit is receipts minus expenditure but also includes the effects of depreciation.
- GDP = Gross Domestic Product.
Download this chart Figure 7: Central government receipts, expenditure and current budget deficit as a percentage of GDP by financial year; the financial year ending 1994 to the financial year ending March 2015
Image .csv .xlsNet investment
Net investment represents the government’s spending on capital assets, like infrastructure projects, property and IT equipment, both as grants and by public sector bodies themselves minus capital receipts from the sale of capital assets.
In the financial year-to-date (April 2015 to February 2016), central government’s net investment was £29.6 billion, this represents an increase of £0.5 billion, or 1.7%, on the same period in the previous year and is largely due to increases in gross capital formation.
Central government net investment is difficult to predict in terms of its monthly profile as it includes some large capital grants (such as those to local authorities and education institutions) and can include some large capital acquisitions or disposals, all of which vary from year to year. Net investment in the last quarter of the financial year is usually markedly higher than that in the previous 3 quarters.
Central government net investment includes the direct acquisition minus disposal of capital assets (such as buildings, vehicles, computing infrastructure) by central government. It also includes capital grants to and from the private sector and other parts of the public sector. Capital grants are varied in nature and cover payments made to assist in the acquisition of a capital asset, payments made as a result of the disposal of a capital asset, transfers in ownership of a capital asset and the unreciprocated cancellation of a liability (that is conceding a debt will not be repaid).
The sum of net investment (spending on capital less capital receipts) and the current budget deficit constitute net borrowing.
Back to table of contents10. Recent events and methodological changes
Classification decisions
Each quarter we publish a Forward Workplan outlining the classification assessments we expect to undertake over the coming 12 months. To supplement this, each month a Classifications Update is published which announces classification decisions made and includes expected implementation points (for different statistics) where possible.
Classification decisions are reflected in the public sector finances at the first available opportunity and where necessary outlined in this section of the statistical bulletin.
Housing associations
The reclassification of English private registered providers of social housing (referred to in this bulletin as housing associations) from the private to the public corporation sector was reflected in public sector finances for the first time in the January 2016 statistical bulletin. This reclassification, announced on 30 October 2015, affects over 1,500 bodies providing social housing and applies back to July 2008 when the controls in the Housing and Regeneration Act 2008 came into force.
It is important to realise that current estimates of the impact of the reclassification of housing associations are preliminary estimates which may be updated when new data become available or methodological improvements are made. At present, we are actively seeking alternative data sources to investigate the impact of smaller providers on net borrowing, net cash requirement and net debt.
We are also doing further work to test the assumptions that have been made in compiling the estimates. These were: - all housing association debt is assumed to be held by the private sector - the Quarterly Survey of Private Registered Providers for March 2015 showed that Banks, Building Societies and Capital markets contributed 99% to agreed sources of funding - the Global Accounts are collected for the entire financial year - monthly transactions were estimated by dividing the financial year figure by 12 - providers which own less than 250 properties (less than 2% of the total stock) are assumed to have no net debt and not be investing in new properties
- providers owning or managing 250 and 1000 properties are assumed to have the same gross debt per 1,000 properties as those owning or managing between 1,000 and 2,500 homes - the relative impact of small providers on the accounts is assumed to be constant between financial year ending 2009 and financial year ending 2015
Please note that the reclassification is being introduced in Public Sector Finances before implementation in the Quarterly National Accounts and Blue Book publications. Any work to improve the methods and data sources used in these estimates will be reflected in the National Accounts publications at the time the reclassification is implemented.
March 2016 budget
The UK Government published its latest fiscal plans on 16 March 2016 and alongside this the Office for Budget Responsibility (OBR) published its economic and fiscal outlook. We will consider the impact on public sector finances of any future policy changes announced in the Budget and report on these in due course.
Bank Corporation Tax surcharge
In July 2015, HM Revenue and Customs (HMRC) published details of a surcharge to be levied on profits of banking companies in accounting periods beginning on or after 1 January 2016. The measure imposes a surcharge of 8% on the profits of banking companies. The profits will be calculated and reported on the same basis as for corporation tax, but with some reliefs added back.
Share sales
In recent years the government has entered a program of selling shares in publicly owned organisations. For most share sales, the proceeds will reduce the central government net cash requirement (CGNCR) and public sector net debt (PSND) by an amount corresponding to the cash raised from the sale but have no impact on public sector net borrowing.
This section outlines the recent central government share sale program.
Lloyds Banking Group
On 17 September 2013, the UK government began selling part of its share holdings in Lloyds Banking Group (LBG). A further share sale on 23 and 24 March 2014 meant that the UK government surrendered in total a 13.5% stake in the institution, a quantity sufficient to lead to LBG being re-classified from a public sector body to a private sector body.
Based on the currently available information, we have recorded no LBG share sales in February 2016, though this may be revised at a later date.
Since December 2014, the government has continued reducing its shareholding in LBG via a pre-arranged trading plan, raising an estimated total of £16.2 billion to date.
In January 2016, the government announced that it would extend Lloyds’ trading plan for a further 6 months (ending no later than 30 June 2016). It stated that the current trading plan has reduced the government’s remaining stake in Lloyds to around 9%.
Royal Bank of Scotland
In August 2015, the government announced the sale of approximately 5.4% of its shareholding in Royal Bank of Scotland. The £2.1 billion raised from this sale reduced central government net cash requirement and net debt in August 2015 by a corresponding amount.
Royal Mail
In June 2015, the government announced the sale of half of its retained shareholding in Royal Mail. The £750 million raised from this sale of a 15% stake reduced central government net cash requirement and net debt in June 2015 by a corresponding amount.
Eurostar
In March 2015, the government announced the sale of its 40% stake in the cross-Channel train operator Eurostar. The £757 million raised from this sale reduced central government net cash requirement and net debt in May 2015 by a corresponding amount.
Bank of England Asset Purchase Facility Fund (APF)
The APF currently holds government securities (gilts) on which it earns interest and it pays interest on the reserves created by the Bank of England to finance it. These flows are reflected in PSNB ex as they enter and leave the APF. The net liabilities of the APF increase PSND ex.
On 9 November 2012, the Chancellor announced an agreement with the Bank of England to transfer the excess cash in the APF to the Exchequer. These flows are internal to the public sector and so do not affect PSNB ex.
Note this treatment follows the conclusion of the 2013 PSF Review consultation.
In February 2016, there were no transfers from the Bank of England Asset Purchase Facility Fund (BEAPFF) to HM Treasury. The amount transferred in the current financial year-to-date (April 2015 to February 2016) was £8.5 billion; £2.2 billion less than in the equivalent period in the previous financial year (April 2014 to February 2015).
The next expected APF transfer will occur in April 2016.
The Bank of England entrepreneurial income for the financial year ending 2015 (April 2014 to March 2015) was calculated as £12.5 billion. This is the total amount of dividend transfers that can impact on central government net borrowing in the financial year ending 2016 (April 2015 to March 2016).
Between April 2012 and March 2013, there were £11.3 billion of transfers from the BEAPFF to HM Treasury, while in the same period in financial year ending 2014 and 2015 the transfers were £31.1 billion and £10.7 billion respectively.
All cash transferred from the Asset Purchase Facility to HM Treasury is fully reflected in central government net cash requirement and net debt. For more detail of transactions relating to the Asset Purchase Facility, see Table PSA9.
Grants to local government
The Revenue Support Grant (RSG) is the main revenue funding grant paid by central government to local government in England.
In the financial year ending 2015 (April 2014 to March 2015), more than half of the RSG was paid in April with the remaining balance paid in February and March. The payment profile has changed for the financial year ending 2016 (April 2015 to March 2016), with one-third of the grant paid in April and the rest expected to be paid evenly through the year.
This change in profile explains almost all of the fall in central government current transfers to local government and central government other current spending in April 2015 compared with April last year. The impact of this change is offset in local government net borrowing.
Back to table of contents11. Revisions since previous bulletin
In publishing monthly estimates, it is necessary that a range of different types of data sources are used. A summary of the different sources used and the implications this has for data revisions is provided in the document Sources summary and their timing.
The Public Sector Finances Revision Policy provides information of when users of the statistics published in the public sector finances and Government Deficit and Debt under the Maastricht Treaty statistical bulletins should expect to see methodological and data related revisions.
More detail of the methodology and sources employed can be found in the Public Sector Finances Methodological Guide.
Revisions tend to be the result of both updated data sources and methodology changes. This month the reported revisions are solely the result of updated data sources.
Table 5 summarises revisions between the data contained in this bulletin and the previous publication.
Public sector net borrowing (excluding public sector banks)
Public sector net borrowing (excluding public sector banks) in the current financial year-to-date (April 2015 to January 2016) was revised downwards by £2.9 billion. Of this; central government net borrowing was revised downwards by £2.7 billion, with smaller revisions in net borrowing attributable to local government (down £0.3 billion), public corporations (down £0.2 billion) and Bank of England (BoE) (up £0.3 billion).
Central government borrowing
Over the current financial year-to-date, central government net borrowing (CGNB) has been revised down by £2.7 billion.
Current receipts were revised up by £0.8 billion; VAT receipts and social (national insurance) contributions were revised upward by £0.5 billion and £0.7 billion respectively, while taxes on income & wealth and interests & dividends were revised downward by £0.6 billion and £0.2 billion respectively.
Current expenditure was revised down by £1.5 billion, with interest and “other current expenditure” reducing by £0.9 billion and £0.5 billion respectively.
The £0.8 billion increase in current receipts combined with the £1.5 billion reduction in the estimate of current expenditure led to a £2.1 billion decrease to the central government current budget deficit estimate.
This decrease in the current account combined with a £0.6 billion downward revision to the estimate of capital spending (net investment) has resulted in a £2.7 billion decrease to the estimate of net borrowing in the current financial year-to-date. Revisions to central government net borrowing are also evident in Table 5 in each of the financial years between 2007/08 (April 2007 to March 2008) and 2013/14 (April 2013 to March 2014). These are a result of a revised data on the taxes on income and wealth supplied by HM Revenue and Customs.
Local government borrowing
Over the current financial year-to-date, local government net borrowing (LGNB) has been revised down by £0.3 billion; reflecting new data received from DCLG, other ONS departments along with updated OBR forecast information.
In earlier periods (back to financial year ending March 1998), updates to interest payments, following methodological improvement to the calculation of loan interest, introduced some small revisions to net borrowing. These changes have provided us with an opportunity to revisit the methodology used to estimate the monthly profile of local government net borrowing prior to December 2009 and make it consistent with that used in later periods. The current methodology used was introduced in January 2012 to make more use of accrued expenditure and revenue data in order to improve the reliability of in-year local government data. In-year data for earlier periods was largely based on cash flow data. Replacing this with that derived by the latest methodology has resulted to revisions to the monthly profile for local government net borrowing but has no impact on the quarterly or annual time series.
Public corporations borrowing
The estimate of public corporation net borrowing (PCNB) over the current financial year-to-date has decreased by £0.2 billion due to updated forecast information.
BoE borrowing
The estimate of the net borrowing of BoE over the current financial year-to-date has increased by £0.3 billion due to updated interest information from the BEAPFF.
Public sector net debt (excluding public sector banks)
Public sector net debt (excluding public sector banks) (PSND ex) at the end of January 2016 has been revised down by £4.5 billion. Updated Network rail data reduced central government gross debt by £1.9 billion. This, combined with updated information on the cross holdings of local and central debt, reduced the estimate of general government gross debt by £3.5 billion. Further updates to our data sources have led to a reduction of £0.6 billion in the estimate of BoE’s contribution to public sector net debt.
Public sector net cash requirement (excluding public sector banks)
Public sector net cash requirement (excluding public sector banks) (PSNCR ex) has been revised downward by £0.4 billion in the financial year-to-date (April 2015 to January 2016), almost entirely due to updated source information on BoE.
Table 5: Revisions between this bulletin and the previous bulletin
| UK, Previous bulletin refers to the PSF bulletin published on 19 February 2016 | ||||||||
| £ billion1 (not seasonally adjusted) | ||||||||
| Net Borrowing | ||||||||
| Period | CG2 | LG3 | NFPCs4 | BoE5 | PSNB ex6 | PSND ex7 | PSND % of GDP8 | PSNCR ex9 |
| 2007/08 | -0.1 | 0.0 | 0.0 | 0.0 | -0.1 | 0.0 | 0.0 | 0.0 |
| 2008/09 | -0.2 | 0.0 | 0.0 | 0.0 | -0.2 | 0.0 | 0.0 | 0.0 |
| 2009/10 | 0.0 | 0.0 | 0.0 | 0.0 | 0.0 | 0.0 | 0.0 | 0.0 |
| 2010/11 | 0.1 | 0.0 | 0.0 | 0.0 | 0.0 | 0.0 | 0.0 | 0.0 |
| 2011/12 | -0.1 | 0.0 | 0.0 | 0.0 | -0.1 | 0.0 | 0.0 | 0.0 |
| 2012/13 | -0.1 | 0.0 | 0.0 | 0.0 | -0.1 | 0.0 | 0.0 | 0.0 |
| 2013/14 | -0.1 | 0.0 | 0.0 | 0.0 | -0.1 | 0.0 | 0.0 | 0.0 |
| 2014/1510 | 0.0 | 0.1 | 0.1 | 0.0 | 0.2 | -0.2 | -0.1 | 0.0 |
| 2015/16 ytd11 | -2.7 | -0.3 | -0.2 | 0.3 | -2.9 | -4.5 | 0.5 | -0.4 |
| 2015 April12 | 0.1 | 0.0 | -0.1 | 0.0 | 0.0 | -0.2 | 0.1 | 0.0 |
| 2015 May12 | 0.1 | 0.0 | -0.1 | 0.0 | 0.0 | -0.2 | 0.2 | 0.0 |
| 2015 June12 | 0.1 | -0.1 | -0.1 | 0.0 | 0.0 | -0.3 | 0.3 | 0.0 |
| 2015 July12 | 0.1 | -0.1 | 0.0 | 0.2 | 0.2 | -0.4 | 0.4 | -0.2 |
| 2015 August12 | -0.2 | -0.1 | 0.0 | 0.2 | -0.1 | -0.6 | 0.5 | -0.3 |
| 2015 September12 | -0.1 | -0.1 | 0.0 | 0.0 | -0.2 | -0.7 | 0.6 | 0.0 |
| 2015 October12 | 0.2 | -0.1 | 0.0 | 0.0 | 0.1 | -1.1 | 0.6 | 0.0 |
| 2015 November12 | -0.1 | -0.1 | 0.0 | -0.1 | -0.3 | -1.4 | 0.6 | 0.1 |
| 2015 December12 | 0.0 | -0.1 | 0.0 | 0.0 | 0.0 | -0.3 | 0.7 | -0.1 |
| 2016 January12 | -2.9 | 0.3 | 0.0 | 0.0 | -2.6 | -4.5 | 0.5 | 0.0 |
| Table source: Office for National Statistics | ||||||||
| Table notes: | ||||||||
| 1. Unless otherwise stated. | ||||||||
| 2. Central Government. | ||||||||
| 3. Local Government. | ||||||||
| 4. Non-Financial public corporations. | ||||||||
| 5. Bank of England. | ||||||||
| 6. Public sector net borrowing excluding public sector banks. | ||||||||
| 7. Public sector net debt excluding public sector banks. | ||||||||
| 8. GDP = Gross Domestic Product. | ||||||||
| 9. Public sector cash requirement excluding public sector banks. | ||||||||
| 10. 2014/15 represents financial year ending 2015 (April 2014 to March 2015). | ||||||||
| 11. ytd = Year-to-date. | ||||||||
| 12. Monthly revisions are in part due to the quarterly practise of aligning the monthly public sector finances with quarterly datasets. | ||||||||
Download this table Table 5: Revisions between this bulletin and the previous bulletin
.xls (35.8 kB)To provide users with an insight into the drivers of the historical revisions between publications, this bulletin presents 3 revisions tables:
- Table PSA1R complements PSA1 and provides a revisions summary (between the current and previous publication) to headline statistics in this release
- Table PSA2R complements PSA2 and provides the revisions (between the current and previous publication) to net borrowing by sector
- Table PSA6R complements PSA6B and provides the revisions (between the current and previous publication) to the components of central government net borrowing
Tables PSA1R and PSA6R are published in excel format only in Appendix A to this release.
In addition, Appendix C to this bulletin presents a statistical analysis on several main components of the central government account (current receipts, current expenditure, net borrowing and net cash requirement) to determine whether their average revisions are statistically significant.
Back to table of contents12. New for the bulletin
Recent public sector finance articles
We are currently in the process of updating public sector finance guidance and methodology articles published on our website. Recently we have updated articles covering:
- Public Sector Finances Revision Policy
- Public Sector Finances classification: Uses and Users of Government Finance Statistics
- Background for users of Public Sector Finance Statistics
- Production of the Public Sector Finances Statistical bulletin: responsibilities and accountabilities
- Methodological Improvements to National Accounts for Blue Book 2015: Classifications
- The use of GDP in fiscal ratio statistics
The reconciliation of net cash requirement to debt
The issues and subsequent revisions to CGNCR reported in November 2014 were identified through work undertaken to reconcile the 3 different fiscal measures (that is, net cash requirement, net borrowing and net debt) and to reconcile the central government net cash requirement with cash reported in audited resource accounts.
We are currently building these reconciliation processes into the monthly production systems. The first of these new reconciliations, Table REC3, attempts to reconcile central government net cash requirement and net debt.
Table REC3 is not currently designated a National Statistic and should be considered as a work-in-progress, with plans to introduce further refinements in the coming months.
UK Statistics Authority assessment of public sector finances
Alongside monitoring the production and publication of official statistics, the UK Statistics Authority's statutory function is to prepare, adopt and publish a Code of Practice for Statistics (in consultation with others as appropriate), setting out the standards that the Statistics Authority expects official statistics to meet. The Statistics Authority also determines whether official statistics comply with the Code and, if so, designates them with the quality mark “National Statistics”. The process of determining compliance with the Code and designation as National Statistics is known as “Assessment”.
On 8 November 2015, the UK Statistics Authority published its latest assessment report of public sector finances. The report confirmed the National Statistics status of the public sector finances bulletin subject to certain requirements being met.
We value your feedback
The public sector finances can be complex. To ensure these important statistics are accessible to all, we welcome your feedback on how best to explain concepts and trends in these data. Please contact us at: psa@ons.gov.uk
List of tables associated with this bulletin
- PSA1 Public Sector Summary
- PSA2 Public Sector Net Borrowing: by sector
- PSA3 Public Sector Current Budget Deficit, Net Borrowing and Net Cash Requirement (excluding public sector banks)
- PSA4 Public Sector Net Debt (excluding public sector banks)
- PSA5A Long Run of Fiscal Indicators as a percentage of GDP on a financial year basis
- PSA5B Long Run of Fiscal Indicators as a percentage of GDP on a quarterly basis*
- PSA6A Net Borrowing: month and year-to-date comparisions
- PSA6B Central Government Account: Overview
- PSA6C Central Government Account: Total Revenue,Total Expenditure and Net Borrowing
- PSA6D Central Government Account: Current Receipts
- PSA6E Central Government Account: Current Expenditure
- PSA6F Central Government Account: Net Investment
- PSA6G Local Government Account: Overview*
- PSA6H Local Government Account: Total Revenue, Total Expenditure and Net Borrowing*
- PSA6I Local Government Account: Current Receipts*
- PSA6J Local Government Account: Current Expenditure*
- PSA6K Local Government Account: Net Investment*
- REC1 Reconciliation of Public Sector Net Borrowing and Net Cash Requirement (excluding banking groups)
- REC2 Reconciliation of Central Government Net Borrowing and Net Cash Requirement
- PSA7A Public Sector Net Cash Requirement
- PSA7B Public Sector Net Cash Requirement*
- PSA7C Central Government Net Cash Requirement
- PSA7D Central Government Net Cash Requirement on own account (receipts and outlays on a cash basis)
- REC3 Reconciliation of Central Government Net Cash Requirement and Debt (Experimental Statistic)
- PSA8A General Government Consolidated Gross Debt nominal values at end of period
- PSA8B Public Sector Consolidated Gross Debt nominal values at end of period
- PSA8C General Government Net Debt nominal values at end of period
- PSA8D Public Sector Net Debt nominal values at end of period
- PSA9 Bank of England Asset Purchase Facility Fund (APF)
- PSA10 Public Sector transactions by sub-sector and economic category
- PSA1R Public Sector Statistics: Revisions since last publication*
- PSA2R Public Sector Net Borrowing: by sector; Revisions since last publication
- PSA6R Central Government Account: overview; Revisions since last publication*
These tables are published in Excel format only.
Appendices – Data in this release
- Appendix A Public Sector Finances Tables 1 to 10
- Appendix B Large impacts on public sector fiscal measures excluding financial intervention (one off events)
- Appendix C Revisions Analysis on several main components of the central government account (current receipts, current expenditure, net borrowing and net cash requirement)
The following guidance documents aim to help users gain a detailed understanding of the public sector finances:
- Monthly statistics on Public Sector Finances: a methodological guide
- Developments to Public Sector Finances Statistics
- Quality and Methodology Information