Table of contents
- Main points
- Overview
- Your views matter
- R&D expenditure
- R&D expenditure by product group
- Civil and defence R&D expenditure, by broad product group
- R&D expenditure by industry
- Employment in UK businesses on performing R&D
- Country and regional breakdown of expenditure and employment in UK businesses on performing R&D
- Sources of funds for expenditure on R&D performed in UK businesses
- Ownership of businesses performing R&D in the UK
- International comparison
- Background notes
- Methodology
1. Main points
In 2014, total expenditure on Research and Development (R&D) performed in UK businesses, in current prices, increased by 6% to £19.9 billion compared with 2013
Civil R&D expenditure increased by 7% in 2014 to £18.4 billion, while defence R&D expenditure decreased by 6% in 2014 to £1.6 billion
In 2014, expenditure on R&D performed in UK foreign-owned businesses increased by 2% and accounted for 52% of total expenditure
Business R&D expenditure as a proportion of current price Gross Domestic Product (GDP) in 2014 remained unchanged from 2013, at 1.1%
In 2014, total expenditure on R&D performed in UK businesses, in constant prices, increased by 5% compared with 2013
In 2014, total business employment in R&D in the UK increased by 7% to 192,000 Full Time Equivalents (FTE)
2. Overview
This release provides estimates of businesses' expenditure and employment relating to R&D performed in the UK in 2014. These statistics are presented on a current price basis, which reports prices as they were at the time of measurement and not adjusted for inflation, and constant prices, which are prices adjusted for inflation between years using the GDP deflator. The latter is more appropriate when analysing changes in R&D expenditure over time.
R&D is defined as “creative work undertaken on a systematic basis in order to increase the stock of knowledge, including knowledge of man, culture and society and the use of this stock of knowledge to devise new applications”. The statistics are produced according to internationally agreed standards defined by the Organisation for Economic Cooperation and Development (OECD), as published in the “Frascati” Manual.
R&D statistics are collated using information from 5,500 businesses1 from across the UK and provide data from 1993 onwards. These data are used across government for policy and monitoring purposes on science and technology, of which R&D is an important part, and are also used in academia and the private sector. From 2014, R&D will contribute to the formation of UK assets, and therefore feed into key economic statistics such as GDP and the value of the UK’s net worth.
In March 2016, we will publish UK Gross Domestic Expenditure on Research and Development (GERD) for the year 2014. The GERD statistical bulletin will include estimates for R&D carried out by 4 sectors of the economy: namely business enterprise (BERD), higher education (HERD), government including research councils (GovERD) and private non-profit (PNP) organisations. GERD is the preferred measure for use in international comparisons of overall R&D expenditure.
We also publish the UK Government Expenditure on Science, Engineering and Technology (SET) statistical bulletin. SET statistics are broader than just research and development (R&D), as they comprise government R&D expenditure (performed in the UK and overseas), knowledge transfer activities, the indicative UK contributions to the European Union’s (EU) R&D expenditure, and personnel associated with scientific and technical postgraduate education and training.
Notes for overview
- Each year approximately 4,000 businesses are selected for this survey by us from a continually updated register of known R&D performers in England, Scotland and Wales. In addition to this, approximately 1,500 businesses in Northern Ireland are surveyed by the Department for Finance and Personnel, Northern Ireland (DFPNI) and their estimates added to those collected by us to form UK totals.
3. Your views matter
We are constantly aiming to improve this release and its associated commentary. We would welcome any feedback you might have, and would be particularly interested in knowing how you make use of these data to inform your work. Please contact us via email: RandD@ons.gov.uk or telephone Cecil Prescott on +44 (0)1633 456767.
Back to table of contents4. R&D expenditure
Expenditure on R&D by UK businesses reached £19.9 billion in 2014 in current prices, up from £8.1 billion in 1990. The change in R&D expenditure reflected a steady increase over the period, with an average annual growth rate of 3.8%.
In constant price terms, the value of R&D expenditure in 2014 (£19.9 billion) reached its highest level on record, surpassing 2013’s high by £0.9 billion. A long-term upward trend is still evident when considering R&D expenditure in constant price terms, with an average annual growth rate of 1.4% since 1990 levels (£14.4 billion) (Figure 1).
Figure 1: Expenditure by UK businesses on performing R&D, 1990 to 2014
Source: Office for National Statistics
Download this chart Figure 1: Expenditure by UK businesses on performing R&D, 1990 to 2014
Image .csv .xlsFigure 2 shows total business R&D expenditure in 2014 represented 1.1% of GDP. This estimate is in line with recent years which have fluctuated between 1.0 and 1.1 every year since 2000.
Figure 2: Expenditure by UK businesses on performing R&D as a percentage of GDP, 1990 to 2014
Source: Office for National Statistics
Download this chart Figure 2: Expenditure by UK businesses on performing R&D as a percentage of GDP, 1990 to 2014
Image .csv .xls5. R&D expenditure by product group
On an annual basis, the 400 largest R&D performers, which accounted for approximately 79% of the 2014 total R&D expenditure estimate, are asked to select the industry product groups that best describe the type of R&D activities that they undertake. For the 2014 survey, the largest 400 performers were those businesses previously reporting more than approximately £4.4 million expenditure on performing R&D. The concept of "product groups" is discussed in detail as part of the background notes to this release (Background Note 9).
Since 2013, 24 of the 33 product groups experienced an increase in levels of R&D expenditure by UK businesses in current prices, while 7 product groups decreased. In terms of percentage growth, the largest increases were in the Casting of iron and steel (89%), Wholesale and retail trade (47%) and Construction (45%) product groups.
In 2014, Pharmaceuticals continued to be the largest product group, with £3.9 billion expenditure in current prices, accounting for 20% of total expenditure on R&D performed in UK businesses, despite experiencing decreasing expenditure for a third successive year (Figure 3).
Figure 3: Expenditure by UK businesses on performing R&D in current prices, by largest product groups, 2007 to 2014

Source: Office for National Statistics
Download this image Figure 3: Expenditure by UK businesses on performing R&D in current prices, by largest product groups, 2007 to 2014
.png (75.3 kB) .xls (30.2 kB)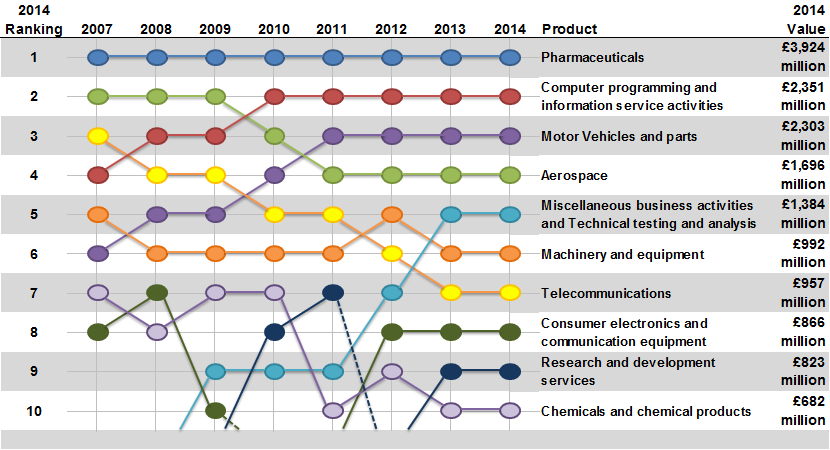
The largest increase in an individual product group was in the Motor vehicles and parts group, which increased for the third year in succession, to £2.3 billion in 2014, an increase of £236 million (11%) from the estimate of £2.1 billion in 2013, accounting for 12% of total expenditure on R&D performed in UK businesses in 2014.
More evidence of the growth in the Motor Industry can be viewed in our statistical bulletin ”UK Manufacturers’’ Sales by Product (PRODCOM) for 2014.
Another notable increase was in the Computer programming and information services activities group which increased by £220 million in current prices from the 2013 estimate of £2.1 billion in 2013, a 10% increase to £2.4 billion. In 2014, this group also accounted for 12% of total expenditure on R&D performed in UK businesses.
Other product groups reporting around £1.0 billion or more R&D expenditure in the UK in 2014 were:
Aerospace, £1.7 billion (9% of total R&D expenditure)
Miscellaneous business activities; Technical testing and analysis, £1.4 billion (7%)
Machinery and equipment, £992 million (5%)
Telecommunications £957 million (5%)
These 7 product groups accounted for 68% of the total UK business R&D expenditure in 2014.
Back to table of contents6. Civil and defence R&D expenditure, by broad product group
R&D expenditure statistics can be split between the civil and defence sectors. Expenditure on R&D performed by UK businesses in the civil sector in 2014 (£18.4 billion) accounted for 92% of the total, with the remainder accounted for by defence (£1.6 billion). The value of R&D expenditure within the civil sector in 2014 reflected a 7% rise on the previous year, while expenditure on defence R&D experienced a decline of 6% over the same period.
Figure 4 presents civil and defence R&D expenditure since 1990, and highlights that, while R&D expenditure by businesses in the civil sector increased by an annual average growth rate of 2.1% in constant prices since 1990, business expenditure on R&D in the defence sector decreased by an average of 2.9% per annum over the same period.
Figure 4: Expenditure by UK businesses on performing civil and defence R&D, 1990 to 2014
Source: Office for National Statistics
Download this chart Figure 4: Expenditure by UK businesses on performing civil and defence R&D, 1990 to 2014
Image .csv .xlsCivil R&D expenditure can be further split between the Manufacturing, Services and “Other” sectors (see Table 5 in 2014 Datasets). In 2014, expenditure in Manufacturing accounted for 65% of total civil expenditure on R&D performed in UK businesses, compared with 75% in 2003. Manufacturing accounted for 88% of total defence expenditure on R&D performed in UK businesses in 2014, compared with 90% in 2003.
Mechanical engineering, part of the Manufacturing sector, was the largest contributor to defence expenditure on R&D performed in UK businesses (29% of total defence expenditure) in 2014, with Aerospace (23%) the second highest.
Back to table of contents7. R&D expenditure by industry
Estimates of R&D expenditure on an industry basis, according to the Standard Industrial Classification (SIC), were first introduced in the 2011 BERD statistical bulletin to broaden the scope of the estimates (See Table 27 in 2014 datasets).
It is important to note that estimates of R&D by industry are not directly comparable with the estimates of R&D expenditure by product group. This is because businesses may report significant R&D in product groups which are different to the main classification of their business according to the SIC. See Background Notes 9 and 10, which explain the concepts of product groups and SIC in more detail.
The highest level of business R&D expenditure in 2014 by SIC was performed by businesses that were classified to the “Scientific Research and Development” industry, at £5.0 billion which represented 25% of total expenditure (Figure 5).
Five other industries had R&D expenditure of around £1.0 billion or more:
Manufacture of motor vehicles and trailers, £2.0 billion (10%)
Architectural and engineering activities, £1.7 billion (9%)
Computer programming, consultancy and related activities £1.6 billion (8%)
Manufacture of other transport equipment, £1.6 billion (8%)
Manufacture of computer, electronic and optical products, £1.0 billion (5%)
These 6 industries accounted for 65% of the total UK business R&D expenditure in 2014.
Figure 5: Expenditure by UK businesses on performing R&D, by largest industries, 2011 to 2014
Source: Office for National Statistics
Download this chart Figure 5: Expenditure by UK businesses on performing R&D, by largest industries, 2011 to 2014
Image .csv .xls8. Employment in UK businesses on performing R&D
Estimates of employment in R&D are produced on a full-time equivalent (FTE) basis, whereby businesses convert part-time employees’ hours into full-time employees’ equivalent. FTE estimates provide a better indication of total labour input than a simple headcount.
The lowest level of employment in R&D in the last decade occurred in 2005, when 146,000 FTE were employed, while the highest level (192,000) was reached in 2014 (Figure 6).
The number of FTE staff employed in R&D has increased from 179,000 in 2013 to 192,000 in 2014, an increase of 7%. While there has been growth in recent years in the number of people working on R&D, this should be seen in the context of a growth in the total employment in the UK labour market. Therefore, part of the growth in employment on R&D may be reflective of the wider growth in total employment in the economy. See our labour market statistics for more information on total employment levels.
The 2014 estimate comprised:
102,000 scientists and engineers (53%)
57,000 technicians (30%)
33,000 administrative staff (17%)
Figure 6: Employment in UK businesses on performing R&D, 1990 to 2014
Source: Office for National Statistics
Download this chart Figure 6: Employment in UK businesses on performing R&D, 1990 to 2014
Image .csv .xls9. Country and regional breakdown of expenditure and employment in UK businesses on performing R&D
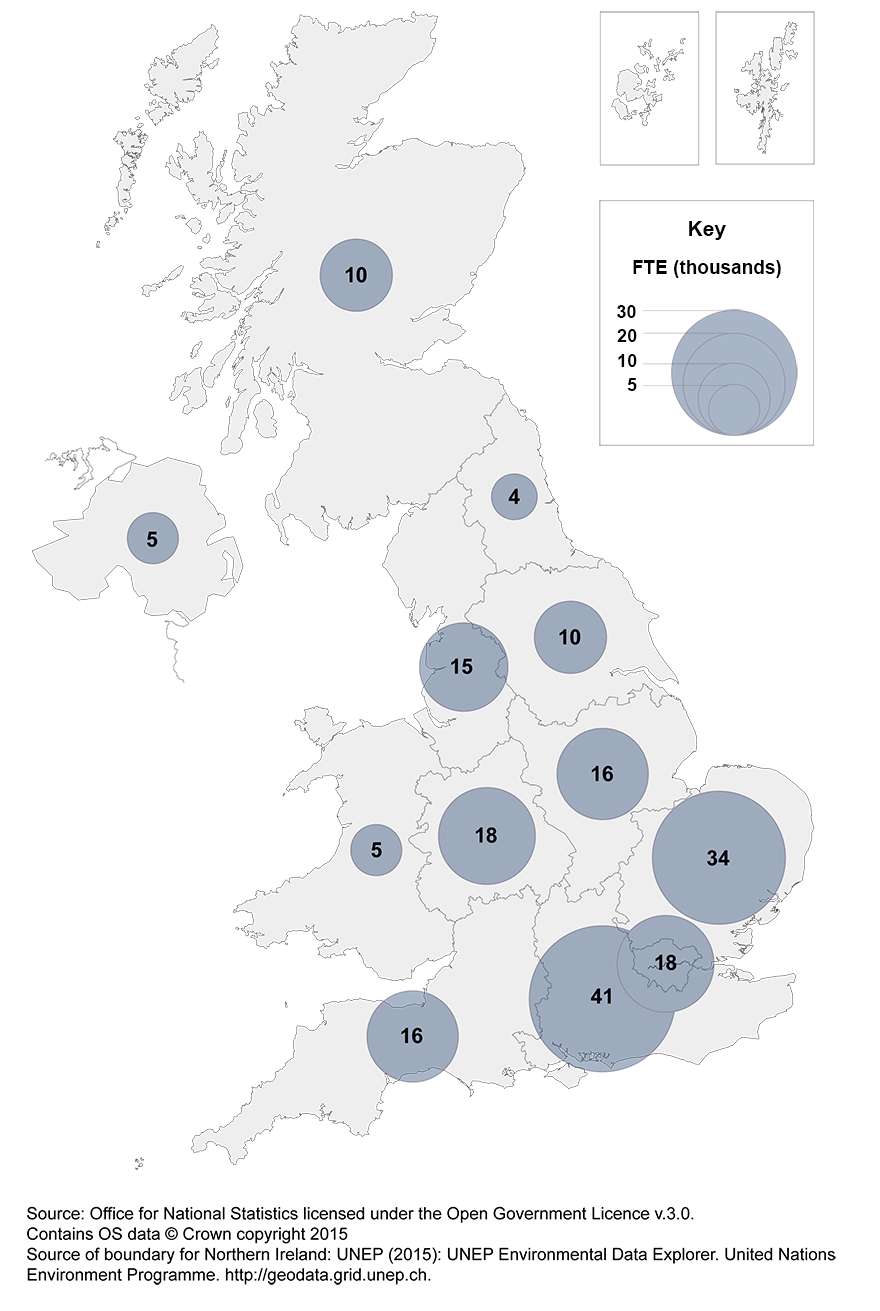
It is possible, using data from the BERD survey, to analyse R&D expenditure by country and region. In this context, “region” refers to the location where a business performs R&D, not the location of either the business’ headquarters or that of any external funders.
The South East and East of England continue to dominate where R&D expenditure takes place in the UK. These 2 regions combined accounted for 43% of UK business R&D expenditure in 2014 (Map 1). These regions combined also employed 75,000 FTE which made up 39% of total R&D employment in 2014.
The regions or countries with the lowest levels of employment in R&D were the North East employing 4,000 FTE, with Wales and Northern Ireland both employing 5,000 FTE R&D staff. (Map 2). These regions or countries also have the lowest corresponding totals of expenditure on business R&D.
Map 1: Expenditure by UK businesses on performing R&D, by country or region, 2014

Source: Office for National Statistics
Download this image Map 1: Expenditure by UK businesses on performing R&D, by country or region, 2014
.png (335.4 kB)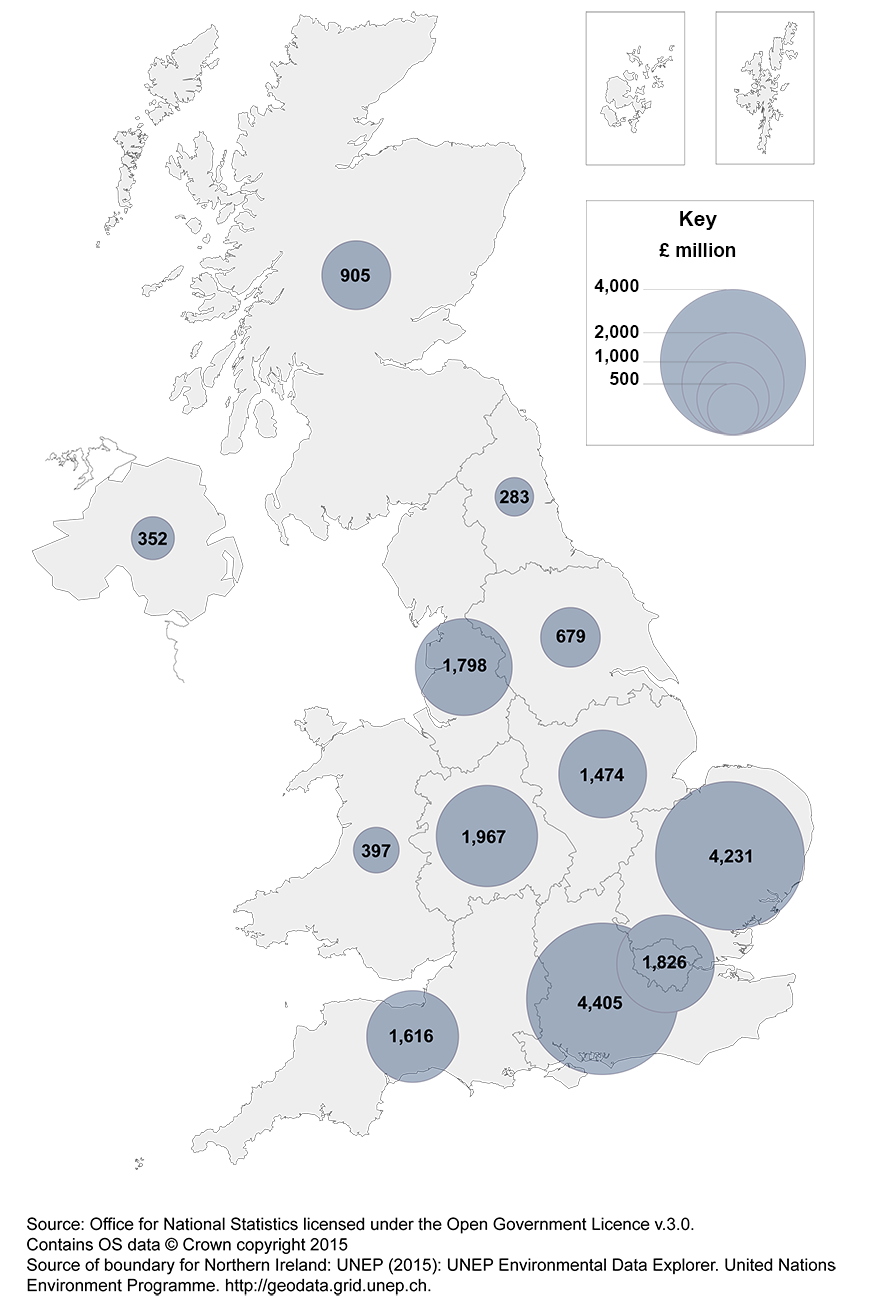
The majority (92%) of UK R&D expenditure was carried out in England in 2014.
The largest overall increase in expenditure by region since 2013 was in London, which rose by £490 million (37%) in current prices from the 2013 estimate of £1.3 billion. West Midlands also showed an increase in expenditure of 16% in current prices since 2013, from £1.7 billion to £2.0 billion in 2014. South West, Wales and Yorkshire and The Humber also showed increases of 11%, 8% and 8% respectively in R&D expenditure in 2014 compared with 2013.
The largest overall decrease in expenditure by region since 2013 was in Northern Ireland, which fell by £82 million (19%) in current prices from the 2013 estimate of £434 million. The change in R&D expenditure in Northern Ireland is the result of several factors, including revisions to reported data, relocation of R&D performance or R&D projects reaching maturity resulting in the R&D work for companies coming to a natural conclusion. The latter can have a large impact on annual Northern Ireland R&D estimates particularly where larger companies have concluded a significant R&D project.
Map 2: Employment in UK businesses on performing R&D, by country or region, 2014
Source: Office for National Statistics
Download this image Map 2: Employment in UK businesses on performing R&D, by country or region, 2014
.png (327.8 kB)
10. Sources of funds for expenditure on R&D performed in UK businesses
The largest source of R&D funding in 2014 was businesses’ own funds at £13.7 billion, which increased by £1.0 billion (8%) on the 2013 estimate of £12.7 billion. Businesses’ own funds accounted for 69% of total business R&D expenditure in 2014 compared with the 2013 estimate of 68%.
Overseas funding of UK businesses’ R&D was £3.8 billion in 2014, as it was in 2013. This accounted for 19% of total expenditure by UK businesses on performing R&D in 2014, compared with the 2013 estimate of 20% (Figure 7).
Figure 7: Sources of funds for expenditure by UK businesses on performing R&D, 1990 to 2014
Source: Office for National Statistics
Download this chart Figure 7: Sources of funds for expenditure by UK businesses on performing R&D, 1990 to 2014
Image .csv .xlsThe UK government’s funding of businesses’ R&D in 2014 was £1.9 billion, an increase of £55 million (3%) in current prices from the 2013 estimate of £1.8 billion. This represented 9% of total business R&D expenditure. UK government funding was mostly in the defence sector (£1.1 billion), which made up 57% of government funding of business R&D expenditure. This includes government-awarded contracts to UK businesses to develop aircraft, naval ships, submarines and their systems and equipment.
Back to table of contents11. Ownership of businesses performing R&D in the UK
In 1993, when the BERD survey began on an annual basis, 73% of UK business R&D expenditure was by UK-owned businesses and 27% by foreign-owned businesses. The majority of UK business R&D expenditure continued to be performed by UK-owned businesses until 2011, when for the first time, just over half (51%) of business R&D expenditure in the UK was by foreign-owned businesses. This pattern of ownership continued in 2012 and 2013 with 52% and 54% respectively. In 2014, expenditure on R&D in the UK by UK-owned businesses increased by 11% from 2013. Expenditure on R&D in the UK by foreign-owned businesses increased by 2% and now constitutes 52% of total expenditure in 2014, a slight decrease from the 54% estimate in 2013 (Figure 8).
On 15 March 2013, we published R&D expenditure by foreign owned businesses, which contained more detailed analysis of the pattern of ownership of businesses that performed R&D between 1995 and 2011. This was based on the estimates that had been included in the 2011 BERD statistical bulletin. It should be noted that the original 2011 estimate of the proportion of R&D expenditure by foreign-owned businesses has been revised upwards from 50% to 51%.
Figure 8: Ownership of businesses who perform R&D in the UK, 1993 to 2014
Source: Office for National Statistics
Download this chart Figure 8: Ownership of businesses who perform R&D in the UK, 1993 to 2014
Image .csv .xls12. International comparison
When comparing total business R&D intensity across countries, it is important to take into account differences in industrial structure. The Organisation for Economic Co-operation and Development (OECD) produces a Science, Technology and Industry Scoreboard to facilitate these comparisons.
In March 2012, as part of a publication ”The UK R&D Landscape”, it was reported that “the business enterprise component of R&D expenditure in the UK is low by international standards, even after adjusting for structural difference between countries. It is also concentrated in the hands of a few very large firms and the small number of industrial sectors in which they are based”.
Back to table of contents