1. Main points
In 2014 the value of UK manufacturers’ product sales was £362.3 billion, a 2.2% increase on the 2013 estimate of £354.5 billion
UK manufacturers’ product sales were 20.8% higher in 2014 than in 2009
The manufacture of food products industry contributed most to UK manufacturers’ product sales in 2014, at £66.8 billion, while the manufacture of machinery and equipment not elsewhere classified contributed the most to growth since 2013, at 22.9%
Motor vehicles with a medium or large petrol engine had the largest value of product sales in 2014, at £12.8 billion
In 2012, the most recent year with comparable EU data, 5 EU countries, including the UK, accounted for 69.7% of the share of total value of EU manufacturers’ product sales
2. Your views matter
We continuously aim to improve this release and its associated commentary. We would welcome any feedback you might have and, to help ensure our statistics remain relevant, we would like to know how you make use of these estimates.
In particular we welcome any comments or feedback on new or revised outputs including the:
revised format of the excel reference tables (6.24 Mb Excel sheet)
Background note 1 has further information on these outputs. Please provide comments via email: prodcompublications@ons.gov.uk or telephone William Barnes on +44 (0)1633 455711.
Back to table of contents3. Summary
UK manufacturers reported a fifth consecutive year of growth in the value of product sales in 2014, continuing the recovery seen since 2009. The industrial divisions that have contributed to most growth in the value of product sales are the manufacture of machinery and equipment not elsewhere classified, the manufacture of fabricated metal products, the manufacture of food products and the manufacture of motor vehicles, trailers and semi-trailers. The top 10 products manufactured in the UK include petrol and diesel motor vehicles, parts for civil aircraft and the manufacture, installation and repair of military aircraft.
This statistical bulletin and associated data provide provisional estimates for UK manufacturers’ product sales in 2014. All European Union (EU) Member States carry out annual PRODCOM surveys under EU regulation to enable comparisons and, where possible, produce a picture of emerging developments of an industry or product in a European context.
All estimates of the value of sales are reported at current prices, meaning they have not been adjusted for inflation. Due to an update of the Standard Industrial Classification (SIC), estimates prior to 2008 are not directly comparable with those after 2008 (background note 2 has more information). Estimates in this release are provisional and therefore subject to revisions as described in background note 5.
ONS makes every effort to provide informative commentary on the data in this release. Where possible the commentary draws on evidence from businesses or other reputable sources of information to help explain possible reasons behind the observed changes. However in some instances it can prove difficult to establish detailed reasons for movements, for example, businesses may state a “change in the production strategy” or “products being made under a new contract order”. Consequently it is not possible for all data movements to be fully explained.
Back to table of contents4. UK manufacturers’ sales by product 2014
In 2014, the value of UK manufacturers’ product sales was £362.3 billion, a 2.2% increase on the 2013 estimate of £354.5 billion. This is the fifth annual increase with growth since 2009, in current prices, of 20.8%.
The fall between 2008 and 2009 of nearly 10% in the value of product sales and the subsequent recovery is broadly in line with movements reported in other data sources such as the Annual Business Survey and National Accounts.
Figure 1: Total value of UK Manufacturers’ Product Sales, 2003 to 2014
Source: Office for National Statistics
Notes:
- Care should be taken when comparing estimates prior to 2008 with those after 2008 due to an industry reclassification.
Download this chart Figure 1: Total value of UK Manufacturers’ Product Sales, 2003 to 2014
Image .csv .xls5. Results by industrial division
The UK manufacturers’ sales by product cover 25 industrial divisions (background note 7 has more details on coverage). PRODCOM estimates can be interpreted in 2 ways; in terms of businesses classified to an industry and in terms of products corresponding to an industry. In this release, product information, either individual products or total product sales, relate to products corresponding to an industry irrespective of which industry the business making the product is classified to.
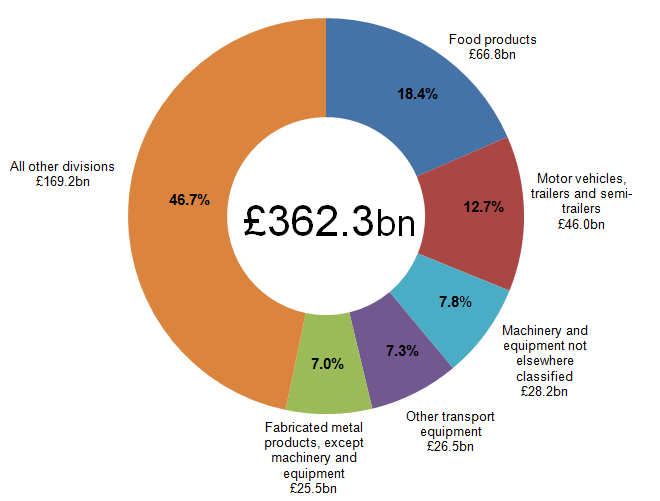
Figure 2 illustrates that in 2014, the value of product sales of the 5 largest divisions accounted for over half (53.3%) of the estimated value of £362.3 billion total UK manufacturers’ product sales. At the start of the economic downturn in 2008, the 5 largest industrial divisions had a 46.1% share of sales.
Food manufacturing accounted for almost a fifth (18.4%) of total product sales at £66.8 billion, making it the largest industrial division with regard to product sales. In 2008 the share of food manufacturing was 17.4%.
The manufacture of motor vehicles, trailers and semi trailers was the second largest division, with product sales of £46.0 billion; 12.7% of total UK manufacturers’ sales. These 2 divisions alone make up almost a third (31.1%) of product sales in the UK.
Figure 2: Contribution of 5 largest divisions to total UK manufacturers' product sales, 2014
Source: Office for National Statistics
Download this image Figure 2: Contribution of 5 largest divisions to total UK manufacturers' product sales, 2014
.png (24.0 kB) .xls (27.1 kB)Divisions’ contribution to growth
Table 1 shows the contribution to growth between 2013 and 2014 by industrial division. Of the 25 industrial divisions 18 experienced growth year-on-year, with the largest positive contribution to total growth coming from the manufacture of machinery and equipment not elsewhere classified (22.9%). In contrast, the manufacture of other transport equipment provided the largest negative contribution to growth (negative 12.0%) over the same period.
Table 1: Contribution to total value of product sale growth by industry, 2013 to 2014
| Division | Percentage contribution to growth |
| Manufacture of machinery and equipment n.e.c. | 22.9 |
| Manufacture of fabricated metal products, except machinery and equipment | 14.7 |
| Manufacture of food products | 14.5 |
| Manufacture of motor vehicles, trailers and semi-trailers | 13.0 |
| Manufacture of rubber and plastic products | 10.3 |
| Printing and reproduction of recorded media | 7.0 |
| Other manufacturing | 5.6 |
| Manufacture of computer, electronic and optical products | 5.5 |
| Manufacture of other non-metallic mineral products | 5.0 |
| Manufacture of beverages | 4.9 |
| Manufacture of paper and paper products | 4.5 |
| Manufacture of textiles | 4.2 |
| Manufacture of wood and of products of wood and cork, except furniture; manufacture of articles of straw and plaiting materials | 2.9 |
| Manufacture of furniture | 2.2 |
| Manufacture of tobacco products | 1.4 |
| Repair and installation of machinery and equipment | 0.7 |
| Manufacture of electrical equipment | 0.6 |
| Manufacture of leather and related products | 0.1 |
| Manufacture of wearing apparel | 0.0 |
| Other mining and quarrying | 0.0 |
| Manufacture of coke and refined petroleum products | -0.1 |
| Manufacture of basic pharmaceutical products and pharmaceutical preparations | -1.0 |
| Manufacture of chemicals and chemical products | -2.8 |
| Manufacture of basic metals | -4.2 |
| Manufacture of other transport equipment | -12.0 |
| Source: Office for National Statistics | |
Download this table Table 1: Contribution to total value of product sale growth by industry, 2013 to 2014
.xls (56.3 kB)Divisions driving growth in overall UK manufacturers’ product sales
The largest contribution to growth is from the manufacture of products classified to:
machinery and equipment not elsewhere classified (Division 28)
fabricated metal products (Division 25)
food products (Division 10)
Machinery and equipment not elsewhere classified
The growth experienced by products in the machinery and equipment division not elsewhere classified, is largely the result of increased sales of high value products such as dumpers for off highway use which saw a £186.0 million (33.3%) increase in sales, as well as wheeled loaders and parts for diesel or semi diesel engines, at £97.7 million (23.4%) and £104.9 million (17.7%) respectively.
Fabricated metal products
Within the manufacture of fabricated metal products, sales of doors and windows of metal increased for the fourth year running, with manufacturers’ sales of both aluminium and iron/steel doors, thresholds, windows and frames increasing by £93.5 million (9.8%) and £43.8 million (11.4%) respectively since 2013.
Food products
The growth in sales of food products in 2014 was, in part, the result of positive sales for operation of dairies and cheese making, with some pre packaged milk and cream products having seen a notable increase, particularly in volume sold. The manufacture of ice cream also saw growth for the fourth year in a row, with increased sales of almost £90 million (14.0%) year-on-year.
Divisions restricting growth in overall UK manufacturers’ product sales
The growth in overall UK manufacturers’ product sales has been restricted by falls in the value of product sales in:
other transport equipment (Division 30)
manufacture of basic metals (Division 24)
Other transport equipment
A reduction in sales from the manufacture of pleasure and sporting boats by £70.4 million (down 9.5% from 2013) is partly responsible for the negative growth for other transport equipment. Additionally, railway locomotive and rolling stock sales fell considerably year-on-year, with sales of self propelled railway or tramway coaches, vans or trucks decreasing by over £240 million (a fall of 31.5%) since 2013.
Manufacture of basic metals
Another division that contracted between 2013 and 2014 was the manufacture of basic metals, a reduction of £327 million (negative 4.8%) in product sales. Specific industry products within this division that reported reductions in product sales included production of precious metals by £67.7 million (negative18.3%) and the production of copper by £108.2 million (negative 18.8%).
Back to table of contents6. Results by product
Table 2 shows the top 10 products with the highest sales value for 2014 and the percentage change and the change in rankings from 2013.
Table 2: Top 10 products with highest sales value, 2013 to 2014
| Product description | Sales value (billion) | % change | Top 10 ranking | ||
| 2013 | 2014 | 2013 | 2014 | ||
| Motor vehicles with petrol engines greater than 1500cc | £13.75 | £12.79 | -7.02 | 1 | 1 |
| Motor vehicles with diesel or semi diesel engines between 1500cc and 2500cc | £10.21 | £11.13 | 8.91 | 2 | 2 |
| Parts for all types of aircraft, for civil use | £7.59 | £8.45 | 11.27 | 3 | 3 |
| Military aircraft and parts manufacture, installation and repair | £7.47 | £6.07 | -18.73 | 4 | 4 |
| Medicaments excl. Antibiotics, hormones, steroids, alkaloids and vitamins | £5.94 | £5.65 | -4.83 | 5 | 5 |
| Soft drinks and flavoured waters | £3.44 | £3.63 | 5.69 | 7 | 6 |
| Civil aircraft and engines repair and maintenance | £3.52 | £3.61 | 2.55 | 6 | 7 |
| Beer made from malt | £3.25 | £3.38 | 4.19 | 8 | 8 |
| Whisky | £3.15 | £3.25 | 3.23 | 9 | 9 |
| Military vessels and parts manufacture, installation and repair | £3.10 | £3.18 | 2.56 | 10 | 10 |
| Source: Office for National Statistics | |||||
Download this table Table 2: Top 10 products with highest sales value, 2013 to 2014
.xls (34.3 kB)The top 10 products remained unchanged between 2013 and 2014 with only 2 products changing ranking. There are 8 core products that have consistently been in the top 10 since 2008 which makes the list very stable over the last 7 years. The products include petrol and diesel motor vehicles, beer, soft drinks, medicaments and the manufacture and repair of aircraft.
As illustrated in Figure 3, there are however changes in the value of sales of these products with 7 products increasing and 3 decreasing.
Figure 3: Percentage change in sales value of Top 10 products, 2013 to 2014
Source: Office for National Statistics
Notes:
- Product relates to level 3 as specified within the PRODCOM list.
Download this chart Figure 3: Percentage change in sales value of Top 10 products, 2013 to 2014
Image .csv .xlsMotor vehicles
Products within this category include motor vehicles with:
petrol engine greater than 1500cc
diesel engine between 1500cc and 2500cc
Estimates for 2014 show mixed fortunes for the motor industry, with the value of sales of petrol engine vehicles with a medium or large sized engine dropping by almost £1 billion (negative 7.0%) since 2013 to £12.8 billion. Conversely, sales of diesel engine cars between 1500cc and 2500cc increased by a similar amount (£910 million or 8.9%) in 2014 to £11.1 billion. Sales of small petrol engine cars (below 1500cc), which are outside the top 10 products, saw a marked increase in 2014, with volume more than doubling and sales increasing.
In 2014 the UK car industry is reported by the Society of Motor Manufacturers and Traders (SMMT) to have had its best year in new car sales in 9 years. Influencing factors suggested by SMMT include increased investment, a growing domestic market and global demand for UK high quality built vehicles and automotive engineering.
Additional information:
Aerospace and defence
Products in the aerospace and defence division which are within the top 10 products in 2014 were:
parts for all types of aircraft, for civil use
manufacture, installation and repair of military aircraft and parts thereof
repair and maintenance of civil aircraft and civil aircraft engines
manufacture, installation and repair of military vessels and parts thereof
The importance of the aerospace and defence industry to the UK economy is highlighted with 4 products remaining in the top 10 in 2014. Three of these products have consistently been in the top 10 since 2008. The manufacture of parts for all types of civil aircraft had the highest value of product sales within this division with sales increasing 11.3% from 2013, to £8.4 billion in 2014. Civil aircraft and engines repair and maintenance and military vessels and parts manufacture, installation and repair, both had a 2.6% year-on-year growth. There was a reduction in sales for the manufacture, installation and repair of military aircraft in 2014 of 18.7% from the £7.5 billion reported in 2013.
Find out more about the UK aerospace industry in the ONS short story “What does the UK aerospace industry look like today?” published in 2014. Additional information:
ONS Business R&D (BERD) survey reported that UK aerospace R&D expenditure was worth £1.7 billion
Medicaments
Results show a period of contracting sales for medicaments between 2013 and 2014, with a reduction in the value of sales of £286 million (negative 4.8%) year-on-year for other medicaments of mixed or unmixed products, packaged for retail sale, not elsewhere classified.
Drinks
The drinks industry has seen steady growth in 2014, with the top 3 drinks products each seeing increases in value of sales in excess of £100 million since 2013. Products in the drinks industry which have almost always been within the top 10 rankings since 2010 include:
soft drinks
beer
whisky
The value of product sales of soft drinks increased between 2013 and 2014 by just under £200 million (5.7%) taking it into sixth position in the top 10 products, while beer and whisky sales went up by £136.0 million (4.2%) and £101.9 million (3.2%) respectively, cementing their places among the top products. The growing demand for Scotch whisky from emerging markets such as the Middle East, China and South East Asia, has been mentioned by the Scottish Government as an incentive for growth.
Additional information:
Back to table of contents7. European comparison
The PRODCOM survey on production of manufactured goods is carried out annually by all EU Member States, under EU regulation, to enable comparison and, where possible, produce a picture of emerging developments in an industry or product, in a European context.
In 2012, the most recent year with comparable data, 5 EU countries, including the UK, accounted for 69.7% of the share of EU total value of manufacturers’ product sales. The UK contributed between 5.0% and 10.0% of total EU manufacturers’ product sales, behind Germany, France and Italy.
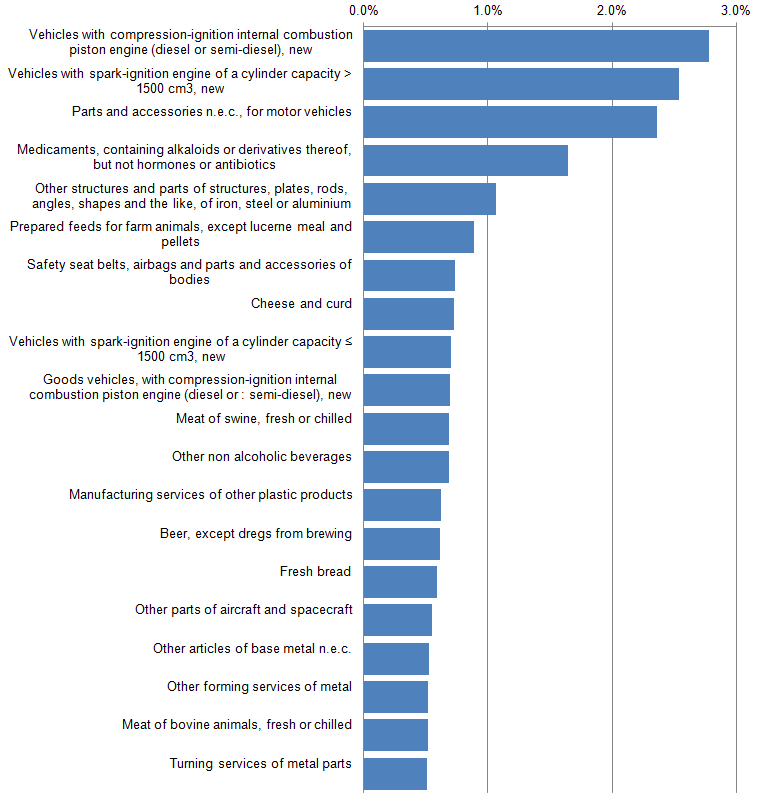
Figure 4 shows the share of EU27 total of top 20 products at CPA level by value of sold production. There were 5 CPA product groups that have a share representing more than 1.0% of the total sales value; 4 of the UK top 10 products fall within the EU leading products. These products are motor vehicles with petrol engines greater than 1500cc, motor vehicles with diesel or semi diesel engines between 1500cc and 2500cc, medicaments excluding antibiotics, hormones, steroids, alkaloids and vitamins and beer made from malt.
Figure 4: Percentage EU27 share of top 20 products by value of sales, 2012
Source: Eurostat
Notes:
- Data is based on 2012 estimates which is the most recent comparable data across all EU Member States. 2013 estimates are due to be published in the Autumn 2015.
- Data are not available for Cyprus, Luxembourg and Malta. Acc ording to the terms of the PRODCOM Regulation, these countries are exempt from reporting PRODCOM estimates to Eurostat and zero product sales is recorded for them on all products in the Eurostat total.
- The statistical Classification of Products by Activity (CPA) is the classification of products (goods and services) at the European Union. CPA product categories are related to activities as defined by the statistical classification of economic activities in the European Community (NACE).
Download this image Figure 4: Percentage EU27 share of top 20 products by value of sales, 2012
.png (44.8 kB) .xls (23.0 kB)Additional information:
Back to table of contents