Table of contents
- Key points
- Introduction
- 2010-based principal population projections
- Births, deaths and net migration
- Children, ageing and older people
- People of working age and state pension age
- Variant population projections
- Assumptions underlying the 2010-based projections
- Comparison with previous projections
- Cohort life expectancy
- Comparison with international projections
- Data and further information
- Background notes
- Methodology
1. Key points
The UK population is projected to increase by 4.9 million from an estimated 62.3 million in 2010 to 67.2 million over the ten year period to 2020
Projected natural increase (more births than deaths) accounts for 56 per cent of the projected increase over the next decade
The UK population is projected to increase to 73.2 million over the 25 year period to mid-2035, which is equivalent to an average annual growth rate of 0.6 per cent
The UK population is projected to reach 70 million by mid-2027
The population is projected to continue ageing with the average (median) age rising from 39.7 years in 2010 to 39.9 years in 2020 and 42.2 by 2035
2. Introduction
This bulletin presents the key findings from the 2010-based national population projections. They replace the 2008-based projections published by ONS in October 2009. These projections are produced by the ONS on behalf of the National Statistician and the Registrars General of Scotland and Northern Ireland.
National population projections by age and sex are produced for the UK and its constituent countries every two years. The projections are based on the most recently available mid-year population estimates and a set of underlying demographic assumptions regarding fertility, mortality and migration. They are not forecasts and do not attempt to predict the impact that future government policies, changing economic circumstances or other factors might have on demographic behaviour. For example, government policies on migration and student fees.
The primary purpose of the national projections is to provide an estimate of the future size and age structure of the population of the UK (and of its constituent countries) which is used as a common framework for national planning in a number of different fields. These official sets of projections ensure that the many users of population projections can work on consistent assumptions.
Examples of uses made of the population projections include:
The Office for Budget Responsibility (OBR) use the projections as a key input to their long-term fiscal projections published in the fiscal sustainability report
TheDepartment for Work and Pensions (DWP) use the projections extensively to produce forecasts of expenditure for benefits and pensions and as a key input for analysis on policy areas such as extending working lives
The Department for Education use the projections as the basis for their projections of future school pupil numbers
The national population projections provide the base for other products such as subnational population projections and household projections, which are widely used for resource allocation and planning
Projections become increasingly uncertain the further they are carried forward due to the inherent uncertainty of demographic behaviour. To give users of the projections an indication of this, a number of variant population projections are also available which provide other future scenarios based on alternative assumptions of future fertility, mortality and migration. These provide an indication of the level of uncertainty; they do not represent upper or lower bounds.
This bulletin focuses on the first 25 years of the projections. Longer term projections to 2110 are available on the ONS website for users who require them, but these should be treated with caution as projections become less certain over time. Longer term projections are not considered appropriate for a wide range of uses but have been made available in line with making datasets publicly available under the government’s transparency agenda. For more information on how ONS population projections meet user needs along with information on their fitness for purpose, please see the report on quality and methodology (109.5 Kb Pdf) .
Back to table of contents3. 2010-based principal population projections
The United Kingdom population is projected to increase by 4.9 million to 67.2 million over the 10 year period to 2020. This increase is equivalent to an annual growth rate of 0.8 per cent each year between mid-2010 and mid-2020. The UK population is projected to increase from an estimated 62.3 million in 2010 to 73.2 million in 2035 (Table 1). It is projected that the population of the UK will exceed 70 million by mid-2027.
Table 1: Estimated and projected population of the United Kingdom and constituent countries, 2010 to 2035
| millions | ||||||
| 2010 | 2015 | 2020 | 2025 | 2030 | 2035 | |
| United Kingdom1 | 62.3 | 64.8 | 67.2 | 69.4 | 71.4 | 73.2 |
| England | 52.2 | 54.5 | 56.6 | 58.6 | 60.4 | 62.1 |
| Wales | 3.0 | 3.1 | 3.2 | 3.2 | 3.3 | 3.4 |
| Scotland | 5.2 | 5.4 | 5.5 | 5.6 | 5.7 | 5.8 |
| Northern Ireland | 1.8 | 1.9 | 1.9 | 2.0 | 2.0 | 2.0 |
| Notes: | ||||||
| 1. Figures may not sum due to rounding. | ||||||
Download this table Table 1: Estimated and projected population of the United Kingdom and constituent countries, 2010 to 2035
.xls (29.2 kB)The population of England is projected to increase by 8 per cent by 2020. The population of the other UK countries are also projected to increase, but at a slower rate. Northern Ireland is projected to increase by 6 per cent over the same period, while Scotland and Wales are projected to increase by 5 per cent by 2020.
Back to table of contents4. Births, deaths and net migration
Of the 4.9 million projected increase in the UK population over the next 10 years, some 2.8 million (56 per cent) is a result of projected natural increase (more births than deaths) while the remaining 2.1 million (44 per cent) is the assumed net number of migrants (Table 2). Similarly, of the 10.9 million projected increase in the population by 2035, 5.8 million (53 per cent) is due to projected natural increase and 5.1 million (47 per cent) is due to projected net migration.
Table 2: Projected components of change, United Kingdom, 2010 to 2035
| millions | |||||
| 2010-2015 | 2015-2020 | 2020-2025 | 2025-2030 | 2030-2035 | |
| Population at start | 62.3 | 64.8 | 67.2 | 69.4 | 71.4 |
| Births | 4.2 | 4.2 | 4.1 | 4.0 | 4.0 |
| Deaths | 2.8 | 2.8 | 2.9 | 3.0 | 3.2 |
| Natural change | 1.4 | 1.4 | 1.2 | 1.0 | 0.8 |
| Net migration | 1.1 | 1.0 | 1.0 | 1.0 | 1.0 |
| Total change | 2.5 | 2.4 | 2.2 | 2.0 | 1.8 |
| Population at end | 64.8 | 67.2 | 69.4 | 71.4 | 73.2 |
| Notes: | |||||
| 1. Figures may not sum due to rounding. | |||||
Download this table Table 2: Projected components of change, United Kingdom, 2010 to 2035
.xls (27.1 kB)The projected numbers of future births and deaths are themselves partly dependent on the assumed level of net migration. Because migration is concentrated at young adult ages, the assumed level of net migration affects the projected number of women of childbearing age and hence the projected number of births. Of the 5.8 million natural increase projected between 2010 and 2035, only 3.5 million would occur if net migration were zero (at each and every age) throughout the projection period (Table 3). Thus just over two-thirds of the projected increase in the population over the period 2010 to 2035 is either directly or indirectly due to migration (47 per cent directly attributable to future migration and a further 21 per cent indirectly due to future migration through its effect on natural change).
Table 3: Projected population growth by component, United Kingdom, 2010 to 2035
| millions | |
| Total population increase between 2010 and 2035 | 10.9 |
| Resulting from: | |
| Assumed net migration | 5.1 |
| Natural change assuming zero net migration | 3.5 |
| Additional natural change from assumed level of net migration | 2.3 |
Download this table Table 3: Projected population growth by component, United Kingdom, 2010 to 2035
.xls (32.8 kB)5. Children, ageing and older people
Over the 25 year period to 2035, the number of children aged under 16 is projected to increase from 11.6 million in 2010 to 13.3 million in 2026 before decreasing slightly to 13.0 million in 2035 (Table 4).
Table 4: Projected population by age, United Kingdom, 2010 to 2035
| millions | ||||||
| Ages | 2010 | 2015 | 2020 | 2025 | 2030 | 2035 |
| 0-14 | 10.9 | 11.5 | 12.2 | 12.5 | 12.3 | 12.1 |
| 15-29 | 12.5 | 12.6 | 12.2 | 12.2 | 12.8 | 13.5 |
| 30-44 | 12.7 | 12.5 | 13.2 | 14.0 | 14.1 | 13.7 |
| 45-59 | 12.1 | 13.0 | 13.2 | 12.5 | 12.3 | 13.0 |
| 60-74 | 9.2 | 9.7 | 10.3 | 10.9 | 11.8 | 12.0 |
| 75 and over | 4.9 | 5.4 | 6.1 | 7.3 | 8.1 | 8.9 |
| 75-84 | 3.5 | 3.8 | 4.2 | 5.0 | 5.3 | 5.4 |
| 85 and over | 1.4 | 1.6 | 1.9 | 2.3 | 2.8 | 3.5 |
| All ages | 62.3 | 64.8 | 67.2 | 69.4 | 71.4 | 73.2 |
| Median age (years) | 39.7 | 39.9 | 39.9 | 40.5 | 41.4 | 42.2 |
| Under 16 | 11.6 | 12.2 | 13.0 | 13.3 | 13.1 | 13.0 |
| Working age1 | 38.5 | 40.1 | 41.6 | 42.7 | 43.6 | 44.7 |
| Pensionable age1 | 12.2 | 12.5 | 12.7 | 13.4 | 14.6 | 15.6 |
| Old age support ratio1 (working age/pensionable age) | 3.16 | 3.22 | 3.28 | 3.19 | 2.98 | 2.87 |
| Notes: | ||||||
| 1. Working age and pensionable age populations based on state pension age for given year. Between 2010 and 2020, state pension age will change from 65 years for men and 60 years for women, to 65 years for both sexes. Between 2024 and 2046, state pension age will increase in three stages from 65 years to 68 years for both sexes. | ||||||
Download this table Table 4: Projected population by age, United Kingdom, 2010 to 2035
.xls (30.7 kB)The population is projected to become older gradually, with the average (median) age rising from 39.7 years in 2010 to 39.9 years in 2020 and 42.2 years by 2035.
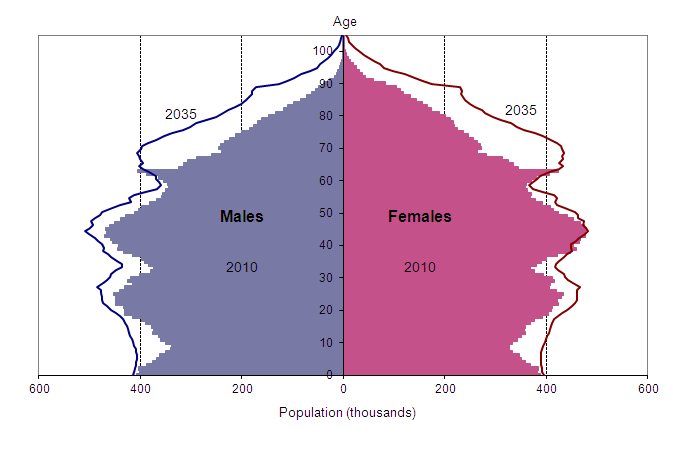
As the population ages, the numbers in the oldest age groups will increase the fastest (Table 4, Figures 1 and 2). In 2010, there were 1.4 million people in the UK aged 85 and over; this number is projected to increase to 1.9 million by 2020 and to 3.5 million by 2035, more than doubling over 25 years.
Figure 1: Estimated and projected age structure of the United Kingdom population, mid-2010 and mid-2035

Download this image Figure 1: Estimated and projected age structure of the United Kingdom population, mid-2010 and mid-2035
.png (22.7 kB) .xls (37.9 kB)The number of people aged 90 and above is projected to more than triple by 2035, the number of people age 95 and over is projected to more than quadruple, and the number of centenarians is projected to rise from 13,000 in 2010 to 110,000 in 2035, a more than eightfold increase (Figure 2).
Figure 2: Estimated and projected population aged 85 and over, United Kingdom, 2010 and 2035
Download this chart Figure 2: Estimated and projected population aged 85 and over, United Kingdom, 2010 and 2035
Image .csv .xls6. People of working age and state pension age
Despite the forthcoming increases to state pension age under current legislation (see Background Note 9), the number of people of state pension age (SPA) is projected to increase by 28 per cent from 12.2 million to 15.6 million by 2035 (Table 4). This reflects the higher number of people born immediately after the 2nd World War and also those who were born in the 1960s 'baby boom' reaching state pension age within the 25 year period to 2035.
Over the same period, the number of people of working age is projected to rise by 16 per cent from 38.5 million in 2010 to 44.7 million by 2035. The definition of working age used in this bulletin is people aged between 16 and state pension age. In 2010, there were 0.6 million more people of SPA than children aged under 16; by 2035 this difference is projected to exceed 2.6 million.
There were 3.16 people of working age for every person of SPA in 2010. By 2020, allowing for the change in women's state pension age, this 'old age support ratio' is projected to rise slightly to 3.28. The 'old age support ratio' then fluctuates due to the changes in SPA over that period and will be 2.87 by 2035 (Table 4). Without the planned changes in state pension age, it is projected that the old age support ratio would decline to 2.71 by 2020 and to 2.17 by 2035 (Figure 3) meaning there would be fewer people of working age for every person of SPA. Details of further changes to SPA proposed by the government can be found in background note 9.
Comparison of the principal projection with some of the variant projections which are described in more detail later shows how different scenarios of future net migration will impact upon the old age support ratio (Figure 3).
Figure 3: Estimated and projected old age support ratio, United Kingdom, 2005 to 2035
Notes:
- Old age support ratio defined as number of people of working age per person of SPA. For information on future changes to SPA, see Background Note 9. High and low migration variants assume annual net migration to be 60,000 higher and lower than for the principal projection.
Download this image Figure 3: Estimated and projected old age support ratio, United Kingdom, 2005 to 2035
.gif (5.1 kB)If annual net migration to the UK were to be 60,000 lower than assumed for the principal projection (that is, 140,000), the old age support ratio would fall to 2.79 by 2035 even taking into account the current changes to state pension age. In contrast, if annual net migration to the UK were to be 60,000 higher (that is, 260,000), the old age support ratio would be 2.94 by 2035.
Back to table of contents7. Variant population projections
Projections are uncertain and become increasingly so the further they are carried forward in time. In addition to the principal (or central) projection, variant projections are produced based on alternative, but still plausible, assumptions of future fertility, mortality and net migration. These variant projections are intended to provide an indication of uncertainty; they do not represent upper or lower limits of future demographic behaviour. They do, however, allow users to consider the impact upon the population if future fertility, mortality and migration differ from the assumptions made for the principal projections. Six 'single component' variant projections are available, where only one component of population change is varied from the principal assumptions. In addition, three further variant projections are also available (see Background Note 7):
The 'high population' variant which assumes a combination of high fertility, high life expectancy and high net migration
The 'low population' variant which assumes a combination of low fertility, low life expectancy and low net migration
The 'zero net migration' (or 'natural change only') variant which assumes the same levels of fertility and life expectancy as the principal projection, but that there will be zero net migration (that is, migration inflows and outflows are exactly equal at every age)
By varying the assumptions to their high and low values, all the resulting projected populations would result in an increasing population to 2035. However the rate of increase varies depending on the assumptions made. Details of the principal and variant assumptions are outlined later in this bulletin and are summarised in Table 5.
Varying the fertility assumption to the levels assumed in the high fertility variant would result in an increase to the UK population of 0.6 million more than the principal projection by 2020 while the low fertility variant would see an increase that was about 1.0 million lower than the principal over the same period. By 2035, the UK population according to the high fertility variant would be 1.8 million higher than the principal, while the low fertility variant would result in a population 2.4 million lower than the principal.
Figure 4: Estimated and projected population of the United Kingdom, 2000 to 2035

Download this image Figure 4: Estimated and projected population of the United Kingdom, 2000 to 2035
.gif (6.9 kB)The results of the fertility variants are not symmetric because of non-symmetric assumptions in the variant fertility assumptions in the short-term. This reflects the uncertainty about the likely path of fertility rates over the next few years.
The difference in the population size resulting from the high and low migration variants is 0.7 million higher and lower than the principal respectively in 2020. By 2035 the high and low migration variants differ from the principal by 1.9 million.
The high and low life expectancy variants do not have as great an impact on the projections as the high and low fertility and migration variant assumptions. The difference for high and low life expectancy would be 0.1 million higher and lower than the principal respectively in 2020 and 0.7 million higher and lower over the 25 year period to 2035.
With combinations of the higher or lower assumptions for all components of population change (high population and low population variants), the possible range for total population size is considerably wider, with values 1.3 million above or 1.8 million below the principal by 2020 and 4.5 million above or 5.0 million below the principal by 2035.
Back to table of contents8. Assumptions underlying the 2010-based projections
The 2010-based national population projections are based on the estimated population at the middle of 2010 and a set of demographic assumptions about future fertility, mortality and migration based on analysis of trends and expert advice. The assumptions underlying the 2010-based national population projections are compared with those used for the 2008-based projections in Table 5.
Table 5: Long-term principal assumptions for the 2010-based national population projections compared with assumptions for the 2008-based projections
| United Kingdom | England | Wales | Scotland | Northern Ireland | |
| Fertility - Long-term average number of children per woman | |||||
| 2010-based | 1.84 | 1.85 | 1.85 | 1.70 | 1.95 |
| 2008-based | 1.84 | 1.85 | 1.85 | 1.70 | 1.95 |
| Mortality - Expectation of life at birth in 2035 (years)1 | |||||
| Males 2010-based | 83.3 | 83.6 | 82.8 | 80.9 | 82.4 |
| Males 2008-based | 83.4 | 83.7 | 83.0 | 80.9 | 82.5 |
| Females 2010-based | 87.0 | 87.2 | 86.6 | 85.1 | 86.6 |
| Females 2008-based | 87.1 | 87.3 | 86.8 | 85.4 | 86.8 |
| Net migration2 - Annual long-term assumptions | |||||
| 2010-based | +200,000 | +172,500 | +10,000 | +17,500 | 0 |
| 2008-based | +180,000 | +157,000 | +10,500 | +12,000 | +500 |
| Notes: | |||||
| 1. Expectations of life at birth for 25 years ahead. Note these are period expectations of life based on the mid-year mortality rates assumed for the year 2035 and do not take account of the continuing improvement in mortality projected beyond 2035. Cohort life expectancies at birth in the 2010-based projections, allowing for the assumed further mortality improvement, will be about 10.8 years higher for a boy born in the UK in 2035 and about 10.2 years higher for a girl born in 2035 than the period figures shown in the table based on calendar year life expectancies. | |||||
| 2. Assumed net migration includes international migration and cross-border migration between the four countries of the United Kingdom. | |||||
Download this table Table 5: Long-term principal assumptions for the 2010-based national population projections compared with assumptions for the 2008-based projections
.xls (34.8 kB)Fertility
The long-term assumption of completed family size for the UK for the principal projection is unchanged from the 2008-based projections (1.84 children per woman). The corresponding assumptions for all four constituent countries are also unchanged.
In the short-term, the UK fertility assumption is set to increase from current levels to a high of 2.02 in 2013 before decreasing to the long-term assumption of 1.84 by 2027. These short-term assumptions are very different to those used in the 2008-based projections which assumed a decreasing fertility rate and reached the long-term within five years. The 2010-based assumptions are higher and stay higher for longer reflecting the current relatively high trends in fertility.
Compared with the principal assumptions, the high and low fertility variants assume long-term family sizes of 0.2 children per woman higher or lower (that is, 2.04 and 1.64 children per woman for the UK).
Mortality
The 2010-based projections see a change from the 2008-based projections in terms of improvements in mortality. It has been assumed for the principal projection that over the first 25 years of the projection period (by 2035), annual rates of mortality improvement will converge to a common rate of 1.2 per cent a year for those born in 1939 and after, with those born in the years 1925 to 1938 assumed to experience higher rates of improvement. Conversely, for those born before 1924, annual rates of improvement are assumed to be lower than 1.2 per cent in 2035. Overall, these are the same assumptions for the rates of mortality improvement in the target year as those used in the 2008-based projections (where the target year was 2033) for those born before 1940; for those born in 1940 and later the proposed improvement rates in the target year of 1.2 per cent are higher than the 1.0 per cent assumed in the 2008-based projections.
Projected period life expectancies at birth for the year 2035 are around 0.1 years lower than in the previous projections for males and 0.1 to 0.3 years lower for females. These differences are mainly due to the age-specific mortality rates for 2010 being assumed to be higher and the rates of mortality improvement between 2010 and 2011 assumed to be lower at many ages below 90 compared to those projected for the same period in the 2008-based projections. Over the early years of the projections these counterbalance the assumption of higher rates of mortality improvement at most ages in 2035.
Compared with the principal assumptions, the high and low life expectancy variants assume annual rates of mortality improvement from 2035 to be 1.2 per cent higher or lower (that is, 2.4 per cent and 0.0 per cent for most ages). Thus the variant projections assume life expectancy at birth in 2035 to be 2.3 years higher or lower for males and 1.5 years higher or lower for females.
Migration
The new long-term assumption for net migration to the United Kingdom is +200,000 each year, compared with +180,000 a year in the 2008-based projections. The assumed level of annual net migration to England is 172,500, which is 15,500 higher than for the 2008-based projections but only 1,000 higher than the assumption made for the 2006-based. The assumed levels of annual net migration to Wales and Northern Ireland are 500 lower than for the 2008-based projections, whilst for Scotland the assumed level of net migration is 5,500 higher. These changes reflect the most recent trends in both international migration and cross-border migration between the four countries of the UK.
Compared with the principal assumptions, the high and low migration variants assume long-term annual net migration to the UK to be 60,000 persons higher or lower (that is, +260,000 and +140,000).
Back to table of contents9. Comparison with previous projections
The projected total population of the United Kingdom at 2020 is 0.7 million (1.0 per cent) higher than in the previous (2008-based) projections (Table 6).
The 2008-based projection for mid-2010 was only 40,000 lower than the current estimate of the population at mid-2010, so the increase in the projected population at 2020 is mainly due to the change in the assumptions of mortality, fertility and net migration for the ten-year period. The 2010-based projections assume an extra 0.5 million births and an additional net gain of 0.3 million more migrants countered by 0.1 million more deaths.
The projected populations of England and Scotland in 2020 are slightly higher than for the 2008-based projections (by 1.0 per cent and 1.7 per cent respectively), but the projected populations of Wales and Northern Ireland are broadly similar to those in the 2008-based projections.
Table 6: Comparison of 2010-based and 2008-based principal projections, United Kingdom
| millions | ||||
| Population at mid-2020 | ||||
| 2010-based projections | 2008-based projections | Difference | ||
| millions | % | |||
| United Kingdom | 67.2 | 66.5 | 0.7 | 1.0% |
| England | 56.6 | 56.0 | 0.6 | 1.0% |
| Wales | 3.2 | 3.2 | -0.0 | -0.0% |
| Scotland | 5.5 | 5.4 | 0.1 | 1.7% |
| Northern Ireland | 1.9 | 1.9 | -0.0 | -0.3% |
Download this table Table 6: Comparison of 2010-based and 2008-based principal projections, United Kingdom
.xls (27.1 kB)10. Cohort life expectancy
The tables are based on unsmoothed calendar year mortality rates from 1981 to 2010 and projected mortality rates from the 2010-based national population projections.
Back to table of contents11. Comparison with international projections
In order to compare population projections across Europe, it makes sense to use projections produced by comparable methods such as those produced for the UK and other EU countries by Eurostat. Their most recent projections are 2010-based and were published in May 2011. However, it is useful to be aware of how those data differ to the latest ONS 2010-based projections.
There are differences between the ONS projections methodology and that used by Eurostat. For example, the ONS projections are based on the population estimates at 30 June while the Eurostat projections are based on an estimate of the population at 1 January.
Eurostat use underlying demographic data supplied by ONS to produce their assumptions but they use alternative methods when agreeing their underlying demographic assumptions. ONS assumes constant levels of net migration in the long-term to avoid implying a level of accuracy that is not evidence based. Eurostat apply a convergence methodology for the long-term net migration assumptions. This means they have a decreasing assumption throughout the projection period starting at a level of 197,900 in 2010 decreasing to an assumed level of 193,000 in 2020 and 170,700 in 2035. Eurostat also make slightly different assumptions about future levels of fertility and mortality.
The difference between the base years for ONS and Eurostat projections is 0.3 million (Table 7). By 2020 ONS project the population to be approximately 0.9 million higher than that projected by Eurostat and by 2035 the difference is 1.3 million
Table 7: ONS and Eurostat projected population of the United Kingdom, 2010 to 2035
| millions | ||||||||||||||||||||||||
| 2010 | 2020 | 2035 | ||||||||||||||||||||||
| ONS | 62.3 | 67.2 | 73.2 | |||||||||||||||||||||
| Eurostat | 62.0 | 66.3 | 71.9 | |||||||||||||||||||||
| Difference | 0.3 | 0.9 | 1.3 | |||||||||||||||||||||
Download this table Table 7: ONS and Eurostat projected population of the United Kingdom, 2010 to 2035
.xls (32.8 kB)Note: ONS projections are as at mid-year, Eurostat projections are at 1 January.
Eurostat produce population projections for the countries of the EU. As at 1 January 2010 the estimated resident population of the UK was 62.0 million, with only Germany and France estimated to have more people (Table 8). The population of the EU27 as a whole is projected to increase by 3 per cent over the 10 years to 2020 and by 5 per cent in the 25 year period to 2035. Of the member states, the UK is projected to be the fourth fastest growing population, with only Luxembourg, Cyprus and Ireland projected to grow at a faster rate. Other countries projected to grow at a similar rate to the UK are Belgium and Sweden. By 2035 only Germany is projected to have a larger population than the UK within the EU.
Table 8: Population projections comparison for selected countries in the European Union
| millions | |||||
| 2010 | 2020 | 2035 | % increase to 2020 | % increase to 2035 | |
| EU27 | 501.0 | 514.4 | 524.5 | 3% | 5% |
| Luxembourg | 0.5 | 0.6 | 0.6 | 14% | 29% |
| Cyprus | 0.8 | 0.9 | 1.0 | 10% | 25% |
| Ireland | 4.5 | 4.8 | 5.5 | 8% | 23% |
| UK | 62.0 | 66.3 | 71.9 | 7% | 16% |
| Belgium | 10.8 | 11.6 | 12.5 | 7% | 15% |
| Sweden | 9.3 | 10.1 | 10.7 | 8% | 15% |
| Spain | 46.0 | 48.0 | 50.9 | 4% | 11% |
| France | 64.7 | 67.8 | 71.3 | 5% | 10% |
| Italy | 60.3 | 62.9 | 65.2 | 4% | 8% |
| Denmark | 5.5 | 5.7 | 6.0 | 3% | 8% |
| Finland | 5.4 | 5.6 | 5.7 | 4% | 7% |
| Austria | 8.4 | 8.6 | 8.9 | 3% | 7% |
| Netherlands | 16.6 | 17.2 | 17.7 | 4% | 6% |
| Slovenia | 2.0 | 2.1 | 2.1 | 5% | 5% |
| Greece | 11.3 | 11.5 | 11.6 | 2% | 3% |
| Czech Republic | 10.5 | 10.8 | 10.8 | 3% | 3% |
| Slovakia | 5.4 | 5.6 | 5.5 | 3% | 2% |
| Portugal | 10.6 | 10.7 | 10.8 | 1% | 1% |
| Malta | 0.4 | 0.4 | 0.4 | 1% | -0% |
| Poland | 38.2 | 38.4 | 36.9 | 1% | -3% |
| Hungary | 10.0 | 9.9 | 9.6 | -1% | -4% |
| Estonia | 1.3 | 1.3 | 1.3 | -1% | -6% |
| Germany | 81.7 | 80.1 | 76.5 | -2% | -6% |
| Romania | 21.5 | 21.0 | 19.9 | -2% | -7% |
| Lithuania | 3.3 | 3.2 | 3.0 | -4% | -11% |
| Latvia | 2.2 | 2.1 | 2.0 | -5% | -13% |
| Bulgaria | 7.6 | 7.1 | 6.4 | -6% | -15% |


