Table of contents
- Main points for October to December 2015
- Summary of latest labour market statistics
- Understanding and working with labour market statistics
- Detailed commentary
- Employment
- Public and private sector employment (first published on 16 December 2015)
- Employment by nationality and country of birth, not seasonally adjusted
- Actual hours worked
- Workforce jobs (first published on 16 December 2015)
- Average weekly earnings
- Labour disputes (not seasonally adjusted)
- Unemployment
- Claimant Count (experimental statistics)
- Comparison between unemployment and the Claimant Count
- Economic inactivity
- Young people in the labour market
- Redundancies
- Vacancies
- Main out of work benefits, not seasonally adjusted
- Where to find more information about labour market statistics
- Revisions
- Accuracy of the statistics: estimating and reporting uncertainty
- Other quality information
- Background notes
- Methodology
1. Main points for October to December 2015
There were 31.42 million people in work, 205,000 more than for July to September 2015 and 521,000 more than for a year earlier.
There were 22.98 million people working full-time, 387,000 more than for a year earlier. There were 8.43 million people working part-time, 134,000 more than for a year earlier.
The employment rate (the proportion of people aged from 16 to 64 who were in work) was 74.1%, the highest since comparable records began in 1971.
There were 1.69 million unemployed people (people not in work but seeking and available to work), 60,000 fewer than for July to September 2015 and 172,000 fewer than for a year earlier.
There were 924,000 unemployed men, 116,000 fewer than for a year earlier. There were 766,000 unemployed women, 57,000 fewer than for a year earlier.
The unemployment rate was 5.1%, lower than for a year earlier (5.7%). The unemployment rate is the proportion of the labour force (those in work plus those unemployed) that were unemployed.
There were 8.88 million people aged from 16 to 64 who were economically inactive (not working and not seeking or available to work), 88,000 fewer than for July to September 2015 and 172,000 fewer than for a year earlier.
The inactivity rate (the proportion of people aged from 16 to 64 who were economically inactive) was 21.8%, lower than for a year earlier (22.3%) and only slightly higher than the record low of 21.7% last recorded for July to September 1990.
Average weekly earnings for employees in Great Britain increased by 1.9% including bonuses and by 2.0% excluding bonuses compared with a year earlier.
Back to table of contents2. Summary of latest labour market statistics
Table A shows the latest estimates, for October to December 2015, for employment, unemployment and economic inactivity. It shows how these estimates compare with the previous quarter (July to September 2015) and the previous year (October to December 2014). Comparing October to December 2015 with July to September 2015 provides the most robust short-term comparison. Making comparisons with earlier data at Section (ii) has more information.
Table A: Summary of UK labour market statistics for October to December 2015, seasonally adjusted
| Summary of UK labour market statistics for October to December 2015, seasonally adjusted | ||||||
| Number (thousands) | Change on Jul to Sep 2015 | Change on Oct to Dec 2014 | Headline Rate (%) | Change on Jul to Sep 2015 | Change on Oct to Dec 2014 | |
| Employed | 31,417 | 205 | 521 | |||
| Aged 16 to 64 | 30,215 | 172 | 447 | 74.1 | 0.4 | 0.9 |
| Aged 65 and over | 1,201 | 33 | 74 | |||
| Unemployed | 1,690 | -60 | -172 | 5.1 | -0.2 | -0.6 |
| Aged 16 to 64 | 1,671 | -57 | -173 | |||
| Aged 65 and over | 18 | -2 | 1 | |||
| Inactive | 18,996 | -65 | -20 | |||
| Aged 16 to 64 | 8,880 | -88 | -172 | 21.8 | -0.2 | -0.5 |
| Aged 65 and over | 10,116 | 23 | 152 | |||
| Source: Office for National Statistics | ||||||
| Notes: | ||||||
| 1. Calculation of headline employment rate: Number of employed people aged from 16 to 64 divided by the population aged from 16 to 64. Population is the sum of employed plus unemployed plus inactive. | ||||||
| 2. Calculation of headline unemployment rate: Number of unemployed people aged 16 and over divided by the sum of employed people aged 16 and over plus unemployed people aged 16 and over. | ||||||
| 3. Calculation of headline economic inactivity rate: Number of economically inactive people aged from 16 to 64 divided by the population aged from 16 to 64. Population is the sum of employed plus unemployed plus inactive. | ||||||
| 4. Components may not sum exactly to totals due to rounding. | ||||||
Download this table Table A: Summary of UK labour market statistics for October to December 2015, seasonally adjusted
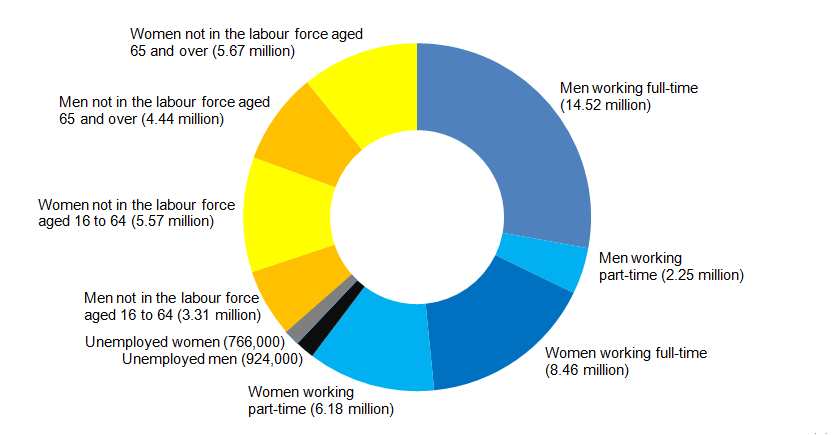
.xls (29.2 kB)Figure A shows a more detailed breakdown of the labour market for October to December 2015.
Figure A: UK labour market for October to December 2015, seasonally adjusted
Source: Labour Force Survey - Office for National Statistics
Download this image Figure A: UK labour market for October to December 2015, seasonally adjusted
.png (37.2 kB) .xls (28.7 kB)
3. Understanding and working with labour market statistics
Where to find explanatory information
Interpreting labour market statistics, available on our website, is designed to help you interpret labour market statistics and highlights some common misunderstandings.
A more detailed Guide to labour market statistics is also available.
A Glossary which explains the terms used within labour market statistics is also available.
About labour market statuses
Everybody aged 16 or over is either employed, unemployed or economically inactive. The employment estimates include all people in work including those working part-time. People not working are classed as unemployed if they have been looking for work within the last 4 weeks and are able to start work within the next 2 weeks. A common misconception is that the unemployment statistics are a count of people on benefits; this is not the case as they include unemployed people not claiming benefits.
Jobless people who have not been looking for work within the last 4 weeks or who are unable to start work within the next 2 weeks are classed as economically inactive. Examples of economically inactive people include people not looking for work because they are students, looking after the family or home, because of illness or disability or because they have retired.
Explaining the concepts of employment, unemployment and economic inactivity is available from the National Archives website as a short video.
Making comparisons with earlier data derived from the Labour Force Survey
Estimates of employment, unemployment, economic inactivity, hours worked and redundancies are derived from the Labour Force Survey (LFS), a survey of households. The most robust estimates of short-term movements in these estimates are obtained by comparing the estimates for October to December 2015 with the estimates for July to September 2015, which were first published on 11 November 2015. This provides a more robust estimate than comparing with the estimates for September to November 2015. This is because the October and November data are included within both estimates, so effectively observed differences are those between the individual months of September and December 2015. The LFS is sampled such that it is representative of the UK population over a 3 month period, not for single month periods.
Accuracy and reliability of survey estimates
Most of the figures in this statistical bulletin come from surveys of households or businesses and are therefore estimates rather than precise figures. Further information is available towards the end of this statistical bulletin in the section Accuracy of the statistics: estimating and reporting uncertainty.
Back to table of contents4. Detailed commentary
This section of the statistical bulletin consists of the following parts.
People in work
Employment
Public and private sector employment
Employment by nationality and country of birth
Actual hours worked
Workforce jobs
Average weekly earnings
Labour disputes
People not in work
Unemployment
Claimant Count (experimental statistics)
Comparison between unemployment and the Claimant Count
Economic inactivity
Other labour market statistics
Young people in the labour market
Redundancies
Vacancies
Main out of work benefits
5. Employment
Introduction
Employment measures the number of people in work and differs from the number of jobs because some people have more than one job. Further information is available at Notes for Employment at the end of this section.
A comparison between estimates of employment and jobs is available on our website.
Commentary
The proportion of people aged from 16 to 64 in work is known as the employment rate. Figure 1.1 shows the employment rate for people aged from 16 to 64 since comparable records began in 1971. The lowest employment rate was 65.6% in 1983, during the economic downturn of the early 1980s. The employment rate has been generally increasing since early 2012 and for the latest time period, October to December 2015, it reached a record high of 74.1%.
Figure 1.1: UK Employment rate (aged 16 to 64), seasonally adjusted
January to March 1971 to October to December 2015
Source: Labour Force Survey - Office for National Statistics
Notes:
- Lowest: Feb-Apr to May-Jul 1983 (65.6%).
- Highest: Oct-Dec 2015 (74.1%).
Download this chart Figure 1.1: UK Employment rate (aged 16 to 64), seasonally adjusted
Image .csv .xlsFigure 1.2 looks in more detail at the employment rate for the last 5 years.
Figure 1.2: UK Employment rate (aged 16 to 64), seasonally adjusted
October to December 2010 to October to December 2015
Source: Labour Force Survey - Office for National Statistics
Download this chart Figure 1.2: UK Employment rate (aged 16 to 64), seasonally adjusted
Image .csv .xlsFor October to December 2015, 74.1% of people aged from 16 to 64 were in work. This was:
higher than for July to September 2015 (73.7%)
higher than for a year earlier (73.2%)
the highest since comparable records began in 1971
Looking at employment rates by sex, for October to December 2015:
79.2% of men and 69.1% of women aged from 16 to 64 were in work
employment rates for both men and women were higher than for July to September 2015 and for a year earlier
the employment rate for men (79.2%) was slightly higher than before the economic downturn of 2008 to 2009, when it peaked at 79.1% in late 2007 to early 2008
the employment rate for women (69.1%) was the joint highest since comparable records began in 1971, partly due to ongoing changes to the state pension age for women resulting in fewer women retiring between the ages of 60 and 65
For October to December 2015, there were 31.42 million people in work, 205,000 more than for July to September 2015 and 521,000 more than for a year earlier.
Figure 1.3 shows how the estimates for full-time and part-time employment by sex for October to December 2015 compare with those for a year earlier.
Figure 1.3: Changes in people in employment in the UK between October to December 2014 and October to December 2015, seasonally adjusted
Source: Labour Force Survey - Office for National Statistics
Download this chart Figure 1.3: Changes in people in employment in the UK between October to December 2014 and October to December 2015, seasonally adjusted
Image .csv .xlsComparing the estimates for type of employment for October to December 2015 with those for a year earlier:
employees increased by 380,000 to 26.56 million
self-employed people increased by 154,000 to 4.66 million
unpaid family workers was little changed at 99,000 (see Note 2 for an explanation of the coverage of this series)
people on government supported training and employment programmes fell by 11,000 to 101,000 (see Note 3 for an explanation of the coverage of this series)
Where to find data about employment
Employment estimates are available at Tables 1 and 3 of the pdf version of this statistical bulletin and at data tables A02 SA (517 Kb Excel sheet) and EMP01 SA (466 Kb Excel sheet).
International comparisons of employment rates are available at Table 19 of the pdf version of this statistical bulletin and at data table A10 (296 Kb Excel sheet).
Estimates for the number of people in employment and for the number of self-employed people back to 1855 (which do not have National Statistics status) have been published by the Bank of England in the spreadsheet Three centuries of data v2.2 (at columns H and N in worksheet 22).
Notes for employment
Employment consists of employees, self-employed people, unpaid family workers and people on government supported training and employment programmes.
Unpaid family workers are people who work in a family business who do not receive a formal wage or salary but benefit from the profits of that business.
The government supported training and employment programmes series does not include all people on these programmes; it only includes people engaging in any form of work, work experience or work-related training who are not included in the employees or self-employed series. People on these programmes NOT engaging in any form of work, work experience or work-related training are not included in the employment estimates; they are classified as unemployed or economically inactive.
6. Public and private sector employment (first published on 16 December 2015)
Introduction
Public sector employment measures the number of people in paid work in the public sector. The public sector comprises central government, local government and public corporations. Estimates of public sector employment are obtained from information provided by public sector organisations.
Private sector employment is estimated as the difference between total employment, sourced from the Labour Force Survey, and public sector employment.
Comparisons of public and private sector employment over time are impacted by changes to the composition of these sectors. For example, if a publicly owned body is privatised, public sector employment will fall and private sector employment will increase by an equivalent amount. This is known as a reclassification effect. At Table 4 of the pdf version of this statistical bulletin and at data table EMP02 (47.5 Kb Excel sheet) we therefore publish estimates of public and private sector employment excluding the effects of major, but not all, reclassifications alongside estimates of total public and private sector employment.
Commentary
There were 5.35 million people employed in the public sector for September 2015. This was:
down 12,000 from June 2015
down 59,000 from a year earlier
the lowest figure since comparable records began in 1999
There were 25.95 million people employed in the private sector for September 2015. This was 219,000 more than for June 2015 and 565,000 more than for a year earlier.
For September 2015, 17.1% of people in employment worked in the public sector (the lowest proportion since comparable records began in 1999) and the remaining 82.9% worked in the private sector.
Figure 2.1 shows public sector employment as a percentage of all people in employment for the last 5 years.
Figure 2.1: UK public sector employment as a percentage of total UK employment, seasonally adjusted
September 2010 to September 2015
Source: Quarterly Public Sector Employment Survey - Office for National Statistics
Notes:
- June 2012: Some educational bodies were reclassified to the private sector.
- December 2013: Royal Mail plc was reclassified to the private sector.
- March 2014: Lloyds Banking Group plc was reclassified to the private sector.
Download this chart Figure 2.1: UK public sector employment as a percentage of total UK employment, seasonally adjusted
Image .csv .xlsThe number of people employed in the public sector has been generally falling since March 2010. Comparisons of public and private sector employment over time are complicated by several large employers moving between the public and private sectors. We therefore publish estimates of public and private sector employment excluding the effects of major reclassifications alongside estimates of total public and private sector employment at Table 4 of the pdf version of this statistical bulletin and at data table EMP02 (47.5 Kb Excel sheet).
Where to find data about public and private sector employment
Public and private sector employment estimates are available at Tables 4 and 4(1) of the pdf version of this statistical bulletin and at data tables EMP02 (47.5 Kb Excel sheet) and EMP03 (56 Kb Excel sheet).
Further information on public sector employment is available in the Public sector employment release.
Back to table of contents7. Employment by nationality and country of birth, not seasonally adjusted
Introduction
The estimates of employment by both nationality and country of birth relate to the number of people in employment rather than the number of jobs. Changes in the series therefore show net changes in the number of people in employment, not the proportion of new jobs that have been filled by UK and non-UK workers. These estimates should not be used as a proxy for flows of foreign migrants into the UK.
The estimates are not seasonally adjusted and it is therefore best practice to compare the estimates for October to December 2015 with those for a year earlier rather than with those for July to September 2015.
Commentary
Looking at the estimates by nationality, between October to December 2014 and October to December 2015:
UK nationals working in the UK increased by 278,000 to 28.28 million
non-UK nationals working in the UK increased by 254,000 to 3.22 million
Looking at changes in non-UK nationals working in the UK between October to December 1997 and October to December 2015:
the number of non-UK nationals working in the UK increased from just over 1 million to 3.22 million
the proportion of all people working in the UK accounted for by non-UK nationals increased from 3.8% to 10.2%
this increase in non-UK nationals working in the UK reflects the admission of several new member states to the European Union (EU)
Looking in more detail at non-UK nationals working in the UK, between October to December 2014 and October to December 2015:
non-UK nationals from the EU working in the UK increased by 215,000 to 2.04 million
non-UK nationals from outside the EU working in the UK increased by 38,000 to 1.18 million
Figure 3.1 shows the number of non-UK nationals from EU and non-EU countries working in the UK from October to December 1997 to October to December 2015.
Figure 3.1: Non-UK nationals working in the UK, not seasonally adjusted
October to December 1997 to October to December 2015
Source: Office for National Statistics
Download this chart Figure 3.1: Non-UK nationals working in the UK, not seasonally adjusted
Image .csv .xlsAs shown in Figure 3.1, since January to March 2009, the number of non-UK nationals from outside the EU working in the UK has been broadly flat but the number of non-UK nationals from EU countries working in the UK has continued to increase.
For October to December 2015, there were 5.06 million people born abroad working in the UK, but the number of non-UK nationals working in the UK was much lower at 3.22 million. This is because the estimates for people born abroad working in the UK include some UK nationals. Looking at the estimates by country of birth, between October to December 2014 and October to December 2015:
UK born people working in the UK increased by 258,000 to 26.42 million
non-UK born people working in the UK increased by 281,000 to 5.06 million
Where to find data about employment by nationality and country of birth
Estimates of employment by nationality and country of birth are available at Table 8 of the pdf version of this statistical bulletin and at data table EMP06 (131.5 Kb Excel sheet).
Back to table of contents8. Actual hours worked
Introduction
Actual hours worked measures the number of hours worked in the economy. Changes in actual hours worked reflect changes in the number of people in employment and the average hours worked by those people.
Commentary
Total hours worked per week were 1.01 billion for October to December 2015. This was:
17.2 million (1.7%) more than for July to September 2015
16.2 million (1.6%) more than for a year earlier
The increase in hours worked per week between July to September 2015 and October to December 2015 reflected an increase of 205,000 in the number of people in work (as explained at Section 1).
For October to December 2015:
people worked, on average, 32.2 hours per week, 0.3 hours more than for July to September 2015 but unchanged compared with a year earlier
people working full-time worked, on average, 37.6 hours per week in their main job, 0.4 hours more than for July to September 2015 but unchanged compared with a year earlier
people working part-time worked, on average, 16.3 hours per week in their main job, little changed compared with July to September 2015 but 0.2 hours more than for a year earlier
Figure 4.1 shows total hours worked and the number of people in work, as indices, for the last 5 years.
Figure 4.1: Total hours worked and number of people in work in the UK, seasonally adjusted
October to December 2010 to October to December 2015
Source: Labour Force Survey - Office for National Statistics
Download this chart Figure 4.1: Total hours worked and number of people in work in the UK, seasonally adjusted
Image .csv .xlsWhere to find data about hours worked
Hours worked estimates are available at Tables 7 and 7(1) of the pdf version of this statistical bulletin and at data tables HOUR01 SA (225 Kb Excel sheet) and HOUR02 SA (585.5 Kb Excel sheet).
Estimates for average weekly hours worked back to 1855 (which do not have National Statistics status) have been published by the Bank of England in the spreadsheet Three centuries of data v2.2 (at column Q in worksheet 22).
Back to table of contents9. Workforce jobs (first published on 16 December 2015)
Introduction
Workforce jobs measures the number of filled jobs in the economy. The estimates are mainly sourced from employer surveys. Workforce jobs is a different concept from employment, which is sourced from the Labour Force Survey, as employment is an estimate of people and some people have more than one job.
A comparison between estimates of employment and jobs is available on our website.
Commentary
For September 2015 there were 33.74 million workforce jobs, 143,000 more than for June 2015 and 415,000 more than for a year earlier. Figure 5.1 shows changes in the number of jobs by industrial sector between September 2014 and September 2015.
Figure 5.1: Changes in the number of jobs in the UK between September 2014 and September 2015, seasonally adjusted
Source: Office for National Statistics
Download this chart Figure 5.1: Changes in the number of jobs in the UK between September 2014 and September 2015, seasonally adjusted
Image .csv .xlsLooking at a longer term comparison, between June 1978 (when comparable records began) and September 2015:
the proportion of jobs accounted for by the manufacturing and mining and quarrying sectors fell from 26.4% to 8.1%
the proportion of jobs accounted for by the services sector increased from 63.2% to 83.1%
While comparable estimates for workforce jobs by industry begin in 1978, some historical information back to 1841, not comparable with the latest estimates, are available from 2011 Census Analysis, 170 years of industry.
Where to find data about workforce jobs
Jobs estimates are available at Tables 5 and 6 of the pdf version of this statistical bulletin and at data tables JOBS01 (57.5 Kb Excel sheet) and JOBS02 (330.5 Kb Excel sheet).
Back to table of contents10. Average weekly earnings
Introduction
Average Weekly Earnings measures money paid to employees in Great Britain in return for work done, before tax and other deductions from pay. The estimates do not include earnings of self-employed people. Estimates are available for both total pay (which includes bonuses) and for regular pay (which excludes bonus payments). Estimates are available in both nominal terms (not adjusted for consumer price inflation) and real terms (adjusted for consumer price inflation). The estimates are not just a measure of pay settlements as they also reflect compositional changes within the workforce. Further information is available at Notes for Earnings at the end of this section.
Commentary
For December 2015 in nominal terms (that is, not adjusted for price inflation):
average regular pay (excluding bonuses) for employees in Great Britain was £465 per week before tax and other deductions from pay, up from £456 per week for a year earlier
average total pay (including bonuses) for employees in Great Britain was £496 per week before tax and other deductions from pay, up from £489 per week for a year earlier
Between October to December 2014 and October to December 2015, in nominal terms, regular pay increased by 2.0%, little changed compared with the growth rate between September to November 2014 and September to November 2015 (1.9%).
Between October to December 2014 and October to December 2015, in nominal terms, total pay increased by 1.9%, lower than the growth rate between September to November 2014 and September to November 2015 (2.1%). This reflects a relatively high single month growth rate for September 2015 (2.1%) dropping out of the latest 3 month average time period and being replaced by a lower single month growth rate for December 2015 (1.5%).
Figure 6.1 compares the annual growth rates for both regular and total pay, in nominal terms, for the last 5 years.
Figure 6.1: Great Britain average earnings annual growth rates, seasonally adjusted
October to December 2010 to October to December 2015
Source: Monthly Wages and Salaries Survey - Office for National Statistics
Download this chart Figure 6.1: Great Britain average earnings annual growth rates, seasonally adjusted
Image .csv .xlsLooking at longer term movements, since comparable records began in 2000 average total pay for employees in Great Britain in nominal terms increased from £311 a week in January 2000 to £496 a week in December 2015; an increase of 59.3%. Over the same period the Consumer Prices Index increased by 39.5%.
Between October to December 2014 and October to December 2015 in real terms (that is, adjusted for consumer price inflation):
regular pay for employees in Great Britain increased by 1.9%
total pay for employees in Great Britain increased by 1.8%
A more detailed analysis of earnings growth in real terms is available at Supplementary Analysis of Average Weekly Earnings.
Where to find data about average weekly earnings
Estimates of average weekly earnings in nominal terms (that is, not adjusted for consumer price inflation) are available at Tables 15, 16 and 17 of the pdf version of this statistical bulletin and at data tables EARN01 (622.5 Kb Excel sheet), EARN02 (552.5 Kb Excel sheet) and EARN03 (630.5 Kb Excel sheet).
Estimates of average weekly earnings in real terms (that is, adjusted for consumer price inflation) are available at Table 18 of the pdf version of this statistical bulletin and at data table X04 (125.5 Kb Excel sheet).
While comparable records for average weekly earnings start in 2000, modelled estimates back to 1963 (which do not have National Statistics status) are available at data table EARN02 (552.5 Kb Excel sheet).
Estimates back to 1750 (which do not have National Statistics status) have been published by the Bank of England in the spreadsheet Three centuries of data v2.2 (at column G in worksheet 21).
Where to find more information about earnings
A supplementary analysis of Average Weekly Earnings which includes estimates of real earnings (that is, adjusted for consumer price inflation) is available on our website.
An article looking at bonus payments was published on 26 August 2015.
The Annual Survey of Hours and Earnings (ASHE), published on 18 November 2015, provides more detailed data for 2015.
Notes for average weekly earnings
The estimates relate to Great Britain and include salaries but not unearned income, benefits in kind or arrears of pay.
As well as pay settlements, the estimates reflect bonuses, changes in the number of paid hours worked and the impact of employees paid at different rates joining and leaving individual businesses. The estimates also reflect changes in the overall structure of the workforce; for example, more low paid jobs in the economy would have a downward effect on the earnings growth rate.
Lloyds Banking Group plc is reclassified to the private sector from April 2014 following the sale of some government owned shares to private sector investors. It is classified to the public sector between July 2009 and March 2014. We estimate that, if the April 2014 reclassification had not occurred, the public sector single month growth rates between April 2014 and March 2015 would have been around 0.3 percentage points higher and the corresponding private sector growth rates would have been around 0.1 percentage points lower.
11. Labour disputes (not seasonally adjusted)
Introduction
The labour disputes estimates measure strikes connected with terms and conditions of employment.
Commentary
In December 2015, there were 9,000 working days lost from 10 stoppages. For the 12 months ending December 2015, there were 170,000 working days lost from 117 stoppages.
Since monthly records began in December 1931:
the highest cumulative 12 month estimate for working days lost was 32.2 million for the 12 months to April 1980
the lowest cumulative 12 month estimate for working days lost was 143,000 for the 12 months to March 2011
Working days lost are at historically low levels when looking at the longer run time series back to the 1930s, available at data table LABD01 (108.5 Kb Excel sheet).
Figure 7.1 shows cumulative 12 month totals for working days lost for the last 5 years.
Figure 7.1: Working days lost in the UK cumulative 12 months totals, not seasonally adjusted
December 2010 to December 2015
Source: Labour Disputes Statistics - Office for National Statistics
Notes:
- The figures from November 2011 to October 2012 and from July 2014 to June 2015 are affected by one day strikes on 30 November 2011 and 10 July 2014 relating to changes to pension schemes and pay for some public sector workers.
Download this chart Figure 7.1: Working days lost in the UK cumulative 12 months totals, not seasonally adjusted
Image .csv .xlsWhere to find data about labour disputes
Labour disputes estimates are available at Table 20 of the pdf version of this statistical bulletin and at data table LABD01 (108.5 Kb Excel sheet).
Where to find more information about labour disputes
An article providing more detailed information was published on 16 July 2015.
Back to table of contents12. Unemployment
Introduction
Unemployment measures people without a job who have been actively seeking work within the last 4 weeks and are available to start work within the next 2 weeks.
The unemployment rate is not the proportion of the total population who are unemployed. It is the proportion of the economically active population (those in work plus those seeking and available to work) who are unemployed. This follows guidelines specified by the International Labour Organisation and it ensures that UK unemployment rates are broadly comparable with those published by other countries.
Commentary
The proportion of economically active people aged 16 and over who are out of work and seeking work is known as the unemployment rate. As shown at Figure 8.1, the lowest unemployment rate recorded since comparable records began in 1971 was 3.4% in late 1973 to early 1974 and the highest rate, 11.9%, was recorded in 1984 during the downturn of the early 1980s. The unemployment rate for the latest time period, October to December 2015, was 5.1%.
Figure 8.1: UK Unemployment rate (aged 16 and over), seasonally adjusted
January to March 1971 to October to December 2015
Source: Labour Force Survey - Office for National Statistics
Notes:
- Lowest: Oct-Dec 1973 & Nov-Jan 1974 (3.4%).
- Highest: Feb-Apr to Apr-Jun 1984 (11.9%).
- Latest: Oct-Dec 2015 (5.1%).
Download this chart Figure 8.1: UK Unemployment rate (aged 16 and over), seasonally adjusted
Image .csv .xlsFigure 8.2 looks in more detail at the unemployment rate for the last 5 years.
Figure 8.2: UK Unemployment rate (aged 16 and over), seasonally adjusted
October to December 2010 to October to December 2015
Source: Labour Force Survey - Office for National Statistics
Download this chart Figure 8.2: UK Unemployment rate (aged 16 and over), seasonally adjusted
Image .csv .xlsThe unemployment rate for those aged 16 and over for October to December 2015 was 5.1%. This was:
down from 5.3% for July to September 2015
down from 5.7% for a year earlier
slightly lower than the pre-downturn trough of 5.2% for late 2007 to early 2008
The last time the unemployment rate was lower than 5.1% was for August to October 2005. For October to December 2015, there were:
1.69 million unemployed people, 60,000 fewer than for July to September 2015 and 172,000 fewer than for a year earlier
924,000 unemployed men, 33,000 fewer than for July to September 2015 and 116,000 fewer than for a year earlier
766,000 unemployed women, 27,000 fewer than for July to September 2015 and 57,000 fewer than for a year earlier
Looking at unemployment by how long people have been out of work and seeking work, for October to December 2015 there were:
950,000 people who had been unemployed for up to 6 months, 26,000 more than for a year earlier
252,000 people who had been unemployed for between 6 and 12 months, 48,000 fewer than for a year earlier
488,000 people who had been unemployed for over 12 months, 150,000 fewer than for a year earlier
Where to find data about unemployment
Unemployment estimates for the UK are available at Table 9 of the pdf version of this statistical bulletin and at data table UNEM01 SA (706 Kb Excel sheet).
Estimates for the unemployment level and rate back to 1870 (which do not have National Statistics status) have been published by the Bank of England in the spreadsheet Three centuries of data v2.2 (at columns P and U in worksheet 22).
International comparisons of unemployment rates are available at Table 19 of the pdf version of this statistical bulletin and at data table A10 (296 Kb Excel sheet).
Back to table of contents13. Claimant Count (experimental statistics)
Introduction
The Claimant Count measures the number of people claiming unemployment related benefits:
between January 1971 (when comparable estimates start) and September 1996 it is an estimate of the number of people who would have claimed unemployment related benefits if Jobseeker's Allowance had existed at that time
between October 1996 and April 2013 the Claimant Count is a count of the number of people claiming Jobseeker’s Allowance (JSA)
between May 2013 and October 2013 the Claimant Count includes all claimants of Universal Credit (including those who were in work) as well as all JSA claimants
from November 2013 the Claimant Count includes all out of work Universal Credit claimants as well as all JSA claimants
Ideally only those Universal Credit claimants who are out of work and required to seek work should be included in the Claimant Count but it is not currently possible to produce estimates on this basis. The Claimant Count therefore currently includes some out of work claimants of Universal Credit who are not required to look for work; for example, due to illness or disability.
The Claimant Count estimates are currently designated as experimental statistics because the Universal Credit estimates are still being developed by the Department for Work and Pensions. However the Claimant Count estimates do provide the best available estimates of the number of people claiming unemployment related benefits in the UK.
The Claimant Count includes people who claim unemployment related benefits but who do not receive payment. For example some claimants will have had their benefits stopped for a limited period of time by Jobcentre Plus. Some people claim JSA in order to receive National Insurance Credits.
Commentary
Figure 9.1 shows the Claimant Count since comparable records began in 1971. It shows that the lowest number of people claiming unemployment related benefits was 422,600 in December 1973 and the highest figure was 3.09 million in July 1986. For the latest month, January 2016, there were 760,200 people claiming unemployment related benefits, the lowest since May 1975.
Figure 9.1: UK Claimant Count, seasonally adjusted
January 1971 to January 2016
Source: Office for National Statistics, Department for Work and Pensions
Notes:
- Lowest: 422,600 (December 1973).
- Highest: 3.09 million (July 1986).
- Latest: 760,200 (January 2016).
Download this chart Figure 9.1: UK Claimant Count, seasonally adjusted
Image .csv .xlsLooking in more detail at the most recent 5 years, Figure 9.2 shows the Claimant Count from January 2011 to January 2016.
Figure 9.2: UK Claimant Count, seasonally adjusted
January 2011 to January 2016
Source: Office for National Statistics, Department for Work and Pensions
Download this chart Figure 9.2: UK Claimant Count, seasonally adjusted
Image .csv .xlsFor January 2016 there were 760,200 people claiming unemployment related benefits. This consisted of:
632,300 people claiming Jobseeker’s Allowance
127,900 people who were out of work and claiming Universal Credit
For January 2016 there were 760,200 people claiming unemployment related benefits. This was:
14,800 fewer than for December 2015
85,400 fewer than for a year earlier
the lowest since May 1975
For January 2016 there were:
482,500 men claiming unemployment related benefits, 12,100 fewer than for December 2015 and 57,600 fewer than for a year earlier
277,700 women claiming unemployment related benefits, 2,700 fewer than for December 2015 and 27,800 fewer than for a year earlier
Where to find data about the Claimant Count
Claimant Count estimates are available at Table 10 of the pdf version of this statistical bulletin and at data table CLA01 (300.5 Kb Excel sheet).
While comparable records start in 1971, some data back to 1881 (which do not have National Statistics status) are available from the “Historic Data” worksheet within data table CLA01 (300.5 Kb Excel sheet).
Back to table of contents14. Comparison between unemployment and the Claimant Count
Unemployment is measured according to internationally accepted guidelines specified by the International Labour Organisation (ILO). Unemployed people in the UK are:
without a job, have actively sought work in the last 4 weeks and are available to start work in the next 2 weeks
out of work, have found a job and are waiting to start it in the next 2 weeks
People who meet these criteria are classified as unemployed irrespective of whether or not they claim Jobseeker’s Allowance (JSA) or other benefits. The estimates are derived from the Labour Force Survey and are published for 3 month average time periods.
The Claimant Count measures the number of people claiming unemployment related benefits. As explained at Section 9 of this statistical bulletin, the Claimant Count estimates are designated as experimental statistics. In this section of the bulletin we compare quarterly movements in unemployment with quarterly movements in the Claimant Count. Some claimants will not be classified as unemployed. For example, people in employment working fewer than 16 hours a week can be eligible to claim JSA depending on their income.
Figure 10.1 and the associated spreadsheet compare quarterly movements in unemployment and the Claimant Count for the same 3 month average time periods. The unemployment estimates shown in this comparison exclude unemployed people in the 16 to 17 and 65 and over age groups as well as unemployed people aged from 18 to 24 in full-time education. This provides a more meaningful comparison with the Claimant Count than total unemployment because people in these population groups are not usually eligible to claim unemployment related benefits.
When 3 month average estimates for the Claimant Count are compared with unemployment estimates for the same time periods and for the same population groups (people aged from 18 to 64 excluding 18 to 24 year olds in full-time education), between July to September 2015 and October to December 2015:
unemployment fell by 53,000
the Claimant Count fell by 6,000
Figure 10.1: Quarterly changes in Unemployment and the Claimant Count for the UK (aged 18 to 64), seasonally adjusted
October to December 2010 to October to December 2015
Source: Office for National Statistics, Department for Work and Pensions
Notes:
- Unemployment estimates are sourced from the Labour Force Survey (a survey of households). The unemployment figures in this chart, and the associated spreadsheet, exclude unemployed people aged from 18 to 24 in full-time education.
- Claimant Count estimates are sourced from administrative data from Jobcentre Plus (part of the Department for Work and Pensions).
Download this chart Figure 10.1: Quarterly changes in Unemployment and the Claimant Count for the UK (aged 18 to 64), seasonally adjusted
Image .csv .xls15. Economic inactivity
Introduction
Economically inactive people are not in employment but do not meet the internationally accepted definition of unemployment because they have not been seeking work within the last 4 weeks and/or they are unable to start work within the next 2 weeks.
Commentary
The proportion of people, aged from 16 to 64, not in work and neither seeking nor available to work is known as the economic inactivity rate. Figure 11.1 shows the economic inactivity rate for people aged from 16 to 64 since comparable records began in 1971.
Figure 11.1 shows that the economic inactivity rate increased during the downturn of the early 1980s reaching a record high of 25.9% in 1983. As the economy improved in the late 1980s, the economic inactivity rate resumed its downward path, reaching a record low of 21.7% in late 1989 and 1990, before the economic downturn of the early 1990s drove it back up again. Following an increase in the economic inactivity rate during the economic downturn of 2008 to 2009, it resumed its generally downward path.
Figure 11.1: UK Economic inactivity rate (aged 16 to 64), seasonally adjusted
January to March 1971 to October to December 2015
Source: Labour Force Survey - Office for National Statistics
Notes:
- Highest: Feb-Apr to Apr-Jun 1983 (25.9%).
- Lowest: Late 1989 and 1990 (21.7%).
- Latest: Oct-Dec 2015 (21.8%).
Download this chart Figure 11.1: UK Economic inactivity rate (aged 16 to 64), seasonally adjusted
Image .csv .xlsFigure 11.2 shows the economic inactivity rate for people for the last 5 years.
Figure 11.2: UK Economic inactivity rate (aged 16 to 64), seasonally adjusted
October to December 2010 to October to December 2015
Source: Labour Force Survey - Office for National Statistics
Download this chart Figure 11.2: UK Economic inactivity rate (aged 16 to 64), seasonally adjusted
Image .csv .xlsSince comparable records began in 1971, the economic inactivity rate for men has been gradually rising while the rate for women has been gradually falling.
The economic inactivity rate for those aged from 16 to 64 for October to December 2015 was 21.8%. This was lower than for a year earlier (22.3%) and only slightly higher than the record low of 21.7% last recorded for July to September 1990.
For October to December 2015, there were 8.88 million people aged from 16 to 64 not in work and neither seeking nor available to work (known as economically inactive). This was:
88,000 fewer than for July to September 2015
172,000 fewer than for a year earlier
the lowest since the 3 months to February 2004
Looking in more detail at the 8.88 million people aged from 16 to 64 who were economically inactive for October to December 2015, the 2 largest categories were students and people looking after the family or home (each of which accounted for just over a quarter of the total):
there were 2.27 million people who were not looking for work because they were studying, 71,000 fewer than for a year earlier
there were 2.23 million people (of which just over 2 million were women) who were not looking for work because they were looking after the family or home, 76,000 fewer than for a year earlier
The third and fourth largest categories were long-term sick (23.2% of the total) and retired (13.0% of the total):
there were 2.06 million people who were not looking for work due to long-term sickness, 36,000 more than for a year earlier
there were 1.16 million people who were not looking for work because they had retired, 123,000 fewer than for a year earlier
As shown in Figure 11.3, which shows the 4 largest categories of economic inactivity for the last 5 years, the number of people younger than 65 in the retired category has been generally falling since late 2011. This is largely due to ongoing changes to the state pension age for women resulting in fewer women retiring between the ages of 60 and 65.
Figure 11.3: Economic inactivity by main category in the UK (aged 16 to 64), seasonally adjusted
October to December 2010 to October to December 2015
Source: Labour Force Survey - Office for National Statistics
Download this chart Figure 11.3: Economic inactivity by main category in the UK (aged 16 to 64), seasonally adjusted
Image .csv .xlsWhere to find data on economic inactivity
Economic inactivity estimates are available at Tables 1 and 13 of the pdf version of this statistical bulletin and at data tables A02 SA (517 Kb Excel sheet) and INAC01 SA (799 Kb Excel sheet).
Back to table of contents16. Young people in the labour market
Introduction
This section looks at people aged from 16 to 24. It is a common misconception that all people in full-time education are classified as economically inactive. This is not the case as people in full-time education are included in the employment estimates if they have a part-time job and are included in the unemployment estimates if they are seeking part-time work.
Commentary
For October to December 2015, for people aged from 16 to 24, there were:
3.96 million people in work (including 975,000 full-time students with part-time jobs)
622,000 unemployed people (including 218,000 full-time students looking for part-time work)
2.63 million economically inactive people, most of whom (2.02 million) were full-time students
Figure 12.1: Young people (aged 16 to 24) in the UK labour market for October to December 2015, seasonally adjusted
Source: Labour Force Survey - Office for National Statistics
Notes:
- FTE = Full-time education.
- The “Not in full-time education” series includes people in part-time education and/or some form of training.
- Most people in full-time education (FTE) were economically inactive and most people not in full-time education (FTE) were in work.
Download this chart Figure 12.1: Young people (aged 16 to 24) in the UK labour market for October to December 2015, seasonally adjusted
Image .csv .xlsFigure 12.2 shows how the latest estimates, for October to December 2015, for employment, unemployment and economic inactivity for people aged from 16 to 24 compare with the previous quarter (July to September 2015) and the previous year (October to December 2014).
Figure 12.2: Changes in the number of young people (aged 16 to 24) in the UK labour market, seasonally adjusted
Source: Labour Force Survey - Office for National Statistics
Download this chart Figure 12.2: Changes in the number of young people (aged 16 to 24) in the UK labour market, seasonally adjusted
Image .csv .xlsFor October to December 2015, the unemployment rate for 16 to 24 year olds was 13.6%, lower than the pre-downturn trough of 13.8% for the 3 months ending February 2008.
The unemployment rate for those aged from 16 to 24 has been consistently higher than that for older age groups. Since comparable records began in 1992:
the lowest youth unemployment rate was 11.6% for March to May 2001
the highest youth unemployment rate was 22.5% for late 2011
Between March to May 1992 (when comparable records began) and October to December 2015 the proportion of young people who were in full-time education increased substantially from 26.2% to 44.6%. This increase in the number of young people going into full-time education has reduced the size of the economically active population (those in work plus those seeking and available to work) and therefore increased the unemployment rate (because the unemployment rate is the proportion of the economically active population who are unemployed).
Where to find data on young people in the labour market
Estimates for young people in the labour market are available at Table 14 of the pdf version of this statistical bulletin and at data table A06 SA (1.04 Mb Excel sheet).
Where to find more information about young people in the labour market
Estimates for young people who were Not in Education, Employment or Training (NEET) for July to September 2015 were published on 19 November 2015. Estimates for October to December 2015 will be published on 25 February 2016.
Back to table of contents17. Redundancies
Introduction
The redundancies estimates measure the number of people who have been made redundant or have taken voluntary redundancy.
Commentary
For October to December 2015, 98,000 people had become redundant in the 3 months before the Labour Force Survey interviews. This was:
13,000 fewer than for July to September 2015
9,000 fewer than for a year earlier
214,000 fewer than the peak of 311,000 recorded for February to April 2009
Figure 13.1 shows the number of people who had become redundant since comparable records began in March to May 1995.
Figure 13.1: Number of redundancies in the UK, seasonally adjusted
March to May 1995 to October to December 2015
Source: Labour Force Survey - Office for National Statistics
Notes:
- Highest: Feb-Apr 2009 (311,000).
- Lowest: Jul-Sep 2014 (91,000).
Download this chart Figure 13.1: Number of redundancies in the UK, seasonally adjusted
Image .csv .xlsWhere to find data on redundancies
Redundancies estimates are available at Tables 23 and 24 of the pdf version of this statistical bulletin and at data tables RED01 SA (69 Kb Excel sheet) and RED02 (2.36 Mb Excel sheet).
Back to table of contents18. Vacancies
Introduction
Vacancies are defined as positions for which employers are actively seeking to recruit outside their business or organisation.
Commentary
There were 776,000 job vacancies for the 3 months to January 2016. This was:
23,000 more than for August to October 2015
45,000 more than for a year earlier
the highest since comparable records began in 2001
Figure 14.1 shows the number of job vacancies since comparable records began in 2001.
Figure 14.1: Number of vacancies in the UK, seasonally adjusted
April to June 2001 to November to January 2016
Source: Vacancy Survey - Office for National Statistics
Notes:
- Lowest: Apr-Jun & May-Jul 2009 (432,000).
- Highest: Nov-Jan 2016 (776,000).
Download this chart Figure 14.1: Number of vacancies in the UK, seasonally adjusted
Image .csv .xlsWhere to find data about vacancies
Vacancies estimates are available at Tables 21, 21(1) and 22 of the pdf version of this statistical bulletin and at data tables VACS01 (304 Kb Excel sheet), VACS02 (377 Kb Excel sheet) and VACS03 (320 Kb Excel sheet).
Back to table of contents19. Main out of work benefits, not seasonally adjusted
Introduction
Main out of work benefits includes claimants of unemployment related benefits and Employment and Support Allowance and other incapacity benefits. It also includes claimants of Income Support and Pension Credit. While most people claiming these benefits are out of work a small number are in employment. These estimates exclude claimants in Northern Ireland.
The estimates are not seasonally adjusted and it is therefore best practice to compare the estimates for August 2015 with those for a year earlier rather than with those for May 2015.
Commentary
For August 2015 there were 3.79 million people claiming main out of work benefits. This was:
229,700 fewer than for a year earlier
the lowest since comparable records began in 1999
For August 2015, 9.5% of the population aged from 16 to 64 were claiming main out of work benefits. This was:
down from 10.1% for a year earlier
the lowest since comparable records began in 1999
Figure 15.1 shows, for the last 5 years, the proportion of the population aged from 16 to 64 claiming main out of work benefits.
Figure 15.1: Proportion of Great Britain population (aged 16 to 64) claiming main out of work benefits, not seasonally adjusted
August 2010 to August 2015
Source: Department for Work and Pensions, Office for National Statistics
Download this chart Figure 15.1: Proportion of Great Britain population (aged 16 to 64) claiming main out of work benefits, not seasonally adjusted
Image .csv .xlsWhere to find data about main out of work benefits
Estimates of claimants of main out of work benefits are available at Table 11 of the pdf version of this statistical bulletin and at data table BEN01 (61 Kb Excel sheet).
Back to table of contents20. Where to find more information about labour market statistics
Other regularly published labour market releases
Regional Labour Market statistics (*)
Young People who were Not in Employment, Education or Training (NEET)
Annual Survey of Hours and Earnings (ASHE)
Business Register and Employment Survey (BRES)
Index of Labour Costs per Hour (ILCH) - Experimental Statistics
(*) Regional and local area statistics are available at NOMIS®
Recently published reports on labour market topics
Working and workless households (6 October 2015)
Contracts with no guaranteed hours (2 September 2015)
Bonus payments in Great Britain (26 August 2015)
Understanding average earnings for the “continuously employed” (18 May 2015)
Workers aged 65 and over in the 2011 Census (25 March 2015)
Participation rates in the UK Labour Market (19 March 2015)
Articles about labour market statistics
The Economic Review, published monthly on our website since 2011, provides economic commentary covering a broad range of economic statistics including labour market statistics.
Articles about labour market statistics were published in Labour Market Trends (up until 2006) and in Economic and Labour Market Review (from 2007 to 2011). Editions of:
Labour Market Trends are available on our website from July 2001 until December 2006 when the publication was discontinued
Economic and Labour Market Review are available on our website from the first edition, published in January 2007, up until the last edition published in May 2011
Published ad hoc data and analysis
Additional statistical data and analyses for labour market statistics that have not been included in our standard publications are available on our website.
Methodological articles
A number of methodological articles about labour market statistics are available on our website.
Back to table of contents21. Revisions
Estimates for the most recent time periods are subject to revision due to the receipt of late and corrected responses to business surveys and revisions to seasonal adjustment factors which are re-estimated every month. Estimates are subject to longer run revisions, on an annual basis, resulting from reviews of the seasonal adjustment process. Estimates derived from the Labour Force Survey (a survey of households) are usually only revised once a year. Revisions to estimates derived from other sources are usually minor and are commented on in the statistical bulletin if this is not the case. Further information is available in the labour market statistics revisions policy (36.7 Kb Pdf).
One indication of the reliability of the main indicators in this statistical bulletin can be obtained by monitoring the size of revisions. Data tables EMP05 (1.49 Mb Excel sheet), UNEM04 (2.23 Mb Excel sheet), JOBS06 (385.5 Kb Excel sheet) and CLA03 (2.22 Mb Excel sheet) record the size and pattern of revisions over the last five years. These indicators only report summary measures for revisions. The revised data itself may be subject to sampling or other sources of error. Our standard presentation is to show 5 years worth of revisions (60 observations for a monthly series, 20 for a quarterly series).
Back to table of contents22. Accuracy of the statistics: estimating and reporting uncertainty
Most of the figures in this statistical bulletin come from surveys of households or businesses. Surveys gather information from a sample rather than from the whole population. The sample is designed to allow for this, and to be as accurate as possible given practical limitations such as time and cost constraints, but results from sample surveys are always estimates, not precise figures. This means that they are subject to some uncertainty. This can have an impact on how changes in the estimates should be interpreted, especially for short-term comparisons.
We can calculate the level of uncertainty (also called “sampling variability”) around a survey estimate by exploring how that estimate would change if we were to draw many survey samples for the same time period instead of just one. This allows us to define a range around the estimate (known as a “confidence interval”) and to state how likely it is in practice that the real value that the survey is trying to measure lies within that range. Confidence intervals are typically set up so that we can be 95% sure that the true value lies within the range – in which case we refer to a “95% confidence interval”.
For example, the unemployment rate for October to December 2015 was estimated to be 5.1%. This figure had a stated 95% confidence interval of +/- 0.2 percentage points. This means that we can be 95% certain that the true unemployment rate for October to December 2015 was between 4.9% and 5.3%. However, the best estimate from the survey was that the unemployment rate was 5.1%.
The number of people unemployed for the same period was estimated at 1,690,000, with a stated 95% confidence interval of +/- 71,000. This means that we can be 95% sure that the true number of unemployed people was between 1,619,000 and 1,761,000. Again, the best estimate from the survey was that the number of unemployed people was 1,690,000.
As well as calculating precision measures around the numbers and rates obtained from the survey, we can also calculate them for changes in the numbers. For example, for October to December 2015, the estimated change in the number of unemployed people since July to September 2015 was a fall of 60,000, with a 95% confidence interval of +/- 79,000. This means that we can be 95% certain the actual change in unemployment was somewhere between an increase of 19,000 and a fall of 139,000, with the best estimate being a fall of 60,000. As the estimated fall in unemployment of 60,000 is smaller than the confidence interval of 79,000, the estimated fall in unemployment is said to be “not statistically significant”.
Working with uncertain estimates
In general, changes in the numbers (and especially the rates) reported in this statistical bulletin between 3 month periods are small, and are not usually greater than the level that is explainable by sampling variability. In practice, this means that small, short-term movements in reported rates (for example within +/- 0.3 percentage points) should be treated as indicative, and considered alongside medium and long-term patterns in the series and corresponding movements in administrative sources, where available, to give a fuller picture.
Seasonal adjustment and uncertainty
Like many economic indicators, the labour market is affected by factors that tend to occur at around the same time every year; for example school leavers entering the labour market in July and whether Easter falls in March or April. In order to compare movements other than annual changes in labour market statistics, such as since the previous quarter or since the previous month, the data are seasonally adjusted to remove the effects of seasonal factors and the arrangement of the calendar. All estimates discussed in this statistical bulletin are seasonally adjusted except where otherwise stated. While seasonal adjustment is essential to allow for robust comparisons through time, it is not possible to estimate uncertainty measures for the seasonally adjusted series.
Where to find data about uncertainty and reliability
Data table A11 (48.5 Kb Excel sheet) shows sampling variabilities for estimates derived from the Labour Force Survey.
Data table JOBS07 (58.5 Kb Excel sheet) shows sampling variabilities for estimates of workforce jobs.
The sampling variability of the 3 month average vacancies level is around +/- 1.5% of that level.
Sampling variability information for Average Weekly Earnings growth rates are available from the “Sampling Variability” worksheets within data tables EARN01 (622.5 Kb Excel sheet) and EARN03 (630.5 Kb Excel sheet).
Back to table of contents