1. Summary
Alongside the public sector finances published in June 2019, we have introduced new supplementary tables that are compliant with the International Monetary Fund’s (IMF) Government Finance Statistics (GFS) framework. This has been done to provide users with a wider view of public sector assets and liabilities in accordance with the recommendation in the IMF’s Fiscal Transparency Evaluation for the UK and as described in HM Treasury’s Managing Fiscal Risks Report.
The core GFS analytic framework is set out in three main statements, all of which we are introducing alongside the public sector finances. These statements are:
statement of operations
statement of other economic flows
balance sheet
This article explains the new data, focusing on both the conceptual and presentational differences to the data published within the monthly UK public sector finances. Importantly, it introduces new aggregates, such as public sector net operating balance and public sector gross debt at both market value and nominal value. These concepts supplement the existing fiscal aggregates, such as public sector net borrowing, public sector net debt and public sector net financial liabilities.
Further work is required to fully align with the GFS framework, as although the underlying concepts between the GFS framework and national accounts framework are the same, their different analytical purposes mean there are some presentational and methodological differences. These differences can be summarised as:
presentational
treatment of employment-related pensions
coverage of public-private partnerships
Alongside the Public sector finances, UK published in October 2019, we incorporated new data on capital stocks, employment-related pensions and extended coverage of public-private partnerships. Future plans include introducing a statement of contingent liabilities and exploring the feasibility of including supplementary statements (for example, expenditure by function; sources and uses of cash).
Back to table of contents2. Introduction
For the purposes of fiscal analysis and management, government departments within the UK produce a range of public finance information. These are usually based on internationally agreed frameworks designed for business accounting or the production of macroeconomic statistics. Two of the latter such frameworks are the United Nations’ national accounts framework and the International Monetary Fund’s (IMF) Government Finance Statistics (GFS) framework. These frameworks are followed, to varying degrees, by the majority of countries in the world, including the UK.
Since the late 1990s, the UK’s fiscal rules and budgeting have been aligned to national accounts concepts and rules. The national accounts framework allows for the production of an integrated set of accounts for the whole economy. Macroeconomic indicators such as gross domestic product (GDP) can be derived, as well as balancing items relevant for fiscal analysis, such as net lending or borrowing.
The GFS framework, while still integrating flows with stocks, focuses on impacts of economic events on the government finances and wider public sector, needed for fiscal analysis. These different uses mean there are some presentational and methodological differences between the two frameworks.
Most countries in the world have their data published in the IMF Yearbook, as does the UK. In our Looking Ahead 2018 publication, we announced our intention to publish data that would be fully compliant with the IMF’s GFS framework. This was also mentioned in HM Treasury’s Managing Fiscal Risks publication (1.3MB). We explained that this would differ from our data included in the IMF Yearbook, as currently we compile public sector finances data in accordance with the European System of Accounts 2010: ESA 2010 and not the Government Finance Statistics Manual 2014: GFSM 2014. We further explained that this would address recommendations from a fiscal transparency evaluation conducted by the IMF in July 2016.
The addition of these supplementary statistics provides users with a wider view of the public sector through:
wider measures of debt in terms of coverage and valuation
bringing together statistics that are published elsewhere (to limited degrees), for example, contingent liabilities and non-financial balance sheet
presenting information currently not included in the public sector finance (PSF) statistics (for example, unfunded pensions, public-private partnerships)
In June 2019, we introduced new supplementary tables compliant with the IMF’s GFS framework in many areas. Specifically, the supplementary tables are compliant with the statement of operations, statement of other economic flows, and balance sheet. Since then we have worked to include employment-related pensions (funded and unfunded) as well as including assets, liabilities and flows related to Public Finance Initiatives recorded on balance sheet in the Whole of Government Accounts. Further improvements will continue into the next year.
Back to table of contents3. Background to the public sector finances
The monthly public sector finance (PSF) statistics are published jointly by the Office for National Statistics (ONS) and HM Treasury. They provide information about the current state of the UK government’s fiscal position and are compiled in accordance with the international statistical guidance in the European System of Accounts 2010: ESA 2010 and the supplementary Manual on Government Deficit and Debt: MGDD (the latest version of which is the MGDD 2016).
The coverage of the PSF statistics is the UK public sector, which is defined according to sector classification decisions made by the ONS in compliance with ESA 2010 and MGDD 2016. Three subsectors are recognised under the UK public sector:
central government
local government
public corporations
PSF statistics are presented both including and excluding the public sector banks, although the UK government’s fiscal framework focuses on the public sector excluding public sector banks. Based on its differing nature to other public corporations, the Bank of England is also reported separately.
Three headline fiscal aggregates are reported each month in the PSF publication, which are presented alongside other information on public sector revenue, such as expenditure; financial account stocks; some flows; and the net cash requirement. The fiscal aggregates are denoted with an “ex” to signify the exclusion of public sector banks and can be summarised as follows:
public sector current budget deficit (PSCB ex): the amount by which current expenditure and depreciation on capital assets together exceed current receipts
public sector net borrowing (PSNB ex): the amount by which total spending (current expenditure plus net investment) exceeds total receipts – commonly referred to as the “deficit”
public sector net debt (PSND ex): comprises the excess of the public sector’s financial liabilities (in the form of loans, debt securities, deposit holdings and currency) over its liquid assets (mainly foreign exchange reserves and cash deposits), with both measured at either face or nominal value
While the PSF statistics are aligned to ESA 2010, some aggregates and presentation of statistics are defined for budgeting or fiscal management purposes of the UK. More specifically, current receipts, current expenditure, PSCB and PSND are not concepts that are defined in ESA 2010 or MGDD 2016. However, the PSF statistics provide users with reconciliations of these aggregates to ESA 2010 or MGDD 2016 aggregates, for example, total revenue, total expenditure and general government gross debt1.
In the 2016 Autumn Statement, the government introduced two supplementary balance sheet fiscal aggregates that provide additional information concerning:
the fiscal impacts of the operations by the Bank of England (BoE) to support the UK economy
the public sector balance sheet
The supplementary fiscal aggregates were published for the first time in the December 2016 PSF bulletin, and comprise:
public sector net debt excluding the Bank of England (PSND ex BoE) – which removes the liquid assets and liabilities held on the BoE’s balance sheet from PSND
public sector net financial liabilities (PSNFL) – a broader fiscal aggregate than PSND, which recognises all public sector financial assets and liabilities recognised by the national accounts
The introduction of these new aggregates was partly driven by recommendations made by the International Monetary Fund (IMF) in their fiscal transparency evaluation of the UK in July 2016 – to increase the coverage of public sector assets and liabilities.
Notes for: Background to the public sector finances
- For more information, see Tables PSA6C and PSA8A in the public sector finances bulletin.
4. International Monetary Fund’s Government Finance Statistics framework
This section provides an overview of the uses and structure of the International Monetary Fund's Government Finance Statistics framework. As well as an explanation of the main differences with the national accounts framework as defined by the European System of Accounts 2010.
4.1. Uses and history of the Government Finance Statistics framework
The manual underpinning the International Monetary Fund’s (IMF) Government Finance Statistics (GFS) framework is the Government Finance Statistics Manual 2014: GFSM 2014, which describes a framework specific to supporting fiscal analysis.
Fiscal policy has two main aspects. In the short-term, the balance between government spending and taxation is generally viewed as having a direct effect on the overall level of economic activity by affecting aggregate demand. In the longer-term, the issue of concern is fiscal sustainability: will a country be able to maintain a level of public spending and meet future obligations on the basis of current and future tax plans? Governments use fiscal statistics to understand both aspects of fiscal policy.
The IMF first introduced guidelines for compiling the GFS in the early 1970s, which applied to reporting as part of the GFS Yearbook. The GFS framework has evolved considerably since its introduction. Under the first published manual, GFSM 1986, transactions were recorded on a cash basis – that is, when cash is received and paid. There was also little harmonisation with other international statistical manuals.
The framework has since changed to record transactions on an accrual basis – when economic value is created, transformed, exchanged, transferred or extinguished. Further improvements have included the introduction of full balance sheet presentations, improved recording or treatment of various types of economic events, harmonisation with other international statistical manuals, and the introduction of further guidance on the compilation of debt statistics.
Although institutional or legal structures of governments will vary across countries, the basic concepts, classifications and definitions within GFSM 2014 are universally applicable to all types of economies. GFSM 2014 therefore supports the compilation of internationally comparable statistics for general government and the broader public sector.
4.2. Structure and features of the Government Finance Statistics framework
Overview
The Government Finance Statistics (GFS) framework is an integrated framework that reports on flows and balance sheets of general government and the wider public sector. Coverage and sectorisation are based on the concept of institutional units, control and distinguishing between market and non-market activity. Flows involve the creation, transformation, exchange, or extinction of economic value.
All flows lead to a change in the value of a unit’s assets, liabilities and ultimately their net worth; where only economic assets are considered. The integration of flows and stock-positions in the framework mean that policy impacts on the net worth of general government or the public sector can be assessed; where net worth is the net position of non-financial and financial assets as well as liabilities.
The core analytic framework is a set of four financial statements, three of which can be combined to show that all changes in stock positions result from flows. These are:
statement of operations
statement of other economic flows
balance sheet
In addition to these, the core framework includes a statement of sources and uses of cash, to provide information on liquidity.
Two additional statements are included for supplementary information:
summary of total changes in net worth
summary statement of explicit contingent liabilities and net implicit obligations for future social security benefits
Figure 1 presents the high-level contents of each statement as well demonstrating the relationship between them. A main principle in the GFS framework is:
Opening Balance Sheet Value + Transactions + Other Economic Flows = Closing Balance Sheet Value
While each of the statements include main balancing items, the GFS framework can be used to derive further fiscal indicators, such as tax burden, fiscal burden, and maturity breakdown of financial instruments.
The remainder of this section provides further information on each statement. For the public sector finances published in June 2019 we have introduced three statements: statement of operations; statement of other economic flows; and the balance sheet.
Figure 1: Government Finance Statistics analytic framework

Source: Office for National Statistics
Download this image Figure 1: Government Finance Statistics analytic framework
.png (38.2 kB) .xlsx (12.1 kB)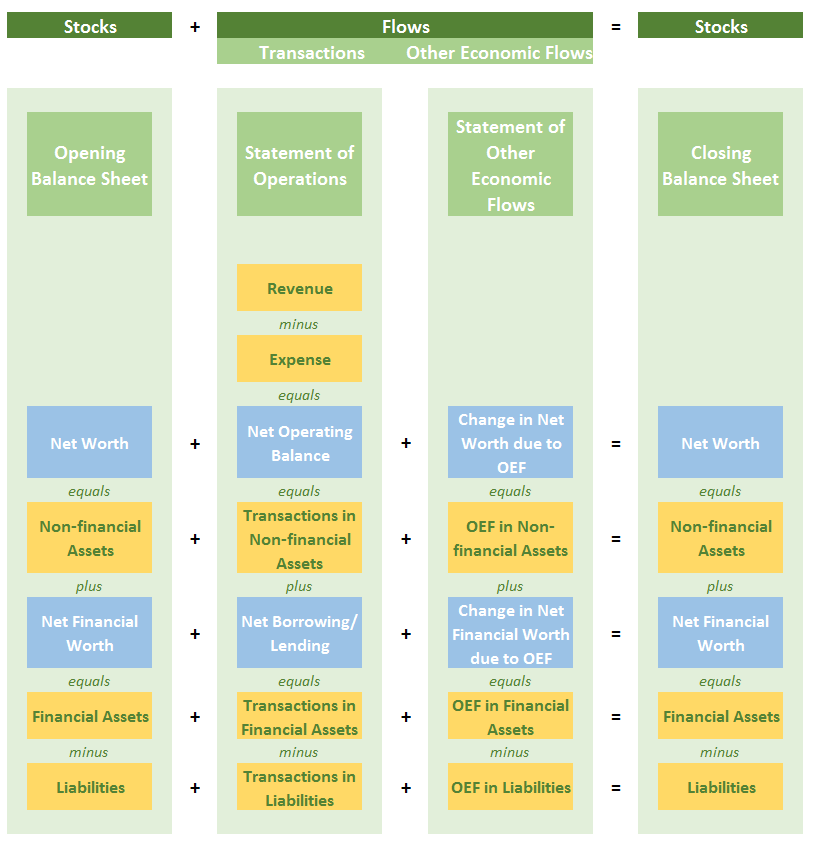
Statement of operations
The statement of operations presents details of transactions in revenue and expense as well as net investment in non-financial assets, the net acquisition of financial assets and the net incurrence of liabilities. Transactions recorded under revenue and expense increase or decrease net worth, where the total change in net worth as a result of transactions is reflected by the “net operating balance”.
Included in the statement is revenue from taxation, social contributions, interest, grants and other revenue, as well as expenses such as compensation of employees, use of goods and services, social benefits, grants and other aspects. Often these revenue and expense items can be directly attributed to government policies or the day-to-day costs of government delivering its services.
In contrast, transactions in non-financial assets (and financial assets and liabilities) are not considered to affect net worth as they involve exchanging one asset, such as cash, for another. Therefore, are not included in the “net operating balance”.
By deducting net transactions in non-financial assets from the “net operating balance” the second main balancing item can be derived – “net lending or borrowing”, which is also equal to net transactions in financial assets and liabilities. Whether the balancing item shows “net borrowing” or “net lending” indicates that the government is financing its deficits or investing its surpluses through financial transactions.
Transactions in financial assets and liabilities are presented by financial instrument; additional or alternative presentations include breakdowns by domestic or external counterpart sectors or whether the financial transaction is policy related or for liquidity purposes.
Statement of other economic flows
The statement of other economic flows presents changes in assets, liabilities, and net worth that are not a result of transactions. They reflect a change in the value or volume of assets or liabilities, and consequently net worth – either because of holding gains and losses or due to other changes in volume.
Holding gains and losses include changes in the value of assets or liabilities caused by changes in price or possibly due to exchange rate revaluations for any assets or liabilities denominated in foreign currency. Other changes in the volume of assets or liabilities are caused by things other than price effects or transactions – including but not limited to effects of external events and changes in classification.
The main balancing item within the statement of other economic flows is the “changes in net worth due to other economic flows” and is available by holding gains or losses and other volume changes. Information is presented at high-level breakdowns of financial instruments and non-financial asset breakdowns.
Balance sheet
The balance sheet presents the stock positions of assets (financial and non-financial) and liabilities at the end of the reporting period. The main balancing item on the balance sheet is “net worth”, which is the total value of assets minus the total value of liabilities.
The change in net worth from one period to the next can be explained by flows – transactions (in revenue and expense) and other economic flows that are presented in the related GFS statements. Net worth can be positive, negative, or zero – a positive value indicates that the stock of assets is greater than the stock of liabilities and the other way around when it is negative. Presented also is “net financial worth”, which is the net position between financial assets and liabilities, and as with net worth, this can be positive, negative or zero.
The general rule under GFSM 2014 is that assets and liabilities should be valued at market value; that is, as if they were acquired in market transactions on the reporting date. However, GFSM 2014 (and the associated Public Sector Debt Statistics 2011: PSDS 2011) encourages the presentation of alternative measures of debt with different valuations and varying coverage of instruments. These are included in the balance sheet as memorandum items and briefly described here.
The broadest, and main, measures of debt in GFSM 2014 are gross debt (D4) and net debt (D4), presented at market value. Gross debt (D4) consists of all liabilities that are debt instruments, that is, liabilities in all financial instruments except equity and investment fund shares; and financial derivatives and employee stock options. Net debt (D4) is calculated as gross debt minus financial assets corresponding to debt instruments.
Gross debt is also presented at nominal value and face value, for which these are most relevant in the valuation of debt securities, for example, bonds issued by the government. Nominal value of an instrument reflects the initial cash or issuance value plus any subsequent flows, such as repayments and interest flows. In contrast, the face value represents the amount to be repaid at maturity, that is, the redemption value.
Additional presentations of debt include debt liabilities at these different valuations with less coverage of instruments – ranging from what is considered full coverage (D4) to minimal coverage (D1) as gross liabilities in debt securities and loans. As well as debt liabilities by domestic or external creditors; short- or long-term maturity.
Table 1: Government Finance Statistics Manual 2014 definitions of gross debt
| Instrument | Gross debt (D4) | D3 debt liabilities | D2 debt liabilities | D1 debt liabilities |
|---|---|---|---|---|
| Special drawing rights | Y | Y | Y | |
| Currency and deposits | Y | Y | Y | |
| Debt securities | Y | Y | Y | Y |
| Loans | Y | Y | Y | Y |
| Equity and investment fund shares | ||||
| Insurance, pensions and standardised guarantee schemes | Y | |||
| Financial derivatives and employee stock options | ||||
| Other accounts payable | Y | Y | ||
| Source: Office for National Statistics | ||||
Download this table Table 1: Government Finance Statistics Manual 2014 definitions of gross debt
.xls (38.9 kB)Statement of sources and uses of cash
Information on the sources and uses of cash1 is important for assessing the liquidity of general government and public corporations. This statement shows the total amount of cash generated or absorbed by current operating activities, transactions in non-financial assets, and transactions involving financial assets and liabilities other than the financial asset currency and deposits (cash) itself. The net change in the stock of cash is the sum of the net cash received from these sources. The statement reflects transactions when using the cash basis of recording; this means transactions captured here are only recorded when cash is paid or received.
The usefulness of the statement of sources and uses of cash is in its assessment of liquidity and analysis alongside the statement of operations. Transactions in the statement of operations are recorded on an accruals basis, therefore, will record revenue or expense for which cash may or not have been received or paid – affecting liquidity needs of government in the future. Similarly, transactions in financial assets or liabilities include components that will be settled in future periods, such as interest accruing from the amortisation of discount or premia on government bonds. Non-monetary transactions are recorded in the statement of operations, so differences between the two statements provide an indication of the size of economic activities not measured in cash.
Statement of total changes in net worth
The statement of total changes in net worth combines the results from the statement of operations for revenue and expense transactions with the statement of other economic flows in one statement. The statement explains the sources of change to net worth; from revenue, expense and other economic flows in assets and liabilities.
Summary statement of explicit contingent liabilities and net implicit obligations for future social security benefits
Contingent liabilities2 are possible obligations that only arise when specific conditions prevail in the future. Therefore, there is uncertainty over whether a payment will be required or not, and its potential size. Contingent liabilities are not recognised in the core accounts and, as such, do not appear in the balance sheet or statement of operations until the event related to their contingency materialises. The type of transaction or balance sheet item recorded at that point will depend on the nature of the event or type of liability.
Though contingent liabilities and other obligations do not affect the net worth of government or the public sector until they materialise, they represent potential future expenditure or revenue. As such, this statement, which records contingent liabilities that are explicit and some that are implicit, provides further information for fiscal analysis.
In GFS, the net implicit obligations for future social security benefits (other than employment-related pension benefits) are not recognised as liabilities as it is not considered there is a contractual liability for the government – that is, there is no direct link between the contributions and the benefits eventually paid.
4.3. Differences with the European System of Accounts 2010
Overview
The national accounts framework and GFS framework share many similarities as both can be considered to provide conceptual and reporting frameworks for measuring flows and stock positions, which can be applied to the general government and public corporations’ sectors. Though ultimately, the analytical purpose of each framework is different.
The GFS framework focuses on the impacts of economic events on the government finances and wider public sector, while the national accounts framework focuses on the economic impacts of the whole economy and interactions between the different sectors. This leads to differences in the reporting focus and presentation of the statistics.
The GFS framework primarily records the operations of general government and public corporations according to revenue, expense, and other transactions in non-financial assets and financial assets and liabilities. These transactions and other economic flows are integrated with balance sheets. The national accounts framework records transactions according to the involvement of sectors in the measurement of production, generation, distribution and the use of income, and capital and financial account transactions. These transactions and other economic flows are integrated with balance sheets.
Each framework is defined by a set of accounts from which main balancing items are derived. In the national accounts’ framework, there is a sequence of seven accounts; other economic flows are presented in two accounts and stock positions are presented in the balance sheet. GFS are mainly presented in four statements, including a cash-flow statement.
The focus of national accounts on different kinds of economic processes and how they relate to different sectors of the economy is maintained through the use of quadruple-entry accounting. Flows and stock positions are recorded in the accounts of two counterpart institutional sectors. However, GFS records transactions from the perspective of general government or public corporations, and as such, primarily uses double-entry accounting.
This section provides information on the main differences between the manuals underpinning each framework – the European System of Accounts 2010: ESA 2010 and the Government Finance Statistics Manual 2014: GFSM 2014. The main differences between the two frameworks relate to presentation and valuation; and the treatment of employment-related pensions. Though not strictly a methodological difference between the two frameworks, the coverage of public-private partnerships and concessions can be interpreted differently. Brief information on other minor methodological differences between the two frameworks is also described.
Presentation and valuation
Presentational differences described here are those that are not a result of differences in the underlying methodology between the two frameworks. These differences largely stem from the different analytical purposes and are useful to be aware of when comparing statistics between the two frameworks. They can be summarised as:
classification of transactions
consolidation
debt and valuation
Transactions under ESA 2010 are categorised according to whether they are in products, distributive, or financial. Transactions in products describe the origin and use of products in the economy, while distributive transactions describe how value added generated by production is distributed to labour, capital and government, as well as the redistribution of income and wealth. These transactions are recorded in different accounts that represent different economic processes.
By contrast, GFSM 2014 revenue transactions are presented according to their economic nature, while transactions in expenditure are also classified according to their functions. All transactions are recorded in the statement of operations. These presentational differences are explained by the underlying focus of each framework; however, the result is that equivalent items can have different disaggregations – most notable cases are taxes and grants.
ESA 2010 classifies taxes according to their economic activities, while GFSM 2014 classifies taxes based on their administrative arrangements. While these presentations differ, what constitutes a tax does not differ between the frameworks.
Table 2 shows the breakdown of taxes under GFSM 2014 and ESA 2010 – demonstrating there is little direct overlap between the categories.
Table 2: Taxes in Government Finance Statistics Manual 2014 and European System of Accounts 2010
| Code | Taxes under GFSM 2014 | Code | Taxes under ESA 2010 |
|---|---|---|---|
| 111 | Taxes on income, profits, and capital gains | D.21 | Taxes on products |
| 112 | Taxes on payroll and workforce | D.29 | Other taxes on production |
| 113 | Taxes on property | D.51 | Taxes on income |
| 114 | Taxes on goods and services | D.59 | Other current taxes |
| 115 | Taxes on international trade and transactions | D.91 | Capital taxes |
| 116 | Other taxes | ||
| Source: Office for National Statistics | |||
| Notes: | |||
| 1. Codes in tables represent classification codes under each framework - these do not map directly across. | |||
| 2. All GFSM 2014 tax categories are broken down further, while only some ESA 2010 tax categories are broken down further. | |||
Download this table Table 2: Taxes in Government Finance Statistics Manual 2014 and European System of Accounts 2010
.xls (39.4 kB)ESA 2010 categories of grants map across to two main revenue and expense categories of GFSM 2014: grants, and other revenue and expense. Grants specifically relate to transfers to or from other government units, foreign governments, or international organisations. While other revenue and expense includes transfers to non-government sectors as well as transfers such as fees and fines that are recorded as grants under ESA 2010. Grants under ESA 2010 are mainly categorised according to whether they are current or capital as these are recorded in different accounts. Table 3 shows a comparison between the two frameworks.
Table 3: Grants in Government Finance Statistics Manual 2014 and European System of Accounts 2010
| Code | Grants under GFSM 2014 | Code | Grants under ESA 2010 | |
| 1311/ 2611 | Current grants from/to foreign governments | D.73 | Current transfers within general government | |
| 1312/2612 | Capital grants from/to foreign governments | D.74 | Current international cooperation | |
| 1321/2621 | Current grants from/to international organisations | D.76 | VAT- and GNI-based EU own resources | |
| 1322/2622 | Capital grants from/to international organisations | D.92 | Investment grants (partial coverage) | |
| 1331/2631 | Current grants from/to other government units | D.99 | Other capital transfers (partial coverage) | |
| 1332/2632 | Capital grants from/to other government units | |||
| Code | Other revenue/expense under GFSM 2014 | |||
| 143 | Fines, penalties, and forfeits | D.71 | Net non-life insurance premiums | |
| 144/282 | Transfers not elsewhere classified | D.72 | Non-life insurance claims | |
| 145/283 | Premiums, fees, and claims related to nonlife insurance etc. | D.75 | Miscellenous current transfers | |
| D.92 | Investment grants (partial coverage) | |||
| D.99 | Other capital transfers (partial coverage) | |||
| Source: Office for National Statistics | ||||
| Notes: | ||||
| 1. Fines, fees and penalties are recorded as miscellaneous current transfers (D.75) under ESA 2010. | ||||
| 2. Investment grants (D.92) and other capital transfers (D.99), under ESA 2010, include transfers within government or may include transfers to/from foreign governments or international organisations; therefore, can be mapped to both grants and other revenue/expense categories under GFSM 2014. | ||||
Download this table Table 3: Grants in Government Finance Statistics Manual 2014 and European System of Accounts 2010
.xls (41.5 kB)Under ESA 2010, transactions are generally recorded on an unconsolidated basis3. However, some transactions (property income, grants, and transactions in financial assets and liabilities) for general government are consolidated between subsectors. As ESA 2010 does not present public sector statistics as a whole, consolidated public sector data are not available under ESA 2010. GFSM 2014 extends the consolidation principle not only at the public sector level, but to taxes and purchases and sales of goods and services and transactions in non-financial assets.
Assets and liabilities under GFSM 2014 are primarily recorded at market value, with proxies used where this is not available; this guidance is the same under ESA 2010. The Manual on Government Deficit and Debt: MGDD 2016 provides details on how general government gross debt should be calculated for the purposes of monitoring under the Maastricht Treaty. General government gross debt is defined as the sum of liabilities in currency and deposits, debt securities and loans, at face value.
In contrast, the GFSM 2014 definition of gross debt includes liabilities in all financial instruments except equity and investment shares; and financial derivatives and employee stock options. Although the main measure is at market value, valuations at face value and nominal value are included in the balance sheet. Therefore, general government gross debt at face value under GFSM 2014 will be different when compared to general government gross debt as defined by MGDD 2016.
Treatment of employment-related pensions
A main area of public finances is employment-related pensions, which are used to provide public sector employees with income during retirement. The organisation and operation of pension schemes4 can vary; for example, they can be defined benefit or defined contribution schemes; funded or unfunded; and organised or operated through one or more institutional units. Such details determine the statistical treatment of pension schemes within ESA 2010 and GFSM 2014. While the classification of a particular pension scheme would be the same under each framework, the analytical purposes of each mean that there could be variation in the treatment of the flows and stocks of the scheme.
The differences in treatment of pensions between ESA 2010 and GFSM 2014 can be summarised as follows:
unfunded pension obligations are recognised in the balance sheet under GFSM 2014, while under ESA 2010 they are not
contributions received, and benefits paid by pension funds are treated as revenue and expenditure under ESA 2010, while under GFSM 2014 they are not
public sector pension funds are explicitly included within the public sector boundary under GFSM 2014
The distinction between funded and unfunded pension schemes is down to the use of assets to pay for future pension benefits. Funded pension schemes are those where the employee and employer pension contributions are used to purchase a ring-fenced pool of assets, which are then used to finance payment of pension benefits. In the case of unfunded pension schemes, there is no ring-fenced pool of assets that can be used to invest and generate a return – instead, the employer provides pension benefits on a pay-as-you-go basis5.
Both funded and unfunded pension schemes have a liability to households to the present value of pension benefits accrued to date. Funded pensions are commonly organised through pension funds that are classified in a different sector to the employer, though the ultimate responsibility of the pension liability remains with the employer. Within such an arrangement, the pension fund is considered to be the pension administrator, while the employer is considered to be the pension manager. In this case, both ESA 2010 and GFSM 2014 record the pension liability in the balance sheet of the pension administrator. Should the value of the liability be different to the value of assets then the pension administrator will have a claim on the pension manager.
In contrast, unfunded pensions are typically operated through one institutional unit (or units in the same sector), which is usually the employer; this means the employer has the pension liability. Under ESA 2010, liabilities of unfunded pension schemes are not recognised in the balance sheet6, owing to the heterogeneity of unfunded pension schemes and the need to maintain consistency of national accounts compiled across Europe. GFSM 2014 advises the recording of these liabilities in the balance sheet. Consequently, recording these liabilities necessitates the recording of additional transactions. This includes recording expense because retirement is one year nearer, which increases the present value of the pension entitlements – this is known as unwinding of the discount rate and is recorded in GFSM 2014 as property expense.
The second difference between the two frameworks relates to the treatment of contributions and benefit payments related to funded and unfunded pension schemes. Both funded and unfunded pension schemes receive contributions from employers and employees and pay benefits to current retirees. The difference is usually the sectors involved and, as described earlier, the source of income for benefit payments.
Under GFSM 2014 revenue, social contributions exclude contributions that are receivable in relation to employment-related pension schemes, or other retirement schemes, where a liability for future benefits is created7. Similarly, benefit payments related to these schemes are not treated as expense, but a reduction in the liability. These transactions do not impact net worth through revenue or expense.
The focus of ESA 2010 on interactions between the different sectors of the economy means that contributions and benefits must flow through the full sequence of accounts. Specifically, for funded pension schemes, contributions lead to the incurrence of assets or liabilities for households and pension funds. Therefore ESA 2010 records social contributions as both revenue and the incurrence of liabilities, with this double recording being neutralised by recording an adjustment in the use of income account for the change in pension entitlements. Such an adjustment is not necessary in GFSM 2014 because of the way contributions and benefit payments are treated.
Figures 2a and 2b provide a simplified comparison of the accounts of the government and the pension fund under ESA 2010 and GFSM 2014, for both funded and unfunded pension schemes.
Figure 2a: Overview of pensions under European System of Accounts 2010

Source: Office for National Statistics
Notes:
Unfunded employment-related pension schemes can be recorded in sectors other than government, in the UK they exist in the government sector.
For both funded and unfunded pension schemes, contributions received include contributions paid by households and employers. Employer contributions (actual and imputed) are rerouted via households in the sector paying the pension benefit.
The methodology for estimating unfunded imputed contributions, in the UK National Accounts and public sector finances, was reviewed and implemented in September 2017. Imputed contributions for unfunded pensions are estimated as zero - Section 5 of the article 'Employment-related pensions in public sector finances' provides further information.
From September 2019, a gross presentation of funded employment-related pensions was adopted in the public sector finances. This change brings public sector pension funds within the public sector boundary.
Download this image Figure 2a: Overview of pensions under European System of Accounts 2010
.png (45.4 kB) .xlsx (32.6 kB)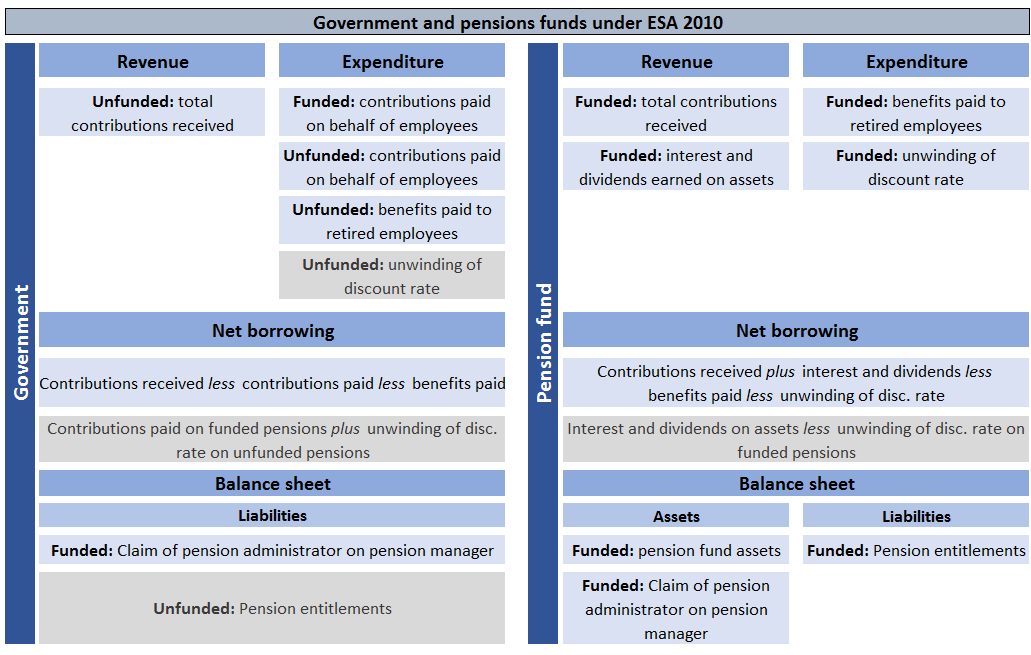
Figure 2b: Overview of pensions under Government Finance Statistics Manual 2014

Source: Office for National Statistics
Notes:
Unfunded employment-related pension schemes can be recorded in sectors other than government, in the UK they exist in the government sector.
For both funded and unfunded pension schemes, contributions received include contributions paid by households and employers. Employer contributions (actual and imputed) are rerouted via households in the sector paying the pension benefit.
The methodology for estimating unfunded imputed contributions, in the UK National Accounts and public sector finances, was reviewed and implemented in September 2017. Imputed contributions for unfunded pensions are estimated as zero - Section 5 of the article 'Employment-related pensions in public sector finances' provides further information.
From September 2019, a gross presentation of funded employment-related pensions was adopted in the public sector finances. This change brings public sector pension funds within the public sector boundary.
Download this image Figure 2b: Overview of pensions under Government Finance Statistics Manual 2014
.png (48.0 kB) .xlsx (12.4 kB)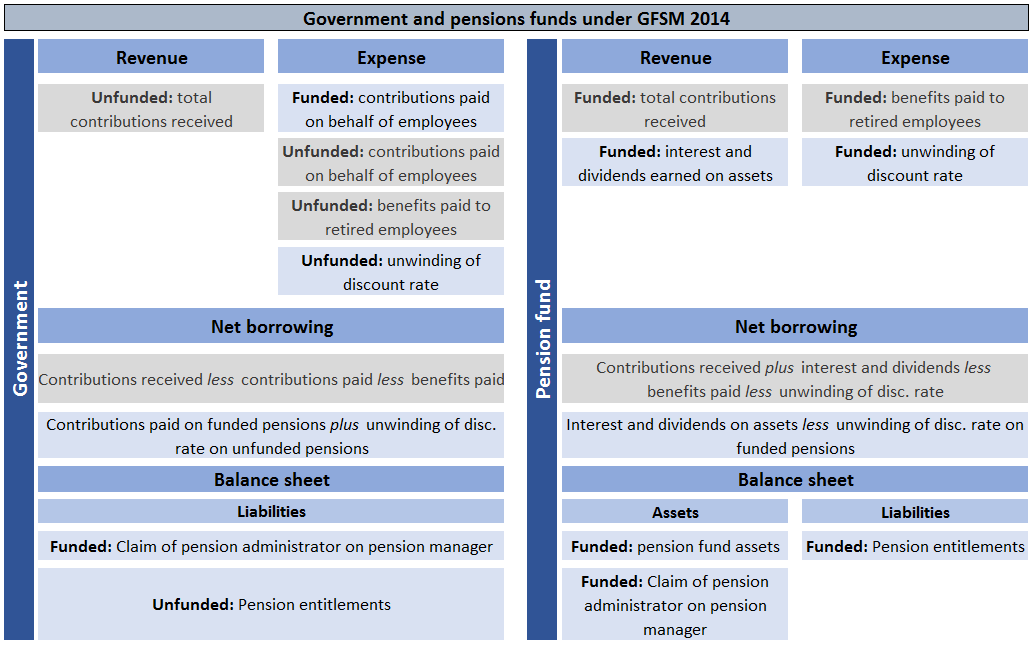
Finally, the last difference relates to the difference in public sector focus of each framework. ESA 2010 does not explicitly recognise public sector employment-related pensions as part of the public sector – in the core accounts or supplementary table on pensions. However, as of September 2019, the public sector finance statistics was adapted to include funded public sector employment-related pension funds within the public sector boundary. GFSM 2014 explicitly includes public sector pension funds within its boundary.
The differences between GFSM 2014 and ESA 2010 aggregates resulting from these methodological differences can be summarised as follows:
larger value of liabilities and smaller net worth with inclusion of unfunded pension liabilities
greater expenditure (and net borrowing) by recording of unwinding of discount rate related to unfunded pensions
revenue and expenditure differences from removal of contributions and benefit payments related to unfunded pensions
flow and stock and differences from inclusion of public sector pension funds in the public sector boundary
Coverage of public-private partnerships and concessions
Governments may contract with corporations to finance, design, construct and operate public fixed assets; for example, buildings such as hospitals and schools, roads, airports, bridges, and others. Such contracts or legal agreements will often be complex, but at a basic level will include details on goods, services and assets provided, along with information on financing and ownership. This information is important for the statistical classification and recording of transactions and assets detailed in the contract.
Common types of contracts are public-private partnerships (PPPs) and concessions. Guidance on the classification of such contracts within ESA 2010 is supplemented by guidance within the Manual on Government Deficit and Debt 2016: MGDD 2016. Although not strictly considered to be a methodological difference, the guidance in MGDD 2016 is more detailed and prescriptive than guidance in GFSM 2014.
Identification of the economic owner of the asset is important to the classification of these contracts, where the economic owner is the unit to which benefits from the asset accrue. The asset is recorded in the balance sheet of the economic owner, which may or may not be the legal owner of the asset. Identification of the economic owner is completed through assessment of the risks and rewards related to acquiring the asset. GFSM 2014 agrees with ESA 2010 and MGDD 2016 that the economic owner is the party that bears the majority of risks and rewards.
Under ESA 2010, PPPs are generally considered to be on-balance sheet if the government unit bears the majority of the construction and availability risks. That is, if the government bears the risks or costs related to events such as late delivery, increased costs and so on, during the construction phase; and covering risks or costs associated with volume and/or quality of services not meeting standards specified in the contract. ESA 2010 also states that it is relevant to assess the “control” of the asset should this risk and reward assessment prove inconclusive.
However, the complex nature of these contracts requires assessment of additional areas to obtain a fuller picture. MGDD 2016 extends the guidance in ESA 2010 and suggests it is important to assess areas such as government funding, government guarantees, termination clauses, government influence over the terms of the asset and services provided, government rewards, as well as unforeseeable circumstances and allowances. Similar considerations are given to concession contracts, with further assessment required when minimum revenue guarantees are provided.
GFSM 2014 recognises similar risks, to ESA 2010 and MGDD 2016, that could exist under PPP and concession contracts. However, it is less prescriptive in describing which of these risks or rewards may determine the economic owner. This leads to the possibility of taking an alternative approach to the recording of PPPs in the public sector finances under the GFS framework, to present a broad picture of the balance sheet. GFSM 2014 describes the International Public Sector Account Standards Board (IPSASB) guidelines for the recognition and measurement of a service contract (IPSAS 32)8 as a possible way of determining the economic owner.
The Whole of Government Accounts (WGA) published by HM Treasury are compiled in accordance with the International Financial Reporting Standards (IFRS), with which IPSAS32 is consistent. Under the WGA, more PPPs and concessions are recorded on the government’s balance sheet than recorded in the public sector finances under ESA 2010 and the MGDD 2016.
Therefore, to present a broader picture of the public sector balance sheet than currently available in the public sector finances, we have decided to report those PPPs that are recorded on-balance sheet in the WGA. The differences between GFSM 2014 and ESA 2010 aggregates resulting from these coverage differences can be summarised as follows:
larger value of non-financial assets to account for assets brought on-balance sheet – offset by an increase in liabilities representing financing costs
differences between expenditure and loan flows (and net borrowing) as different transactions recorded
Other differences
Previous sections have described some of the main differences between GFSM 2014 and ESA 2010. This section describes other methodological differences that result in minor differences between the statistics although do not generally affect the main aggregates.
- Own-account capital formation
Own-account capital formation is the production of capital goods that are retained by their producer for their own gross fixed capital formation. For government, the largest component is research and development (R&D). Under GFSM 2014, costs associated with own-account capital formation are excluded from expense (compensation of employees; use of goods and services; and consumption of fixed capital) and recorded as the acquisition of the non-financial asset. Under ESA 2010, the acquisition of the non-financial asset is recorded, as are the costs as well as output for own final use.
- FISIM, insurance services, and fees related to standardised guarantee schemes
In GFSM 2014, the services fees related to interest, non-life insurance premiums, and fees for standardised guarantee schemes are not separately identified because they can be estimated only indirectly by considering data for all sectors of the economy, such as in national accounts. In ESA 2010, the values for financial intermediation services indirectly measured (FISIM), insurance services and standardised guarantees are derived by partitioning interest, non-life insurance premiums, and fees for standardised guarantee schemes.
- Social transfers in kind
In GFSM 2014, goods and services produced by government and transferred in kind are recorded as imputed sales only when provided to employees as wages in kind. In all other cases, only the cost of producing these goods and services is recognised in the respective expense categories. In ESA 2010, all goods and services produced by government and transferred in kind are recorded as a transfer and an imputed sale of goods and services.
Notes for: International Monetary Fund’s Government Finance Statistics framework
The statement of sources and uses of cash has not been introduced as part of the tables in June 2019 because of difficulties in sourcing data disaggregated into the economic transaction categories required by the GFS framework. This will be explored in the future – see Section 7 for further details.
The summary statement of explicit contingent liabilities and net implicit obligations for future social security benefits has not been introduced as part of the tables in June 2019 as work is planned to improve the coverage of contingent liabilities – see Section 7 for further details.
Consolidation refers to the elimination of flows and/or stocks between units, subsectors or sectors as if they were a single unit.
Pension schemes are a form of social insurance provided on a collective basis, and where employees and/or employers are making contributions for employees to receive future benefits.
See article Employment-related pensions in public sector finances for further information on the current treatment in PSF
While not included in the core national accounts, public sector unfunded employment-related pensions are published in Column G of the supplementary table on pensions.
GFSM 2014, para. 5.94
For more information, please see paragraph A4.63 of GFSM 2014.
5. Comparability with public sector finances aggregates and other related statistics
5.1. Public sector finances aggregates
While the public sector finances (PSF) statistics are compiled in accordance with the European System of Accounts 2010: ESA 2010 and the Manual on Government Deficit and Debt: MGDD 2016, some of the fiscal aggregates in the public sector finances are not defined in these manuals. Public sector net debt (PSND) is the main measure of debt in the public sector finances and though not defined in the manuals, is consistent with similarly defined concepts in the manuals.
Public sector net financial liabilities (PSNFL) encompasses all financial assets and liabilities and is a broader balance sheet measure than PSND. Figure 3 provides a comparison of the PSF aggregates PSND and PSNFL against the Government Finance Statistics Manual (GFSM) headline aggregates – net debt and net worth. There are some valuation differences between PSNFL and GFSM net debt, where PSNFL includes debt securities at face value, while these are included at market value under GFSM. Included in this comparison is also Maastricht debt1. The different valuations are defined as:
market value: value if acquired in a market transition on the reporting date
nominal value: initial cash or issuance value plus any subsequent flows, such as repayment and interest flows
face value: amount to be repaid at maturity
Reconciliations between the different aggregates are included within the datasets.
Figure 3: Comparison of aggregates between Government Finance Statistics Manual 2014 and public sector finances

Source: Office for National Statistics
Notes:
- Currency and deposits, debt securities and loans in public sector net financial liabilities are recorded at face value.
Download this image Figure 3: Comparison of aggregates between Government Finance Statistics Manual 2014 and public sector finances
.png (41.2 kB) .xlsx (11.7 kB)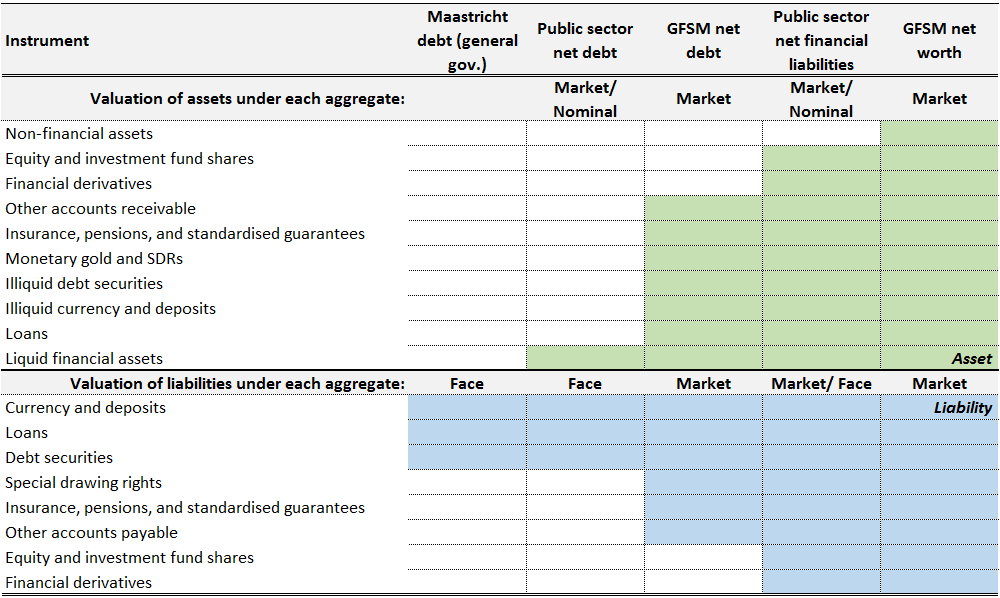
It is also useful to highlight differences in PSF presentation of statistics compared with the statement of operations. As previously noted, some aggregates in the public sector finances are based on the UK’s fiscal framework. These include public sector current receipts (PSCR) and public sector current expenditure (PSCE).
The differences between these aggregates and revenue and expense totals in GFSM 2014 are primarily down to the treatment of some pension contributions, current grant receipts and sales of goods and services as negative expenditure; as well as the exclusion of capital grants in PSCR and PSCE. A reconciliation between the statement of operations and PSF PSAT high-level presentation is included within the datasets to explain these differences further.
5.2. Wider measures of public sector debt
Each year we publish an article discussing the wider measures of public sector net debt along with statistics on contingent liabilities and other obligations. This is in accordance with Article 14 of the European Commission directive EC2011/85, which forms part of a wider set of legislation known as the “6-pack”.
Published in the article are a number of different measures of debt, including those which are already published in the public sector finances. Additional measures of debt published are general government unconsolidated gross financial liabilities and general government unconsolidated net financial worth. Unconsolidated data is a feature of the national accounts’ framework, while aggregates included under GFSM are consolidated.
5.3. National balance sheet
The National balance sheet (NBS) publication presents the balance sheet of each sector of the economy to derive net worth. Net worth is derived for general government and its subsectors as well as the public sector, defined as general government and public non-financial corporations.
While much of the underlying data used to compile public sector elements in the NBS publication is the same as in the public sector finances (PSF) statistics, the totals are not equal for several reasons. These can be summarised as:
data presented in the NBS are unconsolidated at the general government and public sector levels, while they are consolidated in PSF and GFSM
public corporations are limited to public non-financial corporations; this means bodies such as the Bank of England are not included in the public corporations sector of the NBS data
sector classifications and other methodology changes are implemented at a longer lag in the UK National Accounts than in the PSF statistics, resulting in differences between the datasets
significant differences exist in other accounts receivable or payable owing to the use of this as reconciliation between the financial and non-financial accounts in the UK National Accounts
other data source or methodology differences
5.4. Whole of Government Accounts
The Whole of Government Accounts (WGA) is published annually by HM Treasury (HMT) and includes the aggregated accounts of 8,000 public sector bodies, which are prepared in line with International Financial Reporting Standards (IFRS).
Some notable differences between the WGA and GFSM presentation are:
while both WGA and GFSM include liabilities related to funded and unfunded pensions, these are valued differently as different discount rates are used – further differences in relation to pensions are explained in our Pensions in national accounts article
assets and liabilities are often valued at fair value under IFRS
under IFRS, provisions are recorded in the balance sheet, which represent funds set aside to cover unexpected events or other potential future obligations
Notes for: Comparability with public sector finances aggregates and other related statistics
1.Defined as liabilities in currency and deposits, debt securities, and loans, at face value.
Back to table of contents6. Data sources and quality
Much of the data used to compile the new Government Finance Statistics Manual (GFSM) compliant tables are the same as those used in the compilation of the monthly public sector finances (PSF) and quarterly government finance statistics (GFS) submissions to Eurostat. These are designated National Statistics, while newer aggregates such as public sector net financial liabilities (PSNFL) have not yet been assessed as National Statistics.
While quality of most data is robust, there are areas where limitations may exist thanks to coverage or timeliness of data sources. This section aims to highlight the areas most relevant to the understanding and interpretation of statistics presented in the GFSM tables. These can be summarised as:
continuous development of public sector net financial liabilities
pensions
non-financial balance sheet
public-private partnerships
development of local government statistics
other data source considerations
Our annual article, Looking ahead – developments in public sector finances: 2019 contains information on developments to the wider public sector finance statistics. Some of these developments are briefly described here as those improvements are directly relevant to the GFSM presentation. Furthermore, some developments or data limitations described here may not necessarily be applicable to the current public sector finances presentation.
6.1. Continuous development of public sector net financial liabilities
The sources and content of the financial balance sheet data are the same as those used to compile the fiscal aggregate PSNFL. When we introduced PSNFL in November 2016 we committed to improving the underlying data related to this aggregate.
Since then we have made improvements primarily to government’s net liability in relation to public sector employment-related pensions. We have also made improvements to central government equity and loan assets. Our current work focuses on improving financial assets and liabilities of public corporations, through the use of data from the Whole of Government Accounts. We expect to implement improvements in 2020.
In the future, we will review the methods we use for recording the activities of public financial corporations and explore the possibilities of reporting a separation of public financial and non-financial corporations. Each of these pieces of work are described in more detail in our Looking ahead 2019 article.
6.2. Pensions
Since the implementation of the European System of Accounts 2010: ESA 2010, the net liability (or the liability for any underfunding) in relation to funded public sector employment-related pensions has been recorded in the accounts of general government, and so public sector finances (PSF), statistics. These data have continued to improve, though the updates have been constrained by the availability of actuarial valuations. Such valuations, performed to measure the size of pension liabilities, are relatively infrequent owing to their reliance on complex modelling. These can in turn cause retrospective revisions in statistics.
In September 2019, we adopted a gross presentation, recording the assets and the total pension liabilities of the funded pension schemes within the public sector boundary. This change, predominantly presentational in nature, has greatly increased the volume of assets and liabilities recorded on the public sector balance sheet, but consolidated many inter-public sector balances and transactions. Further detail on methods and data sources can be found in our Pensions in the public sector finances methodological article.
As explained in Section 4.3, obligations under unfunded pension schemes are not included on the public sector balance sheet.
They are included in the supplementary dataset on accrued-to-date pension entitlements in social insurance – UK National Accounts Table 29. This dataset serves as a basis for the compilation of the GFSM pension statistics.
Similarly to many funded schemes, estimating pension liabilities of their unfunded counterparts relies on actuarial modelling, which considers a whole range of relevant factors such as life expectancy or wage growth. An important component of valuing the pension liability is a choice of the discount rate.
ESA 2010, through the Technical Compilation Guide for Pension Data in National Accounts, mandates the use of 3% real, 5% nominal discount rate for all government-managed pension schemes. These rates may differ from the discount rates used in scheme accounts and is the main reason for differences between the statistical estimates and HM Treasury’s Whole of Government Accounts (WGA) data.
For the PSF GFSM 2014 tables, data on unfunded pensions are consistent with the UK National Accounts Table 29 from 2010 onwards. Table 29 had not been compiled prior to 2010 and the data have been additionally estimated for the purposes of GFSM statistics. Some simplifying assumptions had to be made in the absence of relevant information.
For example, we have assumed that no negotiated scheme changes have taken place between 1998 to 2010. The absence of this information may lead to smoother trends in the total pension liabilities than would have been observed in the presence of identifiable step changes.
Unlike the actuarially-modelled data, the estimates of actual employer and employee contributions are based on administrative data already included in our PSF and national accounts statistics. However, as the pension data are produced with a lag because of the need to collect more information, the PSF GFSM 2014 tables will not be updated with the most recent financial year until the following year.
Information on the methods and data sources used to derive estimates in the STP are available in the methodology article accompanying the supplementary table on pensions.
6.3. Non-financial balance sheet
The underlying data used for the non-financial balance sheet are those published in the UK National Accounts and published in the annual National balance sheet publication. Data are published at a lag due to availability of source data.
New capital stocks and consumption of fixed capital data will be incorporated into Blue Book 2019. However, they have been incorporated into the PSF GFSM 2014 statistics ahead of Blue Book 2019. A review of the asset life lengths and the related flows used in the measurement of capital stock took place, which included re-establishment of the Perpetual Inventory Method (PIM). It also included the introduction of calculations to provide full reconciliation between the opening and closing balance sheet – currently this reconciliation is challenging. More detail can be found in the Changes to the capital stock estimation methods for Blue Book 2019 article.
Other challenges in the area of non-financial assets include valuation and coverage of intangible assets, other valuables and inventories. Data source limitations mean that there is currently data lacking for the stock of general government valuables, while coverage of intangible assets could be extended. Inventories is another area that is often difficult to measure yet source data does not allow easy identification of relevant information. As part of our developments to public sector finances, this is an area we are looking to improve.
6.4. Public-private partnerships
As of October 2019, we have extended the coverage of Public-private partnerships (PPPs) included on balance sheet. This means we now include the imputed finance lease liability related to Public-Finance Initiatives (PFIs) considered on balance sheet in the Whole of Government Accounts (WGA).
In order to extend the coverage and present a broader picture of the public sector balance sheet than is currently available in public sector finances (PSF), we decided to use the information available from Infrastructure and Projects Authority (IPA). This publication includes data on future payments to be made, as well as the total capital value for the PFI and Private Finance 2 (PF2) projects.
The imputed finance lease liability and the unitary charge payments were derived from these data. The breakdown of unitary charges into the service charge element, the capital element and the interest payments was estimated using data on in-year interest and service charge payments for on-balance sheet PFIs provided by HM Treasury , compiled for the WGA publication.
For the data beyond financial year ending March 2010, asset values are taken from the WGA. In the absence of relevant information prior to this, we have recorded the asset values as equal to the imputed lease liability.
The IPA dataset is currently used to estimate the finance lease liability, the total capital value and the unitary charge payments for PFIs on and off government’s balance sheet under the European System of Accounts 2010. These estimates are included in the public sector finances and national accounts. In addition to the projects included in the IPA list, projects reported by the devolved administrations are also added using published data.
6.5. Development of local government statistics
Improving timing of data and coverage of detailed information is an important area of development. The main factor affecting the accuracy of local government expenditure statistics is the availability of source data; there can be a lag of up to 18 months until the full range of local government data sources are finalised. As part of ongoing development work, we intend to work closely with providers of local government data to reduce the time lag.
Recently, we have requested information about instances where local government bodies are working jointly with other organisations, perhaps engaging in joint ventures or public-private partnerships. There are some data flows that are presently captured on a net rather than gross basis for local government. While not affecting some of our headline fiscal aggregates, this limits our understanding of the data flows within the sector and between local government and other organisations.
We propose to explore with data providers the possibility of providing a fuller breakdown, allowing users to see the gross position as well as having the option to derive the net impact.
6.6. Other data source considerations
To compile the public sector finances and UK National Accounts, many data sources are used. These include sources that relate directly to government finances (such as government administrative data), but also include sources where government is the counterpart in a transaction (such as financial institution survey data).
The variety of data used means that, when compiling transactions in financial assets and liabilities, it is not always possible to relate the financing and investment transactions to the related revenue or expense transactions. This can result in the net borrowing or lending derived from revenue and expense transactions being different to that derived from transactions in financial assets and liabilities. This difference is referred to as the “statistical discrepancy” and is shown as a memorandum item in the statement of operations. We regularly review our data sources and processes to ensure this discrepancy is as small as possible.
Back to table of contents7. Future plans
Over the medium-term, we expect to continue to improve and extend these tables, as well as, where necessary, further align with the Government Finance Statistics Manual 2014: GFSM 2014. As of October 2019 we have resolved the main differences between GFSM 2014 and the European System of Accounts 2010: ESA 2010. Some of the improvements made are reliant on, or affected by, developments to the wider public sector finances, as described in our Looking ahead – developments in public sector finances: 2019 article.
We currently do not publish a statement of contingent liabilities as our wider work to improve our coverage of contingent liabilities and other potential obligations will have implications for GFSM 2014 statistics. As such, we will introduce this statement once elements of the wider work conclude and improvements can be implemented; though our aim is to introduce this statement by 2020.
Beyond this, we will also explore the feasibility of introducing a statement of expenditure by function and the cash flow statement.
Back to table of contents