
What's GDP (Gross Domestic Product) got to do with you and me? It's a part of everyday life, from booking a cruise to having a pint down the local to the things you buy in your weekly shop.
On a broader level, it's a way of working out how the economy is doing. The 2016 estimate currently stands at £1.9 trillion1 and represents the value of income, expenditure, and production of the UK.
We've played our part in that by spending money, making money, producing things — GDP is made up of all of our contributions that we make every day.
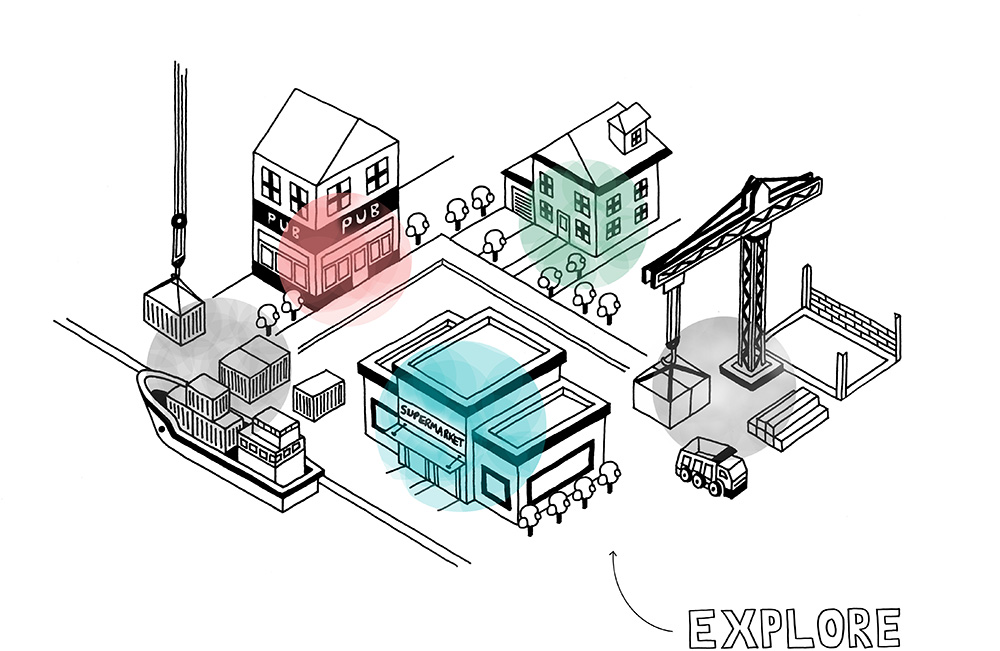
We've come up with some everyday situations to show you what feeds into GDP and the effect variations in these can have on the final number. Take a look around real life examples and explore for yourself.

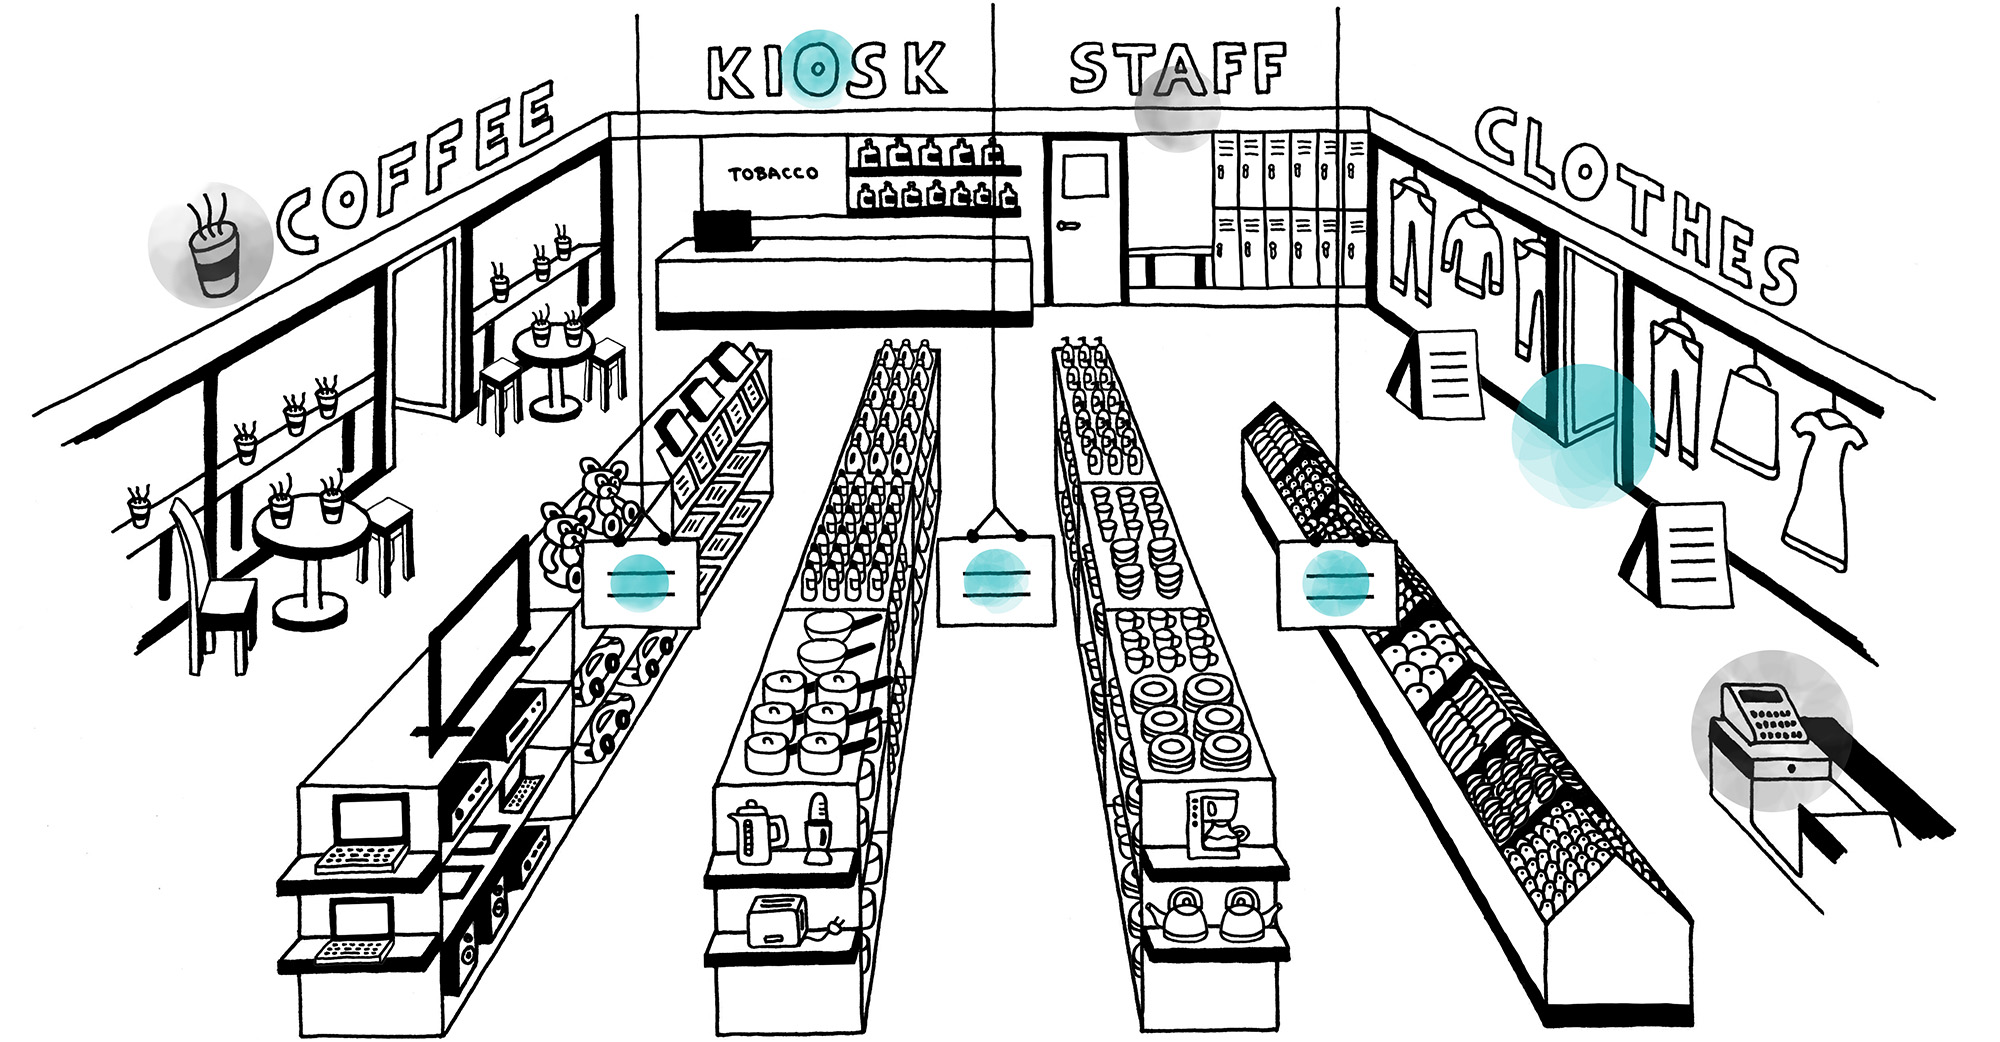
GDP is affected by levels of spending. Average spend per person in 2015 was £21,172.3
Use the slider to see how much GDP would change if we all varied our spending habits.
This could be by switching between premium and value brands, eating out or cooking at home, or hiring a builder compared to a bit of DIY.

If we all had spent £0 more in 2015
GDP would have increased by 0%

Consumer spending, worth around 60% of GDP, has been one of the driving forces behind the recovery of the UK economy.
Doing your weekly shop? Explore the aisles to discover more ...

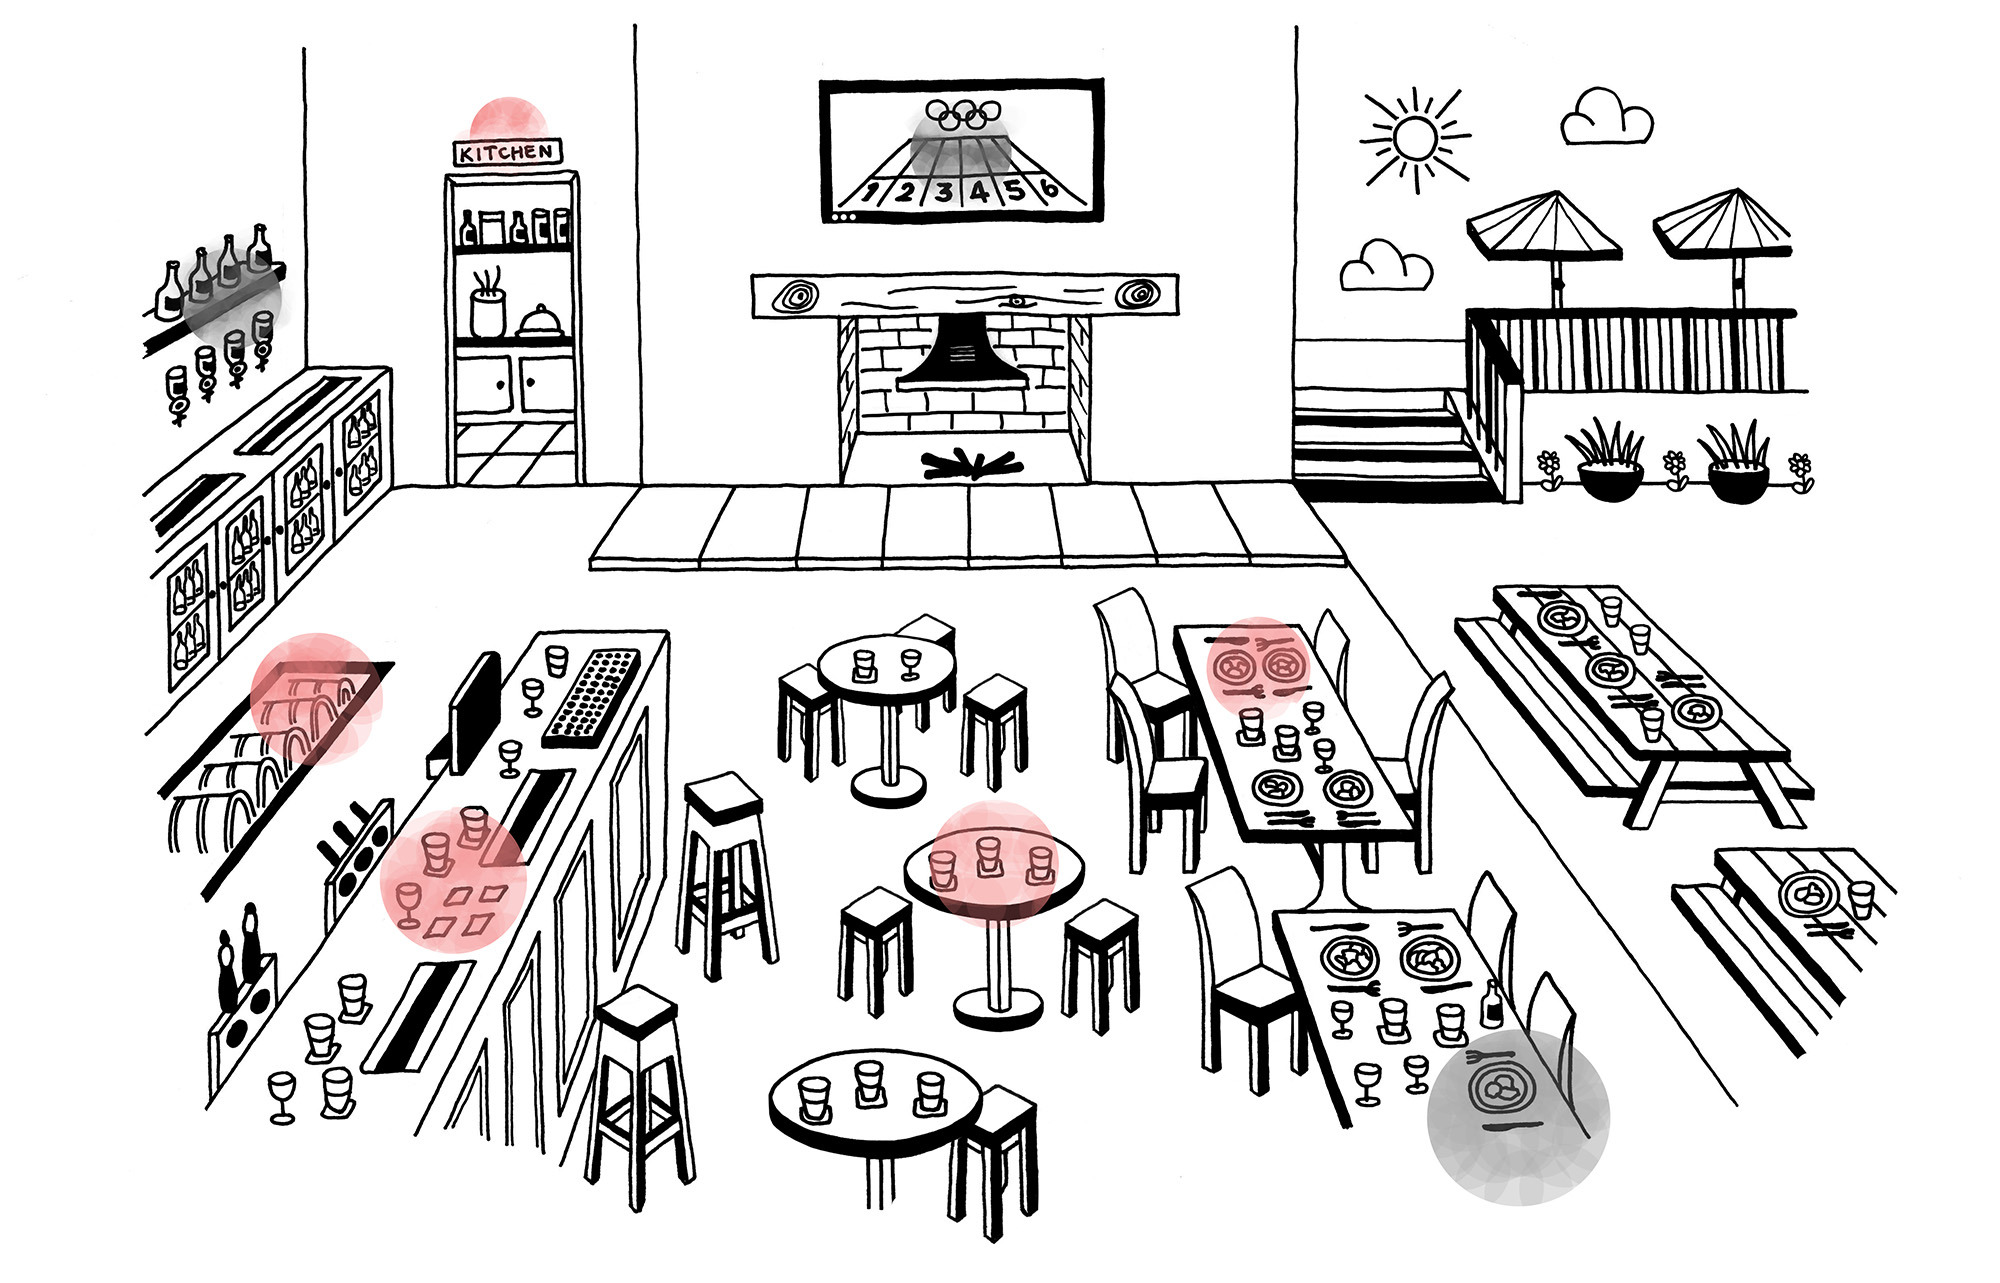
The pub has an impact on GDP in many ways, with the weather conditions adding an extra dimension to things such as sales figures, as well as the ability of staff to make it into work.
It's not just drinking and dining. Private sector investment by the hotel and restaurant industry was around £5.1 billion in 2015, also included in GDP.
Prop up against the bar and take a look at how the local contributes ...

Families come in all shapes and sizes and contribute to GDP differently. We look at two types of family to show you how much everyday life affects GDP.
Make yourself at home and take a look around ...
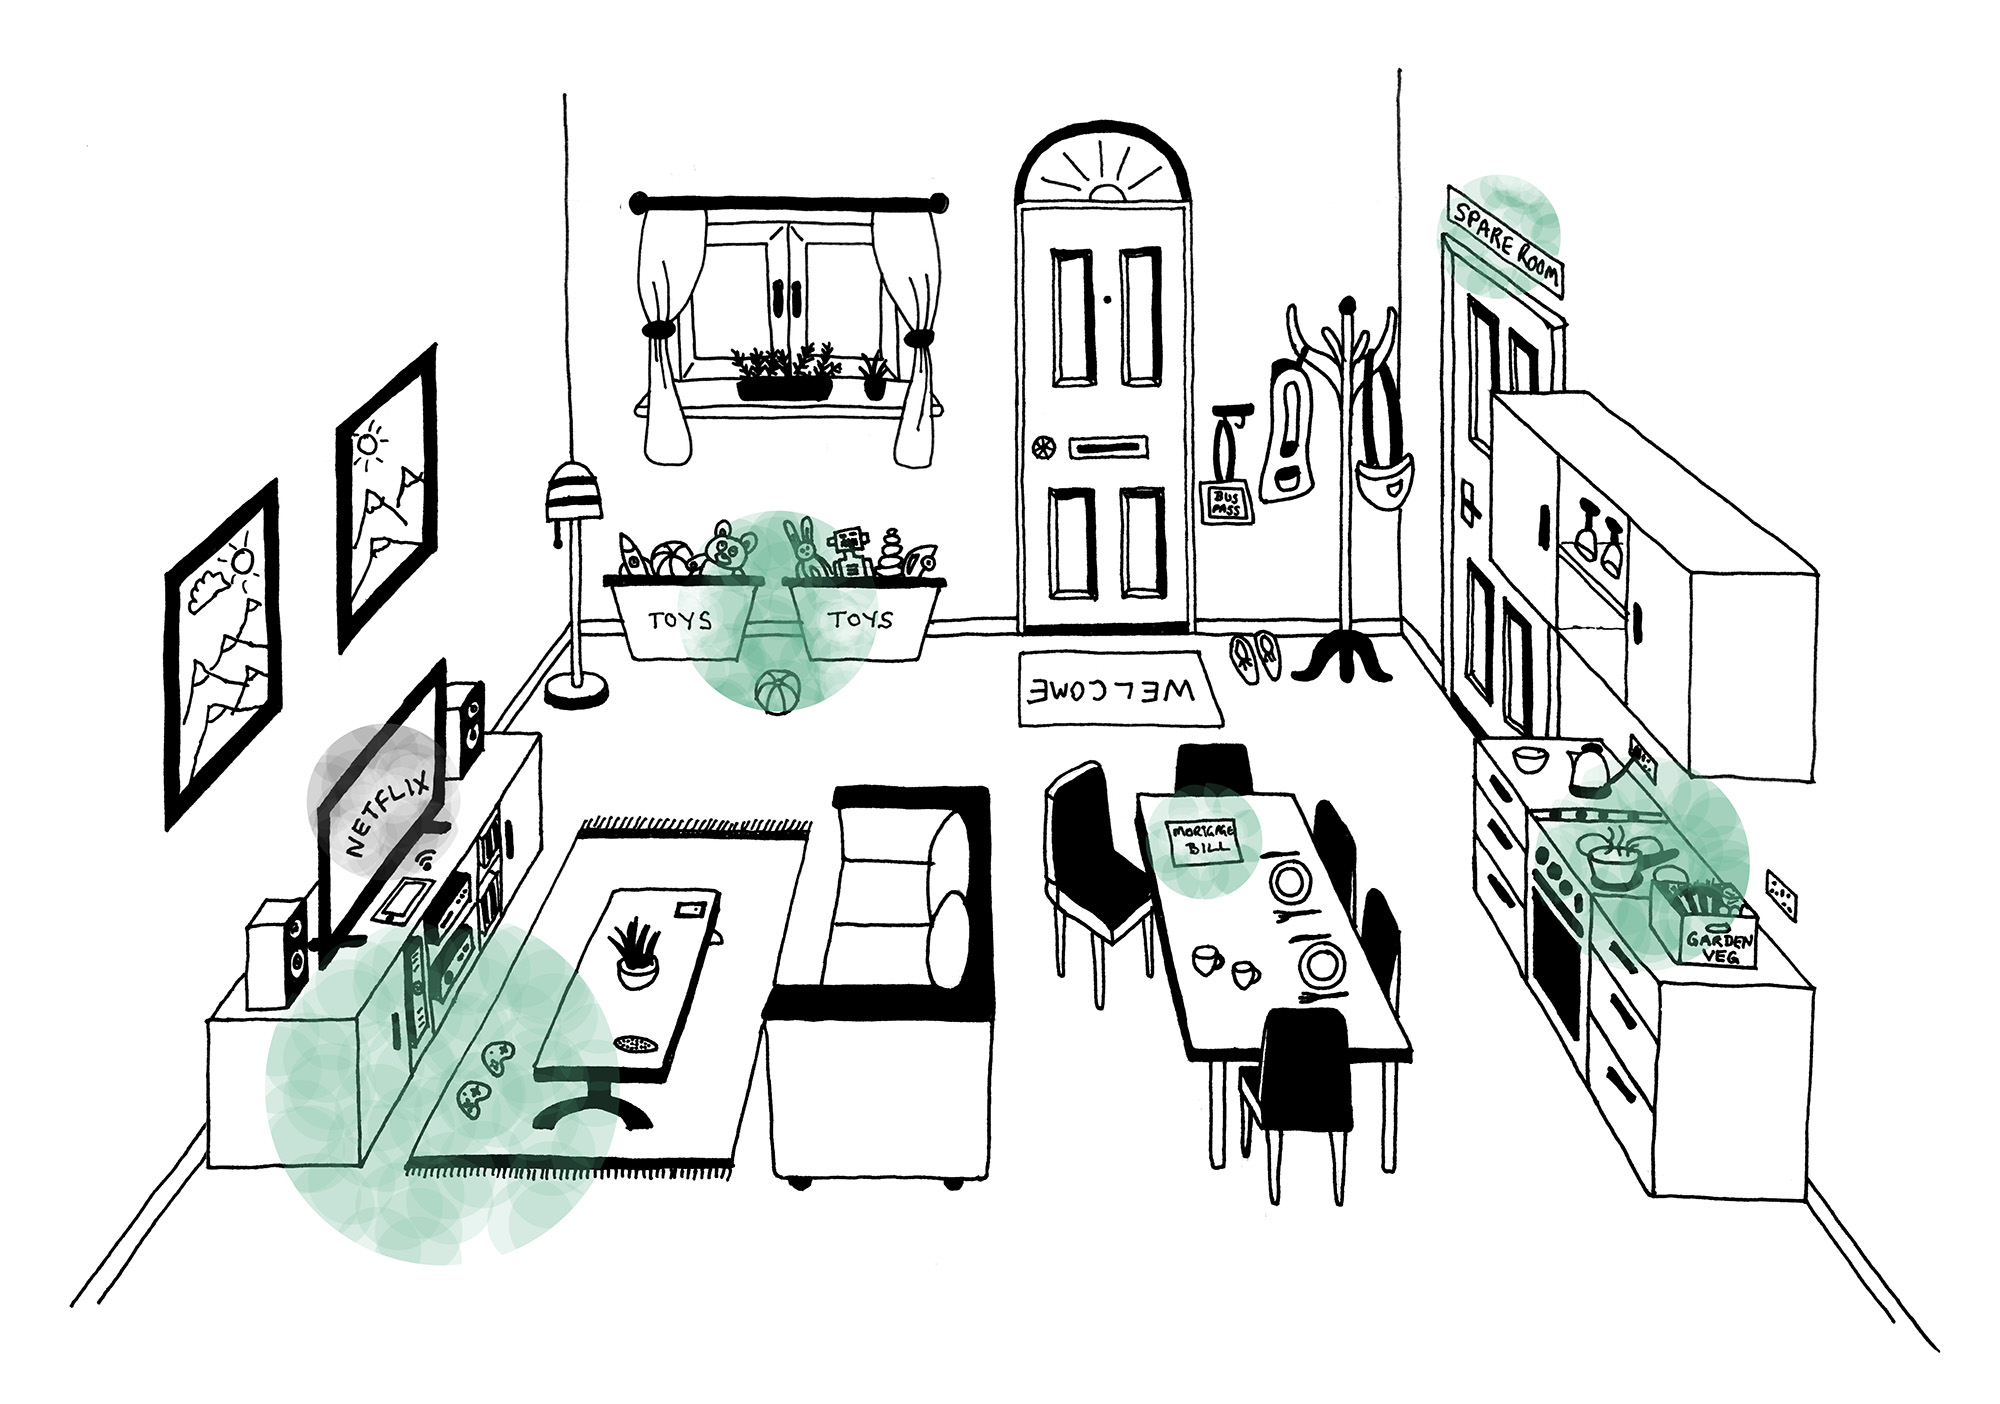
At home with the Waltons
This couple are both under 30, with a young family. They are both employed and pay for childcare. These types of spending contribute to GDP, as does their income.
To save money, the Waltons cook at home, grow some of their own food, and use sharing economy apps (such as airbnb) to make extra cash.
In 2015/16, renting household spent 19% of their total expenditure on net rent, higher than the proportion of expenditure spent on mortgages by mortgage holders. Households in the under-30 age group spent an average weekly amount of £89.90 in 2015/16 on net rent, more than three times the UK average (£32.50).4


Additional information
1 GDP is an average on all three approaches to GDP: income, expenditure, and output (or production). Read more here: Understanding GDP, 5 Facts about GDP. It is published once a month, three times over one quarter: the Preliminary Estimate of GDP (Jan, Apr, Jul, Oct) which contains only output data; the Second Estimate (Feb, May, Aug, Nov), which includes expenditure and income; and the Quarterly National Accounts (Mar, June, Sept, Dec) which provides a more complete picture of the economy. There is also an annual publication: the Blue Book.
2 The data used in this piece are annual figures. The National Accounts have a huge amount of data sources - most data here are National Accounts, although some data are from survey responses (such as Family Spending) which eventually feed in to National Accounts, along with administrative data. NA data are published at various times during the calendar year. Some of the calculations are not methodologically precise, but are used here to give context to changes in GDP and its components.
3 Spending refers to Household Final Consumption Expenditure (HHFCE). Population is the mid-year 2015 estimates, and only includes those aged 15+.
4 When we consider household spending by age, we look at the age of the person legally responsible for the household accommodation. We call this person the household reference person (HRP).
Port — UK Trade
Ref: Jan 2017, CP SA
Table: Publication tables UK Trade, 1.Value of UK TiG and TiS
Construction site — Construction
Ref: Jan 2016, CVM SA
Table: Output in the construction industry, tables 1a and 3a
Consumer Trends — Consumer Trends
Ref: July to Sept, 2016, CVM SA
Table: Consumer Trends, Chained Volume Measure, Seasonally Adjusted
Employment — Labour Market
Ref: Feb, 2017
Table: EMP04, Employment by occupation
Not (included in) national accounts
Retail Sales — Retail Sales
Ref: Jan 2017
Table: RSI categories and their percentage weights
Taxes
— HMRC
Ref: Jan 2017
Table: Tax and NIC Receipts
— Effects of Tax on Households
Ref: Financial year ending 2015
Not (included in) national accounts
Meals
— Second Estimate of GDP
Ref: Oct to Dec, 2017, CP SA
Table: UK GDP(O) Low Level Aggregates, CP £ Millions
— Consumer Trends
Ref: July to Sept, 2016, CVM SA
Table: Consumer Trends, Chained Volume Measure, Seasonally Adjusted
Drinks — Popular summer products
Bar — Second Estimate of GDP
Ref: Oct to Dec, 2017, CVM SA
Stock — Second Estimate of GDP
Ref: Oct to Dec, 2017, CP SA
Table: UK GDP(O) Low Level Aggregates, CP £ Millions
Bad weather — Statistical Special Events
Quiet pub — Introduction to Seasonal Adjustment
Staff — Second Estimate of GDP
Ref: Oct to Dec, 2017, CVM SA
Misc — UK Manufacturers’ Sales by Product (PRODCOM)
Ref: intermediate 2015 and 2014 final results
Table: UK Manufacturers’ Sales by Product (PRODCOM), Division 11
Misc — Labour Market
Ref: Feb, 2017
Table: EMP04, Employment by occupation
Not (included in) national accounts
Morgans
Introduction
— Wealth and Assets
Ref: 2012 to 2014
Chapter 2
— English Housing Survey
Ref: 2014 to 2015
Housing for Older People Report
— Family Spending
Ref: Financial year ending March 2016
Table: 2.4, housing expenditure by age of HRP; Table A11, detailed household expenditure by age of HRP
Survey data 2
Housing — English Housing Survey
Ref: 2014 to 2015
Housing for Older People Report
Childcare — Household Satellite Accounts
Ref: 2005 to 2014, CP SA
Chapter 5
Travel — Travel Trends
Ref: 2015
Table: UK residents visits abroad
Survey Data
Recreation and Culture — Family Spending
Ref: Financial year ending March 2016
Table: A10, Household expenditure as a percentage of total expenditure by age of HRP
Survey Data
Income — Quarterly Sector Accounts
Ref: July to Sept, 2016, CVM SA
Table: United Kingdom economic accounts: main aggregates, Table 1.1.5
Waltons
Introduction — Spending
Ref: Financial year ending March 2016
Table: 2.4, housing expenditure by age of HRP, Table 2.2, housing expenditure
Survey data 2
Housing — Consumer Trends
Ref: July to Sept, 2016, CVM SA
Table: Consumer Trends, Chained Volume Measure, Seasonally Adjusted
Children
— Families and Households
Ref: 2016
— Consumer Trends
Ref: July to Sept, 2016, CVM SA
Table: Consumer Trends, Chained Volume Measure, Seasonally Adjusted
Sharing Economy — Measuring the Sharing Economy
Cooking at home
— Consumer Trends
Ref: July to Sept, 2016
Table: Consumer Trends, Chained Volume Measure, Seasonally Adjusted
— Household Satellite Accounts
Ref: 2005 to 2015, CP SA
Chapter 5
Recreation and Culture — Family Spending
Ref: Financial year ending March 2016
Chapter 7