Table of contents
- Main points
- Introduction
- Assessing change in national well-being
- Summary of Life in the UK, 2016
- How do we evaluate our own lives?
- How important are the relationships we have?
- How good is our health?
- How do we spend our time and are we satisfied with its use?
- How do we feel about where we live?
- How are we coping financially?
- How strong is our economy?
- How skilled are we?
- How politically engaged are we?
- Are we protecting our natural environment for future generations?
- Children’s well-being
- How sustainable is our future?
- Sources, reports and surveys related to 'Life in the UK, 2016'
1. Main points
Overall national well-being has improved. Of the 43 assessments of change, 17 have improved, 8 have deteriorated and 11 stayed the same, compared with 3 years earlier.
The majority of improvements relate to objective measures of national well-being such as the unemployment rate, while the majority of measures assessed as “deteriorated” are subjective measures, such as satisfaction with health, for both periods examined.
Satisfaction with health in the UK fell from 66.3% in the financial year ending 2011 to 57.8% in the financial year ending 2014.
The number of crimes against the person fell from 82 per 1000 adults in the financial year ending 2012 in the UK to 57 per 1000 adults in the financial year ending 2015.
Net national disposable income per head increased in the UK from £22,487 in 2011 to £22,786 in 2014 and the proportion finding it difficult to cope financially fell from 11.6% to 9.1% between financial years ending 2011 and 2014.
Between 2011 and 2014, Greenhouse gas emissions fell from 553.4 million tonnes of carbon dioxide equivalent to 514.4 million tonnes of carbon dioxide equivalent in the UK.
Back to table of contents2. Introduction
Life in the UK 2016 provides the latest annual summary of change in the headline measures of national well-being. Organised into 10 domains, such as Health, Where we live, Education and skills and Natural environment, the report highlights ‘how we are doing’ as individuals and as a nation and how sustainable this is for the future. The measures include both objective data (for example, healthy life expectancy) and subjective data (for example, satisfaction with health) in order to provide a more complete view of the nation than measures such as Gross Domestic Product (GDP) can do alone.
Change over time is assessed in terms of whether measures have improved, deteriorated or shown no overall change, covering the latest year for which data are available and the previous 3 years.
A closer look at the sustainability of national well-being for the future is taken using ONS valuation of stocks of things like education, natural resources and community cohesion, known as “capitals”. Valuing the stocks we have now provides important benchmark information to help ensure they can be sustained for the future.
Measures are updated in March and September. Where possible, data are presented for the UK. Where this is not the case, the best available geography is used. Data are the latest available at March 2016.
Also released today:
National well-being measures dataset containing the latest data, time series data and detailed information on assessments of change as well as links to data sources
Static wheel summarising latest data and assessments of change
Interactive wheel of measures which includes charts showing available time series for all measures
Interactive charts showing the latest data for selected measures by region and country
3. Assessing change in national well-being
The Measuring National Well-being (MNW) programme set out to establish measures which would help people to understand national well-being, and also help monitor it. This report includes assessments showing the direction of change for each of the measures, whether they have improved, shown no overall change, or deteriorated. Comparisons have been made with the previous year’s data, or the previously published figure where year on year data are not available, as well as an assessment of change over a three year period. In future years, as more data become available, we will publish assessments of change over a longer time series.
Figure 1 summarises the assessments of change in measures of national well-being.
Figure 1: Assessments of change - National well-being measures
Source: Office for National Statistics
Notes:
- Measures of healthy life expectancy and feeling safe walking alone after dark are presented for both men and women, and so there are 43 measures to assess.
- Figures may not add to 100% due to rounding.
Download this chart Figure 1: Assessments of change - National well-being measures
Image .csv .xlsLooking at the most recent change:
- 40% (17 measures) had improved
- 30% (13 measures) showed no overall change
- 9% (4 measures) had deteriorated
- 21% (9 measures) were not assessed
Over the three year period:
- 40% (17 measures) had improved
- 26% (11 measures) showed no overall change
- 19% (8 measures) had deteriorated
- 16% (7 measures) were not assessed
A number of measures have not been assessed, either because data are not available for comparison, or where the direction of change is not a clear indication of either improvement or deterioration.
Individual measures of change can be viewed in the Wheel of measures . Details of how each measure has been assessed are available in the national well-being measures dataset.
It is recognised that the measures on which assessments of change have been made are headline measures and therefore only provide a snapshot of how national well-being is changing. There are many other measures that will affect national well-being that have not been considered here. However, it is hoped that assessing change in this way will help to signpost areas in need of closer evaluation and intervention.
Your opinions matter to us, and we would welcome your feedback on the way in which change has been assessed. Please email: nationalwell-being@ons.gov.uk
Back to table of contents4. Summary of Life in the UK, 2016
Overall national well-being has improved. Of the 41 measures, assessments of change show that 17 have improved while 8 have deteriorated and 11 have stayed the same over the 3 year period1.
Which areas of our lives have improved?
While improvements continue to be seen in personal well-being, with increases in the proportion reporting very high ratings for their overall life satisfaction, their happiness yesterday, the sense that things in our lives are worthwhile, and those reporting very low anxiety levels; the majority of improvements in national well-being have been seen in objective as opposed to subjective measures.
Areas of life which are getting better include our personal finances and the economy, where real median household income and net national disposable income have both risen and the unemployment rate has fallen. A fall in the proportion finding it difficult to get by also suggests we are less concerned than we were about our finances. In other areas of life, healthy life expectancy continues to rise for both men and women, the number of crimes against the person has fallen and more of us turned out to vote at the last general election than the previous one.
Improvements have also been seen across environmental measures. Greenhouse gas emissions have fallen, the extent of areas designated as ‘protected’ has grown and a growing proportion of us accessed the natural environment during the 3 year period examined. More energy has been consumed from renewable sources in the last year than in previous years and recycling rates have risen, but it is too early to say whether these are indicative of long term changes.
Which areas of our lives have deteriorated?
Not all areas of our lives are getting better and many of the measures assessed as having ‘deteriorated’ relate to our satisfaction with particular aspects. Despite increases in overall personal well-being, the proportions satisfied with their health, accommodation, household income and leisure time have all fallen over the three year period, though satisfaction with income and leisure time remain unchanged during the latest year. Population mental well-being scores also fell over the three year period as did the proportion who had a spouse or partner, family member or friend to rely on if they had a serious problem. Adult participation in sport has also fallen.
How sustainable is our future?
Looking at national stocks of things such as education, skills and competencies in the labour market (human capital) and the value of natural resources such as woodlands and rivers (natural capital), there is a mixed message about sustainability for the future. Human capital rose between 2013 and 2014, but remains below levels seen before the financial crisis and latest data for natural capital shows long term decline. Measures of these stocks are under development and work continues on the development of social capital.
A focus on sustainable development is gathering pace globally and nationally and we are set to play a key role in reporting and monitoring UK’s progress against sustainable development goal2 (SDGs). The SDGs were adopted at a United Nations summit in 2015, and we will be developing a framework and related indicators that will consider how best to align the SDGs and well-being agendas.
Notes:
- Comparisons have been made with data from 3 years ago, or nearest available where 3 year data are not available.
- See 'How sustainable is our future well-being' section.
5. How do we evaluate our own lives?
An individual’s thoughts and feelings about their own quality of life is an important aspect of well-being – both personal and national. How satisfied people are with their lives, their levels of happiness and anxiety, and whether or not they think the things they do are worthwhile all have strong links with many elements of well-being, for example, people’s health, employment and relationships.
What’s changed?
Table 1: Assessments of change – Personal well-being
| UK | |||
| Latest data | 1 year | 3 year | |
| Very high rating of satisfaction with their lives overall1 | 28.8% (2014/15) | Improved | Improved |
| Very high rating of how worthwhile the things they do are1 | 34.4% (2014/15) | Improved | Improved |
| Rated their happiness yesterday as very high1 | 34.1% (2014/15) | Improved | Improved |
| Rated their anxiety yesterday as very low1 | 40.9% (2014/15) | Improved | Improved |
| Population mental well-being2 | 24.6/35 (2012/13) | Not assessed | Deteriorated |
| Source: Office for National Statistics | |||
| Notes: | |||
| 1. The very high ratings of life satisfaction, worthwhile and happiness are defined as ratings of 9 or 10 out of 10. Very low anxiety is defined as ratings of 0 or 1 out of 10. | |||
| 2. Short Warwick – Edinburgh Mental Well-being Scale (SWEMWBS) is used to calculate population mental well-being. | |||
Download this table Table 1: Assessments of change – Personal well-being
.xls (27.1 kB)Personal well-being has improved
The 4 measures of personal well-being that we produce are, how satisfied people feel with their lives, how worthwhile they feel the things they do are, how happy they were yesterday and how anxious they felt yesterday. The proportion of those aged 16 and over that gave the highest ratings for all 4 measures in the financial year ending 2015 significantly increased compared with the previous year, and with the financial year ending 2012, as shown in Figure 2.
Between the financial years ending 2014 and 2015, those reporting the highest ratings of life satisfaction increased 2.0 percentage points, to 28.8%. This was closely followed by ratings of how worthwhile the things people do are, which increased by 1.9 percentage points to 34.4%. The proportion of people reporting the highest levels of happiness, and lowest levels of anxiety increased by 1.5 percentage points to 34.1%, and 40.9% respectively.
Improvement across all 4 measures suggests that more people in the UK are feeling positive about their lives than in the financial year ending 2014. The Personal Well-being in the UK, 2014/15 statistical bulletin discusses these measures in more detail.
Over the same period, there were significant reductions in the proportions of people giving the lowest ratings of happiness (down 0.8 percentage points to 8.9%), life satisfaction (down 0.8 percentage points to 4.8%), worthwhile (down 0.4 percentage points to 3.8%), and the highest ratings of anxiety (down 0.6 percentage points to 19.4%), (Figure 2).
Figure 2: Percentages rating personal well-being at highest and lowest levels, financial years ending 2012 to 20151
UK

Source: Annual Population Survey Personal Well-being National Statistics dataset, Office for National Statistics
Notes:
- Adults aged 16 and over were asked 'Overall, how satisfied are you with your life nowadays?', 'Overall, to what extent do you feel the things you do in your life are worthwhile?', 'Overall, how happy did you feel yesterday?' and 'Overall, how anxious did you feel yesterday?' where 0 is 'not at all' and 10 is 'completely'.
Download this image Figure 2: Percentages rating personal well-being at highest and lowest levels, financial years ending 2012 to 2015^1^
.png (26.3 kB) .xls (29.2 kB)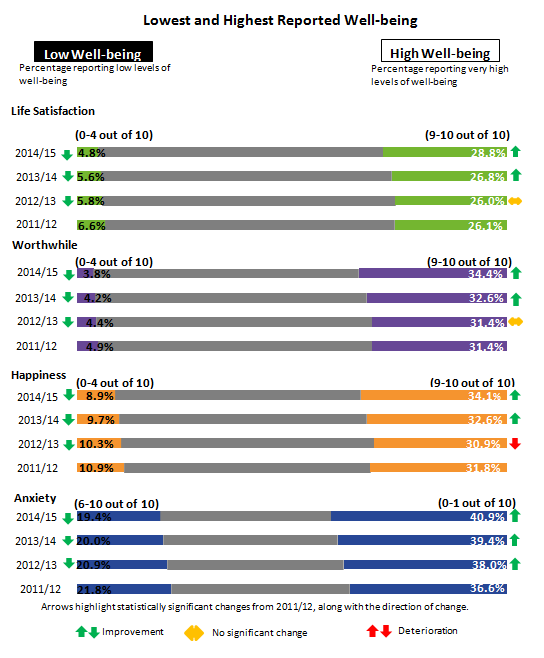
6. How important are the relationships we have?
The nature of our relationships has an important influence on our personal well-being. Strong relationships may help in contributing to a long, healthy and happy life. An article “What matters most to Personal Well-being” published by us in 2013 showed that when taking other circumstances into consideration – relationships are one of the strongest drivers of personal well-being. An article we published in 2015 also showed that children’s relationships with their parents are important and can have an influence on children’s mental health. Conversely poor quality relationships or loneliness can have a negative effect on our health and well-being, and this may have important implications for policy makers.
What’s changed?
Table 2: Assessments of change – Our relationships
| UK | |||
| Latest data | 1 year | 3 year | |
| Average rating of satisfaction with family life | 8.2/10 (2011) | Not assessed | No overall change |
| Average rating of satisfaction with social life | 7.1/10 (2011) | Not assessed | No overall change |
| Has a spouse or partner, family member or friend to rely on if they have a serious problem | 84.1% (2013/14) | Not assessed | Deteriorated |
| Source: Office for National Statistics | |||
Download this table Table 2: Assessments of change – Our relationships
.xls (28.2 kB)How good are our relationships?
No change in average rating of satisfaction with family life and social life between 2007 and 2011
Obtaining and maintaining the correct balance between working life and home life can be beneficial to an individual’s well-being. Average ratings of satisfaction with family life and social life have remained broadly unchanged since 2003. In 2011, adults aged 18 and over in the UK scored their satisfaction with family life as 8.2 out of 101 (on average) and 7.1 out of 10 for satisfaction with their social life. These ratings showed no overall change since the previous survey in 2007 indicating that the economic downturn in 2008 may not have had an effect on people’s family and social life (European Quality of Life Survey, Eurofound).
An article published by us about inequalities in social capital2 showed that those in their middle years rated their satisfaction with family and social life lower on average than other age groups. A U-shape was observed for satisfaction with family life, with those aged 35 to 54 being the least satisfied with their family life on average (7.9 out of 10) in the financial year ending 2012. Those aged 75 and over had the highest average rating (8.8 out of 10) of all age groups for satisfaction with family life. This U-shape was more marked for satisfaction with social life, with those aged 45 to 54 rating their satisfaction with social life at 6.3 out of 10 on average. Those aged 18 to 24 had the highest average rating (8.0 out of 10).
The proportion with someone to rely on fell between 2011 and 2014
There is a saying, “a problem shared is a problem halved” – so having someone to turn to for company and support in times of need is essential for a person’s well-being. Over 8 in 10 people (84.1%) aged 16 and over in the UK had a spouse or partner, family member or friend to rely on if they had a serious problem in the financial year ending 2014; a deterioration from 3 years earlier (86.4%). Having someone to rely on varied by age – in the financial year ending 2014, 88.7% of people aged 65 and over had someone to rely on compared with 76.3% of those aged 16 to 24 (Understanding Society, the UK Household Longitudinal Survey).
Loneliness has an impact on a person’s well-being and a range of personal circumstances such as poor health, living alone and a lack of a support network are factors contributing to feelings of loneliness. We recently published an article about loneliness and its effects on older people and their well-being, which showed that those who reported being lonely were 7 times more likely to have low life satisfaction.
How do our relationships affect our personal well-being?
A higher proportion of married people in the UK reported a very high rating (9 to 10 out of 10) of life satisfaction compared with others between April 2014 and March 2015 (Figure 3). Over a third (34.7%) of people who were married or in a civil partnership rated their level of life satisfaction as very high compared with 28.9% of those who were widowed or a surviving civil partner, or those who lived with their partner. People who were separated or divorced emerged as the least satisfied, with only 19.5% rating their life satisfaction as very high – lower than those who were single (21.9%). People who were married were also the least likely to report low life satisfaction. Just 2.8% rated low life satisfaction (0 to 4 out of 10), compared with 3.2% of cohabitees, 6.2% of single people, 7.2% of widows or surviving civil partners, and 10.4% of divorcees.
Figure 3: Life satisfaction1: by marital status, April 2014 to March 2015
UK
Source: Annual Population Survey Personal Well-being National Statistics dataset, Office for National Statistics
Notes:
- Adults aged 16 and over were asked "Overall, how satisfied are you with your life nowadays?'' where 0 is 'not at all' and 10 is 'completely'.
Download this chart Figure 3: Life satisfaction^1^: by marital status, April 2014 to March 2015
Image .csv .xlsNotes:
Using a scale from 1 to 10 where 1 indicates “very dissatisfied” and 10 indicates “very satisfied”.
In general terms, social capital represents social connections and all the benefits they generate.
7. How good is our health?
According to the What Works Centre for Wellbeing Public Dialogues Report, people believe good physical and mental health is at the heart of well-being. This supports our earlier analysis which found that when all other factors are held equal, people’s assessment of their health is the factor that is most closely linked to their personal well-being .
The World Health Organisation defines health as "a state of complete physical, mental, and social well-being and not merely the absence of disease or infirmity." If an individual is in good health they are more likely to be in employment, to take up exercise and have an active social life, which in turn will improve their overall well-being. However, the same can be said of those that have high levels of well-being, as they are more likely to have positive health behaviours which will encourage good health.
What’s changed?
Table 3: Assessments of change – Health
| UK | |||
| Latest data | 1 year | 3 year | |
| Healthy life expectancy at birth - Male | 64.2 (2009–11) | Improved | Improved |
| Healthy life expectancy at birth - Female | 66.1 (2009–11) | Improved | Improved |
| Somewhat, mostly or completely satisfied with health | 57.8% (2013/14) | Deteriorated | Deteriorated |
| Percentage with some evidence indicating depression or anxiety | 19.7% (2013/14) | Deteriorated | No overall change |
| Percentage who reported a long-term illness and/or disability | 17.2% (Oct to Dec 2015) | Not assessed | Not assessed |
| Source: Office for National Statistics | |||
Download this table Table 3: Assessments of change – Health
.xls (26.6 kB)Does how healthy we feel affect our personal well-being?
There is a clear relationship between how people rate their health and how they rate their personal well-being.
Figure 4: Very high levels of life satisfaction1: by self-reported health, April 2014 to March 2015
UK
Source: Annual Population Survey Personal Well-being National Statistics dataset, Office for National Statistics
Notes:
- Adults aged 16 and over were asked 'Overall, how satisfied are you with your life nowadays?' where 0 is 'not at all' and 10 is 'completely'. Very High life satisfaction is defined as those that reported a rating of 9 or 10 out of 10.
Download this chart Figure 4: Very high levels of life satisfaction^1^: by self-reported health, April 2014 to March 2015
Image .csv .xlsAdults in the UK who reported very good or good ratings of self reported health, had higher proportions of very high life satisfaction when compared with those who reported bad or very bad ratings of self-reported health in the financial year ending 2015 (Figure 4). Of those that considered themselves to be in very good health, 37.3% rated their life satisfaction as very high, compared with 11.1% of those that reported they were in very bad health.
Healthy life expectancy at birth has increased to 64.2 for males and 66.1 for females
During the period 2009 to 2011 the healthy life expectancy for males at birth in the UK was 64.2 years, which was an improvement on the previous period (2006 to 2008) when it was 62.5 years. During the same period, female healthy life expectancy at birth also improved from 64.2 years to 66.1 years.
Figure 5: Male and female healthy life expectancy at birth between 2000 to 2002 and 2009 to 2011
UK
Source: Office for National Statistics
Download this chart Figure 5: Male and female healthy life expectancy at birth between 2000 to 2002 and 2009 to 2011
Image .csv .xlsThe healthy life expectancy for both males and females has been increasing since 2000 to 2002 (Figure 5). The gap between the sexes in 2009 to 2011 healthy life expectancy at birth was 1.9 years, with females expected to live more years in “good” health than their male counterparts.
Satisfaction with health has fallen
The proportion of people aged 16 and over in the UK who were somewhat, mostly or completely satisfied with their health was lower in the financial year ending 2014 (57.8%) than in the previous year (59.3%). The way in which people view their health is crucial to well-being. Although we are living longer healthier lives, we are less satisfied with our health. This highlights the importance of considering how people are feeling, for example, their satisfaction with health alongside measures such as healthy life expectancies.
Those aged 75 and over, and between 45 and 54, had the lowest proportions of people satisfied with their health, 50.7% and 54.7% respectively. Almost two-thirds (66.0%) of young people aged 16 to 24 were somewhat, mostly or completely satisfied with their health, with 15.2% reporting that they were completely satisfied with their health. As people get older they tend to develop more health problems, so the fact that those aged 75 and over have the lowest proportion satisfied with their health is not unexpected.
Figure 6: Satisfaction with health1: by age, April 2013 to March 2014
UK
Source: Understanding Society, UK Household Longitudinal Study
Notes:
- Adults aged 16 and over were asked to rate their satisfaction with their general health on a scale from completely dissatisfied to completely satisfied. The chart above includes those that stated somewhat, mostly and completely satisfied.
Download this chart Figure 6: Satisfaction with health^1^: by age, April 2013 to March 2014
Image .csv .xlsFigure 6 shows that the proportion of 45 to 54 and 55 to 64 year olds that were somewhat, mostly or completely satisfied with their health was lower than those aged 65 to 74. Although these differences aren’t large enough to be classified as “significant” (i.e. the differences between the age groups could be down to chance), they follow a similar trend to the recently published personal well-being data. This showed that the age group that was least satisfied with their life overall was 45 to 54. Suggested reasons for lower life satisfaction amongst this age group included managing the home, balancing work and family commitments and caring for parents and children. These reasons could also be behind a lower proportion reporting feeling somewhat, mostly or completely satisfied with their health.
Increase in the proportion indicating some depression or anxiety
In the financial year ending 2014 the proportion of people aged 16 and over in the UK that showed some evidence of anxiety or depression, according to the General Health Questionnaire (GHQ-12) increased to 19.7%, from 18.3% in the previous year. Mental health is a factor that affects well-being. People with positive mental health will feel good about themselves, and will feel they are better equipped to cope with their problems, whereas those people that indicate depression or anxiety may find this more challenging. This will undoubtedly impact on personal and therefore national well-being.
A higher proportion of women (22.5%) than men (16.8%) indicated they had some feelings of depression or anxiety in the financial year ending 2014. The age group with the highest proportion indicating depression or anxiety was 45 to 54 year olds (22.8%), whereas the lowest was those aged 65 to 74 (14.4%) (Understanding Society, UK Household Longitudinal Study).
A recent report published by NHS England outlined that prevention of mental health problems should be made a priority. Carers, health care professionals and those that have lived with mental health problems highlighted that amongst other areas, ensuring good overall physical and mental health and well-being will assist in the prevention of mental health problems.
The World Happiness Report cites research that found over half of children who have a mental health problem will suffer from mental ill-health as adults, therefore it is important to tackle the issue as early in life as possible. It also explains that mental health problems such as depression can be more disabling than physical problems such as arthritis or asthma. In a recent publication we found that children who spent 3 or more hours on social media a day were more likely to report mental ill-health symptoms. The report also provides more in depth analysis of children’s well-being.
Back to table of contents8. How do we spend our time and are we satisfied with its use?
What we do in life shapes our lifestyles, our relationships with others and our well-being. People have many different lifestyles based on individual choices, characteristics, personal preferences and circumstances. Individuals divide their time between various tasks and activities, including paid or unpaid employment, volunteering and numerous leisure activities.
What’s changed?
Table 4: Assessments of change – What we do
| UK (unless otherwise specified) | |||
| Latest data | 1 year | 3 year | |
| Unemployment rate | 5.1% (Nov 2015 to Jan 2016) | Improved | Improved |
| Somewhat, mostly or completely satisfied with their job | 78% (2013/14) | No overall change | No overall change |
| Volunteered more than once in the last 12 months | 17.4% (2012/13) | No overall change | Not assessed |
| Somewhat, mostly or completely satisfied with their amount of leisure time | 57.2% (2013/14) | No overall change | Deteriorated |
| Engaged with/participated in arts or cultural activity at least 3 times in last year (England) | 82.4% (2014/15) | No overall change | No overall change |
| Adult participation in 30 minutes of moderate intensity sport, once per week (England) | 35.8% (Oct 2014 to Sep 2015) | No overall change | Deteriorated |
| Source: Office for National Statistics | |||
Download this table Table 4: Assessments of change – What we do
.xls (40.4 kB)The unemployment rate has fallen
In the 3 months to January 2016, the unemployment rate1 was 5.1%; an improvement on both a year earlier (5.7%) and November to January 2013 (7.8%) (Figure 7). The annual decrease was equivalent to 171,000 people. There is strong evidence that work is good for physical and mental health and well-being2. In the 3 months to January 2016, the proportion aged 16 to 64 in work grew from 73.3% to 74.1%, equivalent to 478,000 people compared with a year earlier.
Figure 7: Unemployment rate1, seasonally adjusted, November to January 2011 to November to January 2016
UK
Source: Labour Force Survey, Office for National Statistics
Notes:
- The unemployment rate is calculated as the number of unemployed people aged 16 and over divided by the economically active population for that age group.
Download this chart Figure 7: Unemployment rate^1^, seasonally adjusted, November to January 2011 to November to January 2016
Image .csv .xlsNo change in satisfaction with jobs
Job satisfaction is considered a strong predictor of overall individual well-being. In the financial year ending 2014, nearly 8 in 10 (78.0%) adults aged 16 and over in the UK reported that they were somewhat, mostly or completely satisfied with their job. This was broadly unchanged since the financial year ending 2013 (77.6%) and the financial year ending 2011 (78.5%). Just over 1 in 10 (12.7%) adults reported being somewhat, mostly or completely dissatisfied with their job in the financial year ending 2014 (Understanding Society, the UK Household Longitudinal Survey).
No change in the proportion volunteering
Volunteering may have benefits for an individual’s health and well-being and can make a difference to the lives of other people, the community or the environment. In the financial year ending 2013, 17.4% of people aged 16 and over in the UK did some sort of unpaid help or volunteering several times a year or more in the 12 months prior to interview. This was broadly unchanged from the financial year ending 2011 (16.7%) (Understanding Society, the UK Household Longitudinal Survey).
According to our analysis, the value of frequent volunteering (those who volunteered at least once a month) was £23.9 billion in the financial year ending 2013.
No change in satisfaction with amount of leisure time, following a deterioration between 2011 and 2014
The amount and quality of leisure time is important for people’s well-being for the direct satisfaction it brings. Over half (57.2%) of adults aged 16 and over were somewhat, mostly or completely satisfied with their amount of leisure time in the financial year ending 2014 – no overall change from a year earlier (58.2%), and a deterioration since the financial year ending 2011 (60.9%). Over a quarter (27.8%) reported that they were somewhat, mostly or completely dissatisfied with their amount of leisure time in the financial year ending 2014 (Understanding Society, the UK Household Longitudinal Survey).
No change in participation in sports, arts and culture
A report “Quantifying and Valuing the Well-being Impacts of Culture and Sport” published in 2014 by the Department for Culture, Media and Sport identified statistically significant associations between cultural and sport engagement and individual well-being and a range of other social impacts.
Over 8 in 10 (82.4%) adults aged 16 and over in England engaged with, or participated in, arts or cultural activity3 at least 3 times in the year prior to interview in the financial year ending 2015 (Taking Part Survey, Department for Culture, Media and Sport).
Between October 2014 and September 2015, over a third (35.8%) of adults aged 16 and over in England participated in at least 30 minutes of sport at moderate intensity at least once a week, equivalent to 15.7 million people. This was broadly unchanged from a year earlier (36.1%) but a deterioration since October 2011 to October 2012 (36.9%). Between October 2014 and September 2015, more than half (57.4%) of adults did not participate in at least 30 minutes of moderate intensity sport on a regular basis. Men were more likely than women to participate once a week (40.7% and 31.2% respectively). When analysed by age group over the same period, 55.2% aged 16 to 25 participated once a week compared with 32.1% aged 26 and over (Active People Survey, Sport England).
The amount and quality of leisure time is also important for children’s well-being. We published an article in 2015 which explored sports participation and engagement and participation in arts or cultural activity among children. The report showed that almost all children (96.7%) had engaged with or participated in arts or cultural activities at least 3 times in the last year. Most (75.7%) had done so at least once in the last week. In 2014 to 2015, 8 in 10 (78.2%) children had participated in sport in the last week. Almost 7 out of 10 (69.1%) children aged 5 to 10 years and 9 out of 10 (89.5%) children aged 11 to 15 years had participated in sport.
How does our economic activity affect life satisfaction?
“Public Dialogues”, a report published by What Works Centre for Well-being stated that, “The main value of work for many is financial security, stability and feeling safe. At its best work and learning can bring achievement and opportunity.” To boost the number of jobs and create a flexible labour market, the government has a number of policies including modernising employment law and providing job search support.
Figure 8: Life satisfaction1: by economic activity, April 2014 to March 2015
UK
Source: Annual Population Survey Personal Well-being National Statistics dataset, Office for National Statistics
Notes:
- Adults aged 16 and over were asked "Overall, how satisfied are you with your life nowadays?", where 0 is "not at all" and 10 is "completely".
Download this chart Figure 8: Life satisfaction^1^: by economic activity, April 2014 to March 2015
Image .csv .xlsA higher proportion of economically inactive4 people in the UK reported a very high rating (9 or 10 out of 10) of life satisfaction (32.4%), compared with those who were either in employment (27.3%) or unemployed (18.8%) between April 2014 and March 2015 (Figure 8). The economically inactive group contain a larger proportion of people who are retired or do not need to work, for example, because they are in full-time education. These individuals might have more free time to spend on activities which promote their well-being such as pursuing a pastime. However, those in employment were the least likely to report low life satisfaction. Just 2.9% rated low life satisfaction (0 to 4 out of 10), compared with 12.5% of those unemployed and 6.9% who were economically inactive (Annual Population Survey, Office for National Statistics).
Notes:
The unemployment rate is calculated as the number of unemployed people aged 16 and over divided by the economically active population for that age group.
Gordon Waddell, A Kim Burton - Is Work Good for your Health and Well-being?
This covers engagement or participation in the arts (excluding reading for pleasure), museums and galleries, libraries, archives and heritage sites.
The economically inactive are defined as people who are not in employment or unemployed. These include retirement, being in full-time education, being ill or disabled and unable to work, looking after a home or family, being a carer of another adult, or simply not needing to work which means that they are not participating in the labour market, but their reasons for not doing so are quite diverse as are their circumstances.
9. How do we feel about where we live?
Positive feelings about where we live can create a strong, inclusive community where people feel that they belong, and where they feel safe. In turn communities that are strong are more likely to deliver higher rates of social and civic participation, lower rates of crime, and improved physical and mental health among its inhabitants.
What’s changed?
Table 5: Assessments of change – Where we live
| UK (unless otherwise specified) | |||
| Latest data | 1 year | 3 year | |
| Agreed/agreed strongly they felt they belonged to their neighbourhood | 63.3% (2011/12) | Deteriorated | Not assessed |
| Felt fairly/very safe walking alone after dark (men) (England and Wales) | 85.8% (2014/15) | No overall change | No overall change |
| Felt fairly/very safe walking alone after dark (women) (England and Wales) | 61.7% (2014/15) | Improved | Deteriorated |
| Crimes against the person (per 1,000 adults) (England and Wales) | 57 (2014/15) | Improved | Improved |
| Fairly/very satisfied with their accommodation (England) | 89.2% (2013–14) | Deteriorated | Deteriorated |
| Households with good transport access to key services or work (2011 = 100) (England) | 106 (2013) | No overall change | No overall change |
| Accessed natural environment at least once a week in the last 12 months (England) | 59% (2014/15) | No overall change | Improved |
| Source: Office for National Statistics | |||
Download this table Table 5: Assessments of change – Where we live
.xls (29.7 kB)Proportion feeling they belong to their neighbourhood has fallen
In the financial year ending 2012, over 6 in 10 (63.3%) people aged 16 and over in the UK agreed or strongly agreed that they belonged to their neighbourhood, a deterioration from financial year ending 2010 (66.0%).
The proportion of people who reported belonging to their neighbourhood increased with age. Just under half (49.0%) of those aged 16 to 24 agreed or strongly agreed that they belonged to their neighbourhood compared with 81.1% of those aged 75 and over (Understanding Society, the UK Household Longitudinal Study).
In July 2015 we published an analysis of social capital in the UK which includes other aspects of belonging to a neighbourhood such as trust and social networks.
Proportion feeling safe after dark has increased for women but not men
Feeling safe in the local neighbourhood can be an important factor for a person’s sense of satisfaction in the area around them. A good indicator of this is to find out whether a person feels safe walking alone after dark in their local area. In the year ending March 2015, 85.8% of men and 61.7% of women aged 16 and over in England and Wales reported that they felt fairly or very safe walking alone after dark. Compared with the year ending March 2014, this represented no change for men (85.1%) but a significant improvement for women (58.0%) (Crime Survey for England and Wales, Office for National Statistics).
Number of crimes against the person (per 1,000 adults) has fallen
Crime can have an impact on a person’s mental and physical health due to limited activity and can affect a person’s well-being due to isolation or limited social cohesion. In the year ending March 2015, there were an estimated 57 personal crimes per 1,000 adults aged 16 and over in England and Wales. This was an improvement on the previous year (66 per 1,000 adults) and an improvement since the year ending March 2012 (82 per 1,000 adults) (Crime Survey for England and Wales, Office for National Statistics).
Proportion of households satisfied with their accommodation has fallen
Just under 9 in 10 (89.2%) households in England in the financial year ending 2014 reported that they were very or fairly satisfied with their accommodation, a deterioration from a year earlier (90.6%) and since the financial year ending 2011 (90.8%). Variations exist by tenure. Our analysis in 2015 showed that personal well-being is higher among households who owned their own home than those who rented.
In the financial year ending 2014, 93.8% of owner-occupiers said that they were very or fairly satisfied with their accommodation while 3.3% stated they were slightly or very dissatisfied. In comparison, 80.6% of social renters and 81.8% of private renters were either very or fairly satisfied (English Housing Survey, Department for Communities and Local Government).
Travel time to key services
The proximity of housing to a range of employment, services and facilities, as well as public transport infrastructure could have a bearing on the satisfaction level with the area in which people live and in turn contribute to their well-being.
The average minimum travel time across England to a selection of 8 key services1 in 2014 by public transport or walking was 17 minutes. However, there was considerable variation in these times between those living in urban areas (15 minutes) and those living in rural areas (27 minutes).
Looked at in more detail, the average minimum travel time to the nearest service by public transport or walking was lowest for food stores and primary schools (9 minutes) and highest for hospitals (37 minutes). (Department for Transport Journey Time Statistics).
6 in 10 of us visit the outdoors for leisure at least once a week
Access to a park or green space can have wide-ranging benefits for our health and well-being. Stakeholders in the “What Works Centre for Well-being” community well-being evidence programme reported that nature and green or open space were one of the factors that contributed to making “a good place”.
In the financial year ending 2015, nearly 6 in 10 (59%) of adults aged 16 and over in England reported that they visited the outdoors for leisure, away from home, at least once a week in the 12 months prior to interview. There was no overall change from a year earlier (58%) but an improvement since the financial year ending 2012 (55%). While 13% reported that they visited on a daily basis, nearly 1 in 10 (8%) stated that they had not visited the outdoors in the previous 12 months (Monitor of engagement with the Natural Environment, Natural England2).
Does visiting the natural environment affect our well-being?
Various studies have demonstrated associations between access to local green space and population health and well-being. People living in areas with high quantities of green space have been found to have better health, as measured using both self-reported data from surveys, and records of morbidity and mortality rates (Maas et al., 2006, 2009; Mitchell and Popham, 2007, 2008).
Figure 9a: Average life satisfaction ratings1 by visits to the natural environment2, April 2013 to March 2014
England
Source: Monitor of engagement with the Natural Environment, Natural England
Notes:
- Adults aged 16 and over were asked 'Overall, how satisfied are you with your life nowadays?', where 0 is 'not at all' and 10 is 'completely'. Does not include those who reported 'don't know'.
- People responding that they spent leisure time out of doors away from home more than once per day, every day, or several times a week, were classed as most regular visitors; people responding with once a week or once or twice a month were classed as less regular visitors; and people responding with once every 2 to 3 months, once or twice, or never were classed as least regular visitors.
Download this chart Figure 9a: Average life satisfaction ratings^1^ by visits to the natural environment^2^, April 2013 to March 2014
Image .csv .xlsFigure 9b: Average worthwhile ratings1 by visits to the natural environment2, April 2013 to March 2014
England
Source: Monitor of engagement with the Natural Environment, Natural England
Notes:
- Adults aged 16 and over were asked 'Overall, to what extent do you feel the things you do in your life are worthwhile?', where 0 is 'not at all' and 10 is 'completely'. Does not include those who reported 'don't know'.
- People responding that they spent leisure time out of doors away from home more than once per day, every day, or several times a week, were classed as most regular visitors; people responding with once a week or once or twice a month were classed as less regular visitors; and people responding with once every 2 to 3 months, once or twice, or never were classed as least regular visitors.
Download this chart Figure 9b: Average worthwhile ratings^1^ by visits to the natural environment^2^, April 2013 to March 2014
Image .csv .xlsFigure 9c: Average happiness ratings1 by visits to the natural environment2, April 2013 to March 2014
England
Source: Monitor of engagement with the Natural Environment, Natural England
Notes:
- Adults aged 16 and over were asked 'Overall, how happy did you feel yesterday?', where 0 is 'not at all' and 10 is 'completely'. Does not include those who reported 'don't know'.
- People responding that they spent leisure time out of doors away from home more than once per day, every day, or several times a week, were classed as most regular visitors; people responding with once a week or once or twice a month were classed as less regular visitors; and people responding with once every 2 to 3 months, once or twice, or never were classed as least regular visitors.
Download this chart Figure 9c: Average happiness ratings^1^ by visits to the natural environment^2^, April 2013 to March 2014
Image .csv .xlsFigure 9d: Average anxiety ratings1 by visits to the natural environment2, April 2013 to March 2014
England
Source: Monitor of engagement with the Natural Environment, Natural England
Notes:
- Adults aged 16 and over were asked 'Overall, how anxious did you feel yesterday?' where 0 is 'not at all' and 10 is 'completely'. Does not include those who reported 'don't know'.
- People responding that they spent leisure time out of doors away from home more than once per day, every day, or several times a week, were classed as most regular visitors; people responding with once a week or once or twice a month were classed as less regular visitors; and people responding with once every 2 to 3 months, once or twice, or never were classed as least regular visitors.
Download this chart Figure 9d: Average anxiety ratings^1^ by visits to the natural environment^2^, April 2013 to March 2014
Image .csv .xlsIn the financial year ending 2014 (the latest data available) the most regular visitors to the natural environment in the 12 months prior to interview had significantly higher levels of personal well-being (life satisfaction, worthwhile, happiness and anxiety) than those who visited less regularly (Figures 9a to d).
However, the relationship may be merely associative and whether frequency of visiting natural environments influences well-being or having higher well-being causes more natural environment visits is unclear.
Notes:
The Department for Transport measures access to 8 key services in England by public transport, walking, and other modes of transport that are used in accessibility planning by local authorities. The 8 key services are: Employment centres; primary schools; secondary schools; further education institutions; GPs; hospitals; food stores; and town centres.
Similar data for Scotland are available from Scotland's People and Nature Survey and for Wales from the Welsh Outdoor Recreation Survey.
10. How are we coping financially?
Personal well-being is strongly related to the levels of wealth and income of the household in which a person lives according to our research. The National Debate on Measuring National Well-being illustrated that personal finance can have a significant impact on people's sense of well-being. One response during the debate stated; “It's not about having millions of pounds, but working and earning a good amount to keep myself and any future family I have safe and well".
What's changed?
Table 6: Assessments of change – Personal finance
| UK (unless otherwise specified) | |||
| Latest data | 1 year | 3 year | |
| Percentage who were somewhat, mostly or completely satisfied with the income of their household | 53.7% (2013/14) | No overall change | Deteriorated |
| Percentage who report finding it quite or very difficult to get by financially | 9.1% (2013/14) | Improved | Improved |
| Median wealth per household, including pension wealth (Great Britain) | £225,100 (July 2012 to June 2014) | Not assessed | Not assessed |
| Real median household income | £25,660 (2014/15) | Improved | Improved |
| Percentage of individuals living in households with less than 60% of median income after housing costs | 21% (2013/14) | No overall change | No overall change |
| Source: Office for National Statistics | |||
Download this table Table 6: Assessments of change – Personal finance
.xls (26.6 kB)Smaller proportion were satisfied with the income of their household in financial year ending 2014 than in financial year ending 2011
In the financial year ending 2014, the percentage of people aged 16 and over in the UK that were somewhat, mostly, or completely satisfied with their level of income was broadly unchanged at 53.7% when compared with the year earlier (53.4%). However, over the 3 year period (financial year ending 2011 to financial year ending 2014) the proportion of those satisfied with their income decreased from 57.2% to 53.7%. Satisfaction with income fell steadily between 2007 and the financial year ending 2011, and was followed by a 4.5 percentage point drop in the financial year ending 2012. While the increase in the financial years ending 2013 and 2014 shows some improvement in this trend, it remains below the levels seen prior to the economic downturn in 2008.
Satisfaction with income varies with age. As people get older they are more likely to have paid off their mortgage and have less expenditure each month, which could impact on their attitude towards their income. Figure 10 shows that in the financial year ending 2014, there was a larger proportion of those 75 and over who were satisfied with their level of income (67.8%) compared with any other age group. For the same year, 45 to 54 year olds had a significantly lower proportion satisfied with their income (47.1%) when compared with all people aged 16 and over (53.7%).
Figure 10: Somewhat, mostly or completely satisfied with the income of their household: by age, April 2013 to March 2014
UK
Source: Understanding Society, UK Household Longitudinal Study
Download this chart Figure 10: Somewhat, mostly or completely satisfied with the income of their household: by age, April 2013 to March 2014
Image .csv .xlsSmaller proportion finding it quite or very difficult to get by financially in financial year ending 2014 than in financial year ending 2011
Around 1 in 10 (9.1%) people aged 16 and over in the UK reported finding it quite or very difficult to get by financially in the financial year ending 2014. This was 1.0 percentage point lower than a year earlier and 2.5 percentage points lower than 3 years earlier, continuing the downward trend since it peaked at 12.3% in the financial year ending 2010. Despite falling in recent years, the proportion of individuals that report finding it difficult to get by financially remains above pre-economic downturn levels, which in 2007 was 6.0% (Understanding Society, the UK Household Longitudinal Study).
Top 10% of households hold around 45% of all household wealth
The median household wealth for Great Britain, including pension wealth, was £225,100 between July 2012 and June 2014 compared with £216,500 between July 2010 and June 2012 according to the Wealth and Assets Survey. The distribution of wealth is highly skewed, with the top 10% of households holding around 45% of all household wealth. As a result, the wealth of individual households varies considerably. Belonging to the wealthiest 10% of households required total wealth greater than £1,048,500. To be in the bottom 10% of the distribution, a household’s value of total wealth needed to be less than £12,600.
Figure 11: Distribution of household wealth including pension wealth1: by region, July 2012 to June 2014
Great Britain
Source: Wealth and Assets Survey, Office for National Statistics
Notes:
- Excludes assets held in trusts (except Child Trust Funds) and any business assets held by households. Based on individual responses within households.
Download this chart Figure 11: Distribution of household wealth including pension wealth^1^: by region, July 2012 to June 2014
Image .csv .xlsMedian total household wealth in the South East and South West of England was more than double that in the North East of England in the period July 2012 to June 2014 (Figure 11). The South East of England’s median was around £192,000 greater than the North East’s median.
Across Great Britain in the same period, the North East of England and Yorkshire and The Humber had the lowest median total household wealth, at £150,000 and £173,000 respectively. The greatest median total household wealth was in the South East of England, at £342,400, followed by the South West at £308,800 and the East of England at £267,200.
Real median household disposable income has improved
The median household disposable income1 in the UK for the financial year ending 2015 has increased to £25,700, compared with £24,800 (in 2014/15 prices) in the previous year.
Median household income is the income of the middle household if all households are ranked from the lowest income to the highest, and therefore it gives an indication of the income of the “typical” household.
Median household disposable income in the UK in the financial year ending 2015 is £1,500 higher than its recent low in the financial year ending 2013, after accounting for inflation and household composition, and is at a similar level to its pre-downturn value in the financial year ending 2007 (£25,400). (National Accounts, Office for National Statistics).
Percentage of those living in households with less than 60% of median income after housing costs remains unchanged
The proportion of individuals in the UK living in households with less than 60% of median income after housing costs was broadly unchanged between the financial years ending 2009 and 2014, with around 1 in 5 (21%) doing so in 2014. The proportion has been on a general downward trend since the financial year ending 1999, dropping 3 percentage points between financial years ending 1999 and 2014 (Family Resources Survey, Department for Work and Pensions).
Notes:
- Adjusted for price changes to allow for comparison over time
11. How strong is our economy?
The economy makes an important contribution to national well-being. Financial stability and low inflation are important for economic growth. Without financial stability, banks are more reluctant to finance profitable projects which in turn affect jobs and wages.
Change in Gross Domestic Product (GDP) is an accepted measure of economic progress and, for many years, has been used as a key indicator for “how society is doing”. However, it has long been recognised that GDP does not capture everything that determines society’s well-being, nor was it designed to do so. We publish a quarterly economic well-being article that presents a set of economic indicators designed to give a broader picture of the economy from the individual and household perspective to supplement GDP.
What's changed
Table 7: Assessments of change – Economy
| UK | |||
| Latest data | 1 year | 3 year | |
| Real net national disposable income per head | £22,786 (2014) | Improved | Improved |
| UK public sector net debt as a percentage of Gross Domestic Product | 83.7% (2014/15) | Not assessed | Not assessed |
| Inflation rate (as measured by the Consumer Prices index) | 0.3% (January 2016) | Not assessed | Not assessed |
| Source: Office for National Statistics | |||
Download this table Table 7: Assessments of change – Economy
.xls (27.6 kB)Real net national disposable income has improved
Net national disposable income (NNDI) adjusts GDP to reflect the income available to residents of the country from production (at home or abroad). This measure includes income that is available to businesses and the government, as well as households.
In 2014, real (adjusted for inflation) NNDI per head was £22,786, an improvement on 2013 (£22,463) and 2011 (£22,487). Looking over the last decade, real NNDI per head peaked at £23,503 in 2007, and was at its lowest in 2009 at £21,889 (Office for National Statistics).
UK public sector net debt as a percentage of GDP has more than doubled since 2008
A high level of government borrowing will result in money having to be spent repaying that debt. This can lead to both a reduction in investment and a requirement on future generations to continue paying off these debts, which could in turn have a negative impact on national well-being. However, public sector debt increases are not necessarily bad for national well-being. For example, a government may borrow to invest in infrastructure projects or training that will benefit individuals and businesses in the long-term.
In the financial year ending 2008, public sector net debt (total gross financial liabilities less liquid financial assets) stood at 36.9% of GDP. By the financial year ending 2015, this had more than doubled to 83.7% of GDP (Office for National Statistics).
Inflation rate (as measured by the Consumer Prices Index1) remains at a record low
The rate of inflation is important for well-being because of its effect on income and net wealth. The Personal Finance section of this release considers household income, adjusted for inflation.
In January 2016, the rate of inflation was 0.3%, the same record low as 2015, and much lower than during 2011 (4.0%) and 2012 (3.6%). The fall in the rate of inflation is a continuation of a downward trend that started in 2012. Much of the recent downward pressure is accounted for by falling energy, food and fuel prices. This partially reflects the recent decline in oil prices, the appreciation of sterling and strong competition among retailers (Office for National Statistics, Consumer Prices Index).
What are our perceptions of the economy?
Figure 12 shows that in November 2015, 53% of people thought the situation of the economy was good. However, the state of the economy had varied over the past 10 years. In September 2006 and 2007, around two-thirds of people (69% and 63% respectively) reported that they thought the state of the economy was good but by the start of the financial crisis in October 2008 this had fallen to just 18%. After falling to 15% in November 2011 it has subsequently risen each year (Eurobarometer).
Figure 12: Satisfaction with the economy1, September 2006 to November 2015
UK
Source: Eurobarometer
Notes:
- Respondents aged 15 and over were asked "How would you judge the current situation of the economy?" Good is "very good" or "rather good" and bad is "very bad" or "rather bad".
Download this chart Figure 12: Satisfaction with the economy^1^, September 2006 to November 2015
Image .csv .xlsNotes:
- The Consumer Prices Index (CPI) is the inflation measure used in the government’s target for inflation. The Bank of England has responsibility for keeping CPI close to a target set by the government (2% as of 2011).
12. How skilled are we?
Education is an important factor in enabling people to maximise the opportunities available to them, achieve their potential and make a contribution to the country’s economy. Educational qualifications are an important determinant of future employment and income. According to the What Works Centre for Well-being’s Public Dialogues, “Learning - both formal and informal – at its best gives us a sense of hope, opportunity and growth”.
What's changed?
Table 8: Assessments of change – Education and skills
| UK (unless otherwise specified) | |||
| Latest data | 1 year | 3 years | |
| Full Human capital1 | £18.95 trillion (2014) | Improved | No overall change |
| Percentage with 5 A*-C GCSEs including Maths and English (England) | 53.8% (2014/15) | Not assessed | Not assessed |
| Percentage with no qualifications | 8.6% (2015) | No overall change | Improved |
| Source: Office for National Statistics | |||
| Notes: | |||
| 1. Full human capital includes human capital of those that are unemployed. Data on employed human capital are also available. | |||
Download this table Table 8: Assessments of change – Education and skills
.xls (26.1 kB)Human capital has increased
The value of full human capital has increased by £170 billion, from £18.78 trillion in 2013 to £18.95 trillion in 2014. Full human capital is a measure of individuals’ skills, knowledge, abilities, social attributes, personalities and health attributes. These factors enable individuals to work, and therefore produce something of economic value.
Figure 13 shows the effect the economic downturn had on the UK’s full human capital. Between 2004 and 2007 the value of the UK’s full human capital increased at an average of 2.6% per year. This was driven by increases in the employed working-age population and the skills level of the population. Another driver of the increase in the value of the UK’s full human capital was earnings growth, which grew in real terms between 2004 and 2007. In 2010, the employment rate and level of employment for those aged 16 to 64 fell. This, alongside falls in real earnings, contributed to further falls in the value of the UK’s full human capital in 2010 and 2011 (-1.5% and -2.0% respectively). Following these falls, the value of the UK’s full human capital began to stabilise in 2012 and 2013 before increasing in 2014.
Figure 13: Human capital, 2004 to 2014
UK
Source: Office for National Statistics
Download this chart Figure 13: Human capital, 2004 to 2014
Image .csv .xlsNo change in proportion with no qualifications
In the academic year ending 2015, 53.8% of pupils that left school in England achieved 5 or more GCSE A* to C grades, including Maths and English. It is difficult to compare this figure with previous years as the way in which the figure is calculated has changed1 (Department for Education).
The proportion of people in the UK with no educational qualifications showed no overall change in 2015. It remained at 8.6%, which was the same as 2014. However, the proportion of UK residents without qualifications is 6.9 percentage points lower in 2015 than it was in 2002, when 15.5% of UK residents had no qualifications. People in Northern Ireland and the West Midlands were most likely to report that they had no qualifications in 2015 (15.8% and 12.7% respectively). People in the South West and South East were least likely to report that they had no qualifications (5.2% and 6.0% respectively) (Labour Force Survey, Office for National Statistics).
Do our educational achievements affect our personal well-being?
Educational attainment can be a passport to a higher income and employment, both of which impact on personal well-being.
A higher proportion of those with a degree or equivalent rated their life satisfaction as high or very high when compared with those that had a lower educational attainment (Figure 14). This was also the case for those whose highest educational attainment was higher education, GCE A Level or equivalent, and GCSE A*-C or equivalent. Those people who had no qualifications had a significantly lower proportion of people with high or very high life satisfaction when compared with all groups with qualifications.
Figure 14: Reporting high or very high life satisfaction1: by educational attainment2 April 2014 to March 2015
UK
Source: Annual Population Survey Personal Well-being National Statistics dataset, Office for National Statistics
Notes:
- Adults aged 16 and over were asked 'Overall, how satisfied are you with your life nowadays?' where 0 is 'not at all' and 10 is 'completely'. High or very high life satisfaction, are those who reported a rating of 7 to 10 out of 10.
- The qualifications included in these groups can be found in Volume 4 of the Labour Force Survey User Guidance.
Download this chart Figure 14: Reporting high or very high life satisfaction^1^: by educational attainment^2^ April 2014 to March 2015
Image .csv .xlsNotes:
- From the academic year ending 2014, the figure only counted a pupil’s first attempt at a qualification (if counted in the English Baccalaureate), and restrictions on vocational qualifications were also introduced. As of the academic year ending 2015, new early entry rules (first attempt counted only) were extended to all subjects.
13. How politically engaged are we?
Political engagement and voicing political opinions matters to national well-being as it helps shape government activities, which in turn help build strong and resilient communities. Trust in government is essential for social cohesion and well-being. It represents the confidence of citizens and businesses in the actions of the government. Voting is the most prominent form of political participation and, for many people, it is the only engagement with politics that they have.
What's changed?
Table 9: Assessments of change – Governance
| UK | |||
| Latest data | 1 year | 3 year | |
| Voter turnout (at UK general elections) | 66.2% (2015) | Improved | Improved |
| Those who have trust in national government | 31% (Autumn 2015) | No overall change | Improved |
| Source: Office for National Statistics | |||
Download this table Table 9: Assessments of change – Governance
.xls (27.1 kB)Turnout at general elections has improved
Voter turnout in general elections in the UK fell from a high of 83.9% in 1950, to a low of 59.4% in 2001. The turnout for the last general election in 2015 was 66.2% which was higher than the previous 3 elections, but still the fourth lowest since 1945 (Research Briefings, House of Commons Library).
3 in 10 trust the government
In the autumn of 2015, 31% of people aged 15 and over in the UK reported that they “tended to trust” their national government. There was no overall change from autumn 2014 but an improvement on autumn 2012 (25%). Over 6 in 10 (64%) people reported that they tended not to trust the government. This figure is comparable with a number of European countries, but lower than Greece, Spain, Slovenia and Portugal where around 8 in 10 tended not to trust their national government (Eurobarometer).
Having trust in the government is important. If there is a decline in trust people or businesses may be more risk adverse, for example, delaying investment, innovation and employment decisions that are essential to regain competitiveness and jumpstart growth.
How does our trust in government change over time?
Since autumn 2004 the proportion of people that stated they tended to trust the government varied between a low of 19% in the autumn of 2009 to a high of 37% in the spring of 2015 (Figure 15). The proportional changes over time may be due to political and non-political events. For example, in the spring of 2007 the proportion of people that “tended to trust” the government stood at over a third (34%), but fell to just under a fifth (19%) in the autumn of 2009. These changes may have been due to the start of the financial crisis (2008) and the UK parliamentary expenses scandal (2009). Conversely, events such as pre-election periods (Spring 2005, 2010 and 2015) when politicians are more visible and “feel-good” events like the London Olympic Games (July/August 2012) may have had an effect on the proportional increases of those who reported trust in the government.
Figure 15: Percentage of those who have trust in national government1, 2004 to 2015
UK
Source: Eurobarometer
Notes:
- Respondents aged 15 and over were asked if they 'tend to trust' or 'tend to not trust' the UK government. Percentages are for those who answered 'tend to trust'. Fieldwork was carried out in spring and autumn of each year.
Download this chart Figure 15: Percentage of those who have trust in national government^1^, 2004 to 2015
Image .csv .xls14. Are we protecting our natural environment for future generations?
According to the What Work’s Centre for Wellbeing Public Dialogues Report, many people feel that the environment is fundamental to well-being. Nature, green space, built environment, and communal or public spaces to meet were all mentioned as important aspects for well-being. One participant in the report stated that, “building sustainable communities means respecting nature, it’s where you get your food from, it’s where you get your art from, and your water, and the current focus is all about economic growth…perhaps the environment should be the key element of any kind of policies that are developed for community well-being”.
What's changed?
Table 10: Assessments of change – Natural environment
| UK | |||
| 1 year | 3 year | ||
| Greenhouse gas emissions | 514.4 MtCO2e (2014)1 | Improved | Improved |
| Energy consumption from renewable sources | 7.0% (2014) | Improved | No overall change |
| Recycling rates | 44.9% (2014) | Improved | No overall change |
| Protected areas | 21.413 million hectares (2015) | No overall change | Improved |
| Source: Office for National Statistics | |||
| Notes: | |||
| 1. MtCO2e = million tonnes carbon dioxide equivalent. | |||
Download this table Table 10: Assessments of change – Natural environment
.xls (26.1 kB)Greenhouse gas emissions are falling
The UK’s greenhouse gas (GHG) emissions were estimated at 514.4 million tonnes carbon dioxide equivalent (MtCO2e) in 2014. This was 7.7% lower than 2013, and 35.4% lower than 1990. GHG emissions are widely believed to contribute to climate change, which is why they have been included as a headline measure of national well-being.
The UK has both international and domestic targets for reducing GHG emissions. The Kyoto Protocol is an international agreement which commits its parties to setting internationally binding emission reduction targets. The UK’s target was to reduce emissions by 12.5% from 1990 to 2012, which was met. For the second Kyoto Protocol commitment period (2013–2020) a UK target is yet to be formally agreed.
Further to this, under the Climate Change Act 2008 the UK has a legally binding target to reduce emissions by at least 80% below 1990 baselines by 2050, with an interim target to reduce GHG emissions by at least 34% compared to the 1990 baseline by 2020. To help set this trajectory, the Climate Change Act also introduced carbon budgets, which set legally-binding limits on the total amount of GHG emissions the UK can emit for a given five-year period. The first carbon budget ran from 2008 to 2012. In 2014, the UK confirmed that it had met the first carbon budget, with emissions 36 MtCO2e below the cap of 3,018 MtCO2e over the first carbon budget period.
More energy being consumed from renewable sources
Final energy consumption from renewable sources reached 7.0% in 2014, up from 5.6% in 2013 (Figure 16). Although fossil fuels remain the dominant source of energy supply (accounting for 85% of all energy consumed), their contribution to the overall energy mix has reached a record low. Increases in renewable energy play an important role in reducing GHG emissions and support a shift towards a greener and more sustainable economy.
The UK is committed to targets to obtain an increasing share of its energy from renewable sources. By 2020, 15% of the UK’s energy consumption should be from renewable sources. The UK has exceeded the first 2 interim targets and the lines on Figure 16 indicate the interim targets that will keep the UK on track to meet the overall 2020 target.
Figure 16: Percentage of final energy consumption from renewable sources, 2004 to 2020 (projected)
UK
Source: Department for Energy and Climate Change
Download this chart Figure 16: Percentage of final energy consumption from renewable sources, 2004 to 2020 (projected)
Image .csv .xlsRecycling rates not progressing fast enough to reach EU 2020 target
In 2014, 26.8 million tonnes of household waste was produced in the UK with 12.0 million tonnes (44.9%) of it being recycled. Although this figure has increased when compared with the previous year’s figure (44.1%), whether this measurement has improved is assessed against the EU target of recycling 50% of household waste by 2020. Currently, the UK is not progressing at a sufficient pace to reach this target by 2020, and is therefore assessed as having “no overall change” in the longer-term while showing a sufficient year on year increase. Recycling rates in 2014 varied across the countries of the UK. In Wales, more than half (54.8%) of household waste was recycled, compared with 44.8% in England, 41.0% in Scotland and 43.6% in Northern Ireland (Department for Environment, Food and Rural Affairs).
Little change in protected areas following large increases between 2010 and 2014
In the UK in 2015, 21.4 million hectares of land and sea was designated as a nationally or internationally important protected area. Protected areas are locations that are conserved for landscape, ecological and/or cultural reasons, with the main purpose of protecting biodiversity.
The total area protected has not changed since 2014; however, between 2010 and 2015 the total extent of land and sea protected in the UK increased by 10.7 million hectares, an increase of 99.1%. The majority of the overall increase is as a result of designation of 10.6 million hectares of marine protected areas in both inshore and offshore waters (under the Habitats Directive, designation of marine conservation zones in English, Welsh, and Northern Irish waters, and designation of nature conservation marine protected areas in Scottish waters). (Department for Environment, Food and Rural Affairs).
Do we value the natural environment and take action to preserve it?
It has been shown that differences can exist between the extent to which people say that they value the natural environment and the extent of their actual participation in activities to counter environmental problems. This discrepancy between attitudes and behaviour has been referred to as the “Value-Action Gap” and is highlighted in the Monitoring and Engagement of the Natural Environment report from Natural England (MENE). The survey contains a number of questions which reflect a variety of “Value” and “Action” topics around the environment in England. Using data from 2009 to 2014, the relationships between value and action have been explored.
There is a considerable gap between the value attributed to the natural environment and the level of action taken to preserve it, particularly in relation to actions that require a higher investment of time or money. Almost 9 out of 10 respondents (87%) in England over the period 2009 to 2014 either agreed or strongly agreed that they were concerned about damage to the natural environment. The MENE study contained 9 pro-environmental actions of varying prevalence1. On average, people reported undertaking around 2 actions, with some people not undertaking any at all (Figure 17).
Figure 17: Number of pro-environmental actions taken, 2009 to 2014
England
Source: Monitor and Engagement of the Natural Environment (MENE), Natural England
Download this chart Figure 17: Number of pro-environmental actions taken, 2009 to 2014
Image .csv .xlsNotes:
- “I usually recycle items rather than throw them away”
“I usually buy eco-friendly products and brands”
“I usually buy seasonal or locally grown food”
“I choose to walk or cycle instead of using my car when I can”
“I encourage other people to protect the environment”
“I am a member of an environmental or conservation organisation”
“I volunteer to help care for the environment”
“I donate money at least once every three months to support an environmental or conservation organisation"
“I donate my time at least once every three months to an environmental or conservation organisation”
15. Children’s well-being
Children’s well-being is an important part of the nation’s well-being. Not only does childhood set the foundation for a well-functioning and healthy adulthood, but children ought to be able to experience life and flourish as children. We have developed a set of 31 headline measures, across 7 domains of the national framework, to show how children are faring in the arenas of life that are important to them, for example, school, family and peer relationships, having autonomy and aspirations for the future.
The latest data shows few changes in children’s well-being overall. There is a mixed picture, with children reporting relatively high levels of personal well-being, and positive relationships with parents. However, there are still areas of concern, such as the proportion of children who report being bullied frequently and the proportion of children reporting symptoms of mental ill-health. The full set of 31 measures can be found in the dataset. A geographical breakdown of selected measures is also available.
ONS has also developed a set of 28 measures of well-being for young people aged 16 to 24. These have not been published as a separate spreadsheet, as the National Measures spreadsheet includes the latest data for most measures disaggregated by age group.
Back to table of contents16. How sustainable is our future?
National well-being covers not just how we are doing today, as individuals and as a nation, but also how sustainable this is for the future. One approach to assessing sustainability for the future, adopted by the OECD ‘How’s Life’ report, is to consider the stocks we have now in things such as education and skills, natural resources and community cohesion, which all matter for the present and future well-being of individuals. The Measuring National Well-being programme collects information in these areas as part of work on human, natural and social capital.
Human capital
Human capital is a measure of individuals’ skills, knowledge, abilities, social attributes, personality and health attributes. These factors enable individuals to work, and therefore produce something of economic value. An individual’s labour market outcomes are linked to their human capital. In general, individuals with low skills or levels of education are more likely to be unemployed and face social exclusion. Higher human capital (in particular educational attainment) is also associated with higher earnings. Research on economic growth suggests that countries with higher levels of human capital, other things being equal, have greater potential output and income in the future.
Human capital can also have social impacts; in particular, higher levels of human capital are associated with improved health outcomes, lower crime rates, and higher rates of trust and social participation.
In 2014 the value of the UK’s human capital stock was £18.95 trillion, an increase of £170 billion from £18.78 trillion in 2013. The Education and skills chapter provides more detail on the changes that have occurred in Human capital since 2004.
Further information can be found on the Human capital section of the ONS website.
Natural capital
Natural capital values our natural resources, such as woodlands and rivers. As part of the Measuring National Well-being programme, we are measuring natural capital by developing ecosystem accounts to monitor changes in the value and condition of UK natural capital.
In 2011, UK natural capital was partially estimated at £1.6 billion, this was 4% lower than the value in 2007. These estimates are experimental and are termed, ‘partial’ as they include only a few of the material and non-material benefits of nature. For example, recreational benefits of nature and the value of timber were included in the estimates, however, the benefits trees and soil provide by storing carbon is not included.
Further information and the ecosystem accounts developed so far can be found on the Natural Capital section of the ONS website.
Social capital
Social capital refers to social connections and the benefits they generate. Unlike natural or human capital, a financial value is not calculated for social capital. In January 2015, we published a set of 25 measures that cover 4 key aspects: personal relationships, social network support, civic engagement and trust, and cooperative norms.
Latest data for personal relationships showed that most of us (95%) had at least one close friend in the financial year ending 2012, and that 11% of people felt lonely more than half of the time over the previous two weeks. In terms of social network support, most people felt that they can rely “a lot” on their partner (80.7%) and their family (60.7%) in case of a serious problem, but less than half (43.2%) felt that they could rely “a lot” on their friends, in the financial year ending 2014. Voluntary activity which is a form of civic engagement was valued at £23.9 billion in the UK in the financial year ending 2013 and in November 2015, 31% reported that they “tended to trust” national government compared with 25% of people in November 2012.
Measures of social capital will continue to be developed. Further information can be found on the Social Capital section of the ONS website.
Sustainable development goals
At a United Nations summit in September 2015, world leaders came together to express their commitment to an ambitious plan to eradicate poverty and achieve sustainable development over the next 15 years. At the heart of this plan are the 17 sustainable development goals (SDGs), also known as the global goals, and their accompanying targets. These goals have been described by the UN Secretary General Ban Ki-Moon as a ‘to do list for the planet, and a blueprint for success’.
It is expected that global reporting of progress towards the SDGs will be based on global and regional aggregates of data. However, all countries will be encouraged to report on both domestic and international implementation of the goals and we are set to play a key role in the monitoring and reporting of the UK’s progress towards the goals. This will include looking at the way existing reporting frameworks (for example, Measures of National Well-being and Sustainable Development Indicators) align with the SDGs to give a comprehensive picture of the UK’s progress towards a sustainable future. We are planning to consult with stakeholders in summer 2016 on the proposed framework for national reporting of SDGs.
Further information can be found on the Sustainable Development Indicators section of the ONS website.
Back to table of contents