1. Main findings
This report analyses personal well-being data for over 300,000 adults in the UK, collected over 3 years between 2012 and 2015. It finds that:
those aged 65 to 79 tended to report the highest average levels of personal well-being
ratings of life satisfaction and happiness were at their lowest, on average, for those aged 45 to 59
well-being ratings fell amongst the oldest age groups (those aged 75 and over) - this fall was steepest for feelings that activities they do in life are worthwhile
those aged 90 and over reported higher life satisfaction and happiness compared with people in their middle years
average anxiety ratings increased through early and middle years, peaking between 45 to 59 years, but then subsequently falling and remaining relatively unchanged for those aged 65 and over
2. Introduction
Personal well-being provides an important insight into people’s thoughts and feelings about their quality of life. Its measurement forms part of a much wider initiative in the UK, and internationally, to look beyond Gross Domestic Product (GDP) and to measure what really matters to people.
Previous research has shown the relationship between age and personal well-being to be U-shaped. That is, our sense of personal well-being is highest among younger people and older people and is lowest among people in their middle years. The following report builds on this, analysing responses from more than 300,000 individuals to further examine the relationship between age and personal well-being. Understanding more about how different age groups rate their personal well-being will help policy makers target groups in most need and concentrate on issues that are fundamental to a good life.
Back to table of contents3. At what age is personal well-being the highest?
Previous international comparisons have shown that generally people in the UK are reasonably content with their lives overall. Current average ratings for the 4 Office for National Statistics (ONS) measures of personal well-being are:
7.5 out of 10 for life satisfaction
7.8 out of 10 for feeling that what you do in life is worthwhile
7.4 out of 10 for happiness yesterday
2.9 out of 10 for anxiety yesterday
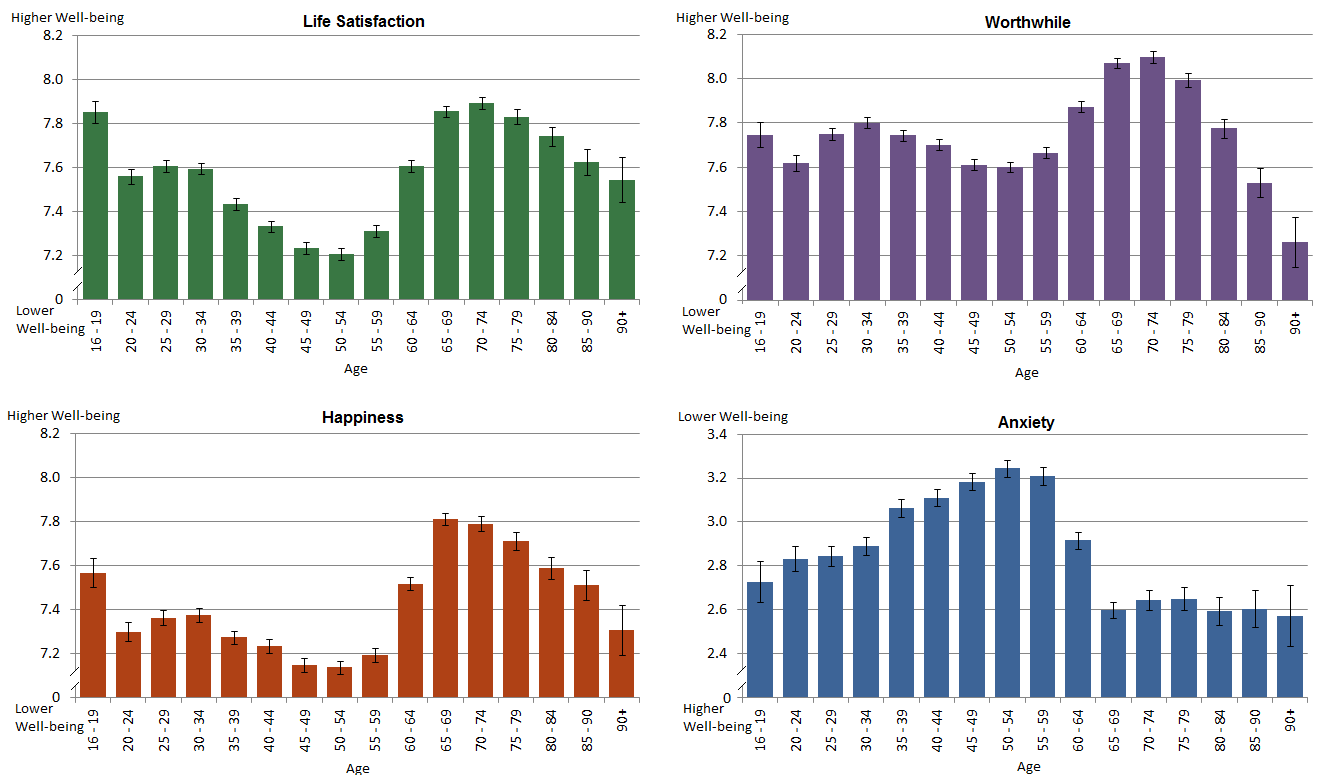
However, Figure 1 illustrates that different age groups rate their personal well-being differently.
Figure 1: Average personal well-being ratings: by age, 2012 to 2015
UK
Source: Annual Population Survey (APS) - Office for National Statistics
Notes:
- 95% confidence intervals are displayed on the chart as error bars.
- Please note axis does not start at zero.
- Estimates shown are mean averages.
Download this image Figure 1: Average personal well-being ratings: by age, 2012 to 2015
.png (36.4 kB) .xls (30.7 kB)
Considering the 4 measures in turn:
people aged between 16 to 19, and between 65 to 79, reported the highest average ratings of life satisfaction – people in their middle years, aged between 45 to 54 reported the lowest average ratings
ratings of worthwhile were highest, on average, for people aged between 65 to 74 and lowest for those aged 90 and above
people aged between 65 to 74 had the highest average reported happiness – the lowest rating was amongst those aged between 45 to 59
average "anxiety yesterday" ratings increased progressively through early and middle years, peaking for the 45 to 59 year old age groups, but then subsequently falling and remaining relatively unchanged for those aged 65 and above
Is the relationship between age and personal well-being U-shaped?
Considering first the measure of life satisfaction, evidence of a U-shaped curve holds true, but only for those aged 75 and under. For those aged between 16 to 19, the youngest age group presented in this analysis, average ratings of life satisfaction were high. However, after levelling off between the ages of 20 to 34, ratings become progressively lower through middle years, reaching their lowest point among those aged between 45 to 54. Average ratings then begin to increase and peak again for those aged between 65 to 79, returning to a high level similar to that observed in the youngest age group. Average ratings of life satisfaction then begin to decline through the oldest age groups.
Again considering only those under the age of 75, a broadly similar U-shaped curve can be observed for ratings of happiness. However, the distribution is less symmetrical because average ratings of happiness amongst the 16 to 19 year old age group are lower than the average ratings for those aged between 65 to 74.
Average worthwhile ratings demonstrate a shallow U-shaped curve, with a small peak among those aged between 30 to 34 and a larger peak among those aged between 65 to 74.
Average ratings of anxiety increased progressively through early and middle years, peaking for the 45 to 59 year old age groups, but then subsequently falling and remaining relatively unchanged. The fall observed in anxiety coincides with a subsequent increase observed in each of the life satisfaction, happiness and worthwhile measures.
Why might ratings of personal well-being vary by age?
There are a number of possible explanations behind the differences observed in personal well-being between the different age groups. For example, results might be the consequence of a cohort effect, whereby people born in different eras will have had different experiences and expectations which will ultimately shape their sense of well-being.
Another explanation might be that our level of personal well-being changes as we move through our lives, have new experiences, and change the way we look at things.
The differences might also be driven by socio-economic factors. For example, those in their younger years and those who are retired may have more free time to spend on activities which promote their well-being. In contrast, those in their middle years may have more demands placed on their time and might struggle to balance work and family commitments. Evidence shows that people are having children later. Therefore another possible reason for lower scores for the middle age groups could result from the burden caused by having to care for both parents and children at the same time.
What happens to ratings of personal well-being for those aged 75 and over?
We know that the UK population is ageing. There were more than half a million people aged 90 and over living in the UK in 2014, almost triple the number 30 years ago. This shift towards an older population will impact on important policies and services including the labour market, pension provision, and health and social care demand. Understanding more about how the oldest age groups rate their personal well-being will help focus on issues that are fundamental to a good later life.
Average ratings of life satisfaction, a sense that what one does in life is worthwhile and happiness peak for those aged between 65 to 79 years, however scores for all 3 measures decline in later life. The extent of this decline in personal well-being ratings was largest for average feelings that what one does in life is worthwhile, where those aged 90 and above reported the lowest average worthwhile rating of all the age groups. This particular finding might have important implications for policy when considering provision of worthwhile building activities into care settings for the over 90s. Whilst ratings of life satisfaction and happiness also fall in later life, interestingly average ratings remain higher for those aged 90 and above compared with people in their middle years.
The fall in ratings of personal well-being amongst the oldest age groups might result from a range of personal circumstances such as poor health, living alone and feelings of loneliness. Self-reported health has one of the strongest associations with all the measures of personal well-being, with those reporting higher personal well-being tending to report better general health. As health problems generally develop with age, it is reasonable to expect that older people are less able to participate in activities as freely as they once were. The direction of the relationship between personal well-being and health could be either way. Therefore it is possible that creating interventions directed at improving well-being could also lead to improvements in the population’s general health.
Previous evidence has found that those aged 80 and over were also twice as likely to report feelings of loneliness compared with younger age groups. What’s more, these feelings of loneliness were found to have a strong relationship with low personal well-being ratings.
Conclusion
This analysis provides a more detailed picture of the relationship between personal well-being and age than the widely accepted U curve. In particular, it finds a notable decline in personal well-being scores for those aged 75 and over.
Understanding more about how different age groups rate their personal well-being will help policy makers target groups in most need and concentrate on issues that are fundamental to a good life. For example, this analysis has identified the potential need for interventions for those aged over 90 in how they feel the things they do in life are worthwhile. This is especially important as we are now living longer and 1 in 3 of today’s babies will live to see their 100th birthday, according to latest estimates. The decline in all 4 ONS personal well-being measures for those in their middle years has also indicated that government, employers and businesses may have a role in improving the well-being of this group.
Related publications
ONS (2013) Measuring National Well-being, What matters most to Personal Well-being?
ONS (2015a) Measuring National Well-being, Personal Well-being in the UK, 2014/15
ONS (2015c) Nine things you might not know about older people in the UK
ONS (2015d) International Comparisons, 2015
ONS (2015e) Births by Parents' Characteristics in England and Wales, 2014
ONS (2016) What are your chances of living to 100?
Back to table of contents4. How do people rate their Personal Well-being in your area? (Interactive maps)
We have released maps with Personal Well-being data at local authority district level.
To explore the data and find out what personal well-being is like in your area please see our interactive maps.
Image 1: Personal Well-being Interactive Maps, 2012 to 2015

Download this image Image 1: Personal Well-being Interactive Maps, 2012 to 2015
.png (89.8 kB)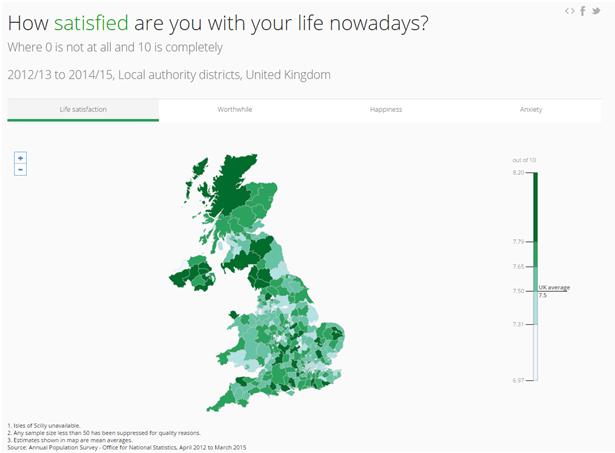
The enhanced sample size of the combined 3 year Personal Well-being Annual Population Dataset compared with the annual Personal Well-being Annual Population Dataset allows for more detailed analysis at lower levels of geography. We have released maps with Personal Well-being data at local authority district level.
Back to table of contents