1. Main points
In Quarter 1 (Jan to Mar) 2016, gross domestic product (GDP) per head increased 0.3% compared with Quarter 4 (October to December) 2015 and is now 0.9% above pre-economic downturn levels. This was a slightly slower growth rate than the 0.4% quarterly increase seen in GDP.
Net national disposable income (NNDI) per head fell by 0.9% in Q1 2016 compared with the same quarter a year ago, despite GDP per head increasing 1.3% over the same period. This was mainly due to a deterioration in the balance of earnings on direct investment, which decreased from negative £1.1 billion to negative £7.2 billion between Q1 2015 and Q1 2016.
In Quarter 1 2016, real household disposable income (RHDI) per head excluding non-profit institutions serving households (NPISH) - increased 4.8% compared with the same quarter a year ago. Growth was largely driven by increases in net social benefits other than transfers in kind and compensation of employees.
Growth in household spending also increased in Quarter 1 2016, by 2.1% compared with the same quarter in the previous year- continuing the general upward trend seen since Quarter 3 (July to September) 2011. However it still remains 1.5% below its pre-economic downturn level.
Estimates of income inequality for financial year ending 2015 (2014/15) are broadly unchanged from those for the previous financial year (any differences are not statistically significant). Since financial year ending 2008 (2007/08), there has been a slight decrease in overall income inequality on a range of measures, although from a longer-term perspective, income inequality remains above levels seen in the early 1980s.
During July 2012 and June 2014, the median value of financial assets was £13,800 in the South East compared with £2,600 in the North East.
Between Q1 2014 and Q1 2016, the proportion of unemployed people that were without a job and actively seeking work for more than 12 months decreased from 36.9% to 27.6%. This compares with an increase in the proportion of the unemployed that were without a job and actively seeking work for up to 6 months from 47.1% to 56.2%, suggesting that people are, on average, spending less time in unemployment.
Back to table of contents2. Introduction
This release reports measures of economic or material well-being. Rather than focussing on traditional measures such as GDP alone, these indicators aim to provide a more rounded and comprehensive basis for assessing changes in economic well-being. More detail can be found in the Economic Well-being, Framework and Indicators article.
Back to table of contents3. Whole economy production and income
Figure 1: Gross Domestic Product (GDP) per head, Q1 2008 to Q1 2016
UK
Source: Office for National Statistics
Notes:
- Q1 refers to Quarter 1 (January to March), Q2 refers to Quarter 2 (April to June), Q3 (July to September) and Q4 refers to Quarter 4 (October to December).
Download this chart Figure 1: Gross Domestic Product (GDP) per head, Q1 2008 to Q1 2016
Image .csv .xlsReal GDP per head
In Q1 2016, gross domestic product (GDP) per head, which adjusts GDP for the size of the population, increased 0.3% compared with Q4 2015. This was a slightly slower growth rate than the 0.4% quarterly increase seen in GDP, which recovered to its pre-economic downturn level in Q3 2013. The quarterly growth in GDP per head means that it is now 0.9% above its pre-economic downturn level, having initially surpassed its pre-economic downturn level in Q3 2015.
Between 2014 and 2015, GDP per head increased 1.4%. This was slower than the 2.2% increase in GDP over the same period.
Real net national disposable income (NNDI) per head
In Q1 2016, NNDI per head decreased 0.9% compared with the same quarter a year ago. This is compared to a 1.3% increase GDP per head in Q1 2016 compared with the same quarter a year ago.
Between 2014 and 2015, NNDI per head increased 1.0%. This was slower than the 1.4% increase in GDP per head over the same period.
As discussed in the Economic Well-being, Framework and Indicators article, there are 2 main differences between GDP per head and NNDI per head. First, not all income generated by production in the UK will be payable to UK residents. Some of the capital employed will be owned by non-residents and they will be entitled to the return on that investment. Conversely, UK residents receive income from production activities taking place elsewhere, based on their investments overseas. Adjusting for these flows gives a measure that is more focused on income rather than production.
Second, these measures can be adjusted for capital consumption. GDP is “gross” in the sense that it does not adjust for capital depreciation, that is, the day-to-day wear and tear on vehicles, machinery, buildings and other fixed capital used in the productive process. It treats such consumption of capital as no different from any other form of consumption. But most people would not regard depreciation as adding to their material well-being.
GDP per head and net domestic product (NDP) per head, which just makes the adjustment for capital depreciation, track reasonably well over the course of the recession, suggesting that the impact of capital consumption is relatively low.
However, NNDI has behaved somewhat differently to GDP, particularly since late 2011. NNDI per head, which represents the income generated by production that is payable to UK residents, grew by 3.7% between Q1 2012 and Q1 2016. This is compared to GDP per head, which has grown by 6.2% over the same period. This means that in Q1 2016 NNDI per head was 3.1% below its pre-economic downturn level. However, GDP per head was 0.9% above its pre-economic downturn level.
The difference between the experience of GDP per head and NNDI per head since late 2011 can be explained by looking at the downwards trend seen by the balance of primary incomes, which captures flows of income into and out of the UK economy, and the higher GDP growth.
One main part of primary incomes is direct investment; that is, earnings from cross-border investments made by residents and businesses from 1 country into another, with the aim of establishing a lasting relationship. Ownership of at least 10% of the voting power, representing the influence by the investor, is the basic criterion used.
Looking at the longer-run trend, UK foreign direct investment (FDI) earnings have traditionally made a positive contribution to the UK current account since 1997, partly offsetting negative contributions from the other major components. However, the positive contribution of FDI earnings has fallen since 2011, turning negative in 2015. More information is available in our analysis of the drivers behind the fall in direct investment earnings and their impact on the UK's current account deficit release.
Looking in more detail at recent periods, since late 2011, there has been a fall in the balance of earnings on FDI (the difference between earnings from direct investment abroad and from foreign direct investment in the UK). This deterioration is attributed to both subdued and falling earnings for UK residents from direct investment abroad and an increase in foreign earnings on direct investment in the UK. The continued fall resulted in a direct investment deficit in Q1 2015, the first such deficit since Q4 2008. The balance of earnings on foreign direct investment rebounded slightly, returning to a surplus in Q2 2015 and Q3 2015 but once again fell in Q4 2015. This was due to a significant increase in foreign earnings on direct investment compared to Q3 2015 and UK earnings from direct investment abroad falling each quarter since Q1 2015. In Q1 2016, the balance of earnings on direct investment decreased to negative £7.2 billion (from negative £6.2 billion in Q4 2015), reflecting a larger decrease in the amount the UK earns from its direct investment abroad (£2.7 billion) than the decrease in foreign earnings on direct investment in the UK (£1.7 billion).
Perception of the economic situation
The Eurobarometer Consumer survey asks respondents how they think the general economic situation has changed over the last 12 months. In March 2016, the aggregate balance stood at negative 8.7. The small negative balance suggests that on average, respondents think the economic situation has got slightly worse compared with a year ago, although in general it is broadly similar. This is a decrease on the negative 1.8 aggregate balance recorded at the end of the fourth quarter of 2015 (December 2015). The series has been on a general upwards trend in recent years until April 2015, before the trend turned slightly negative. At its lowest, in May 2009, the Eurobarometer reported an aggregate balance of negative 82.3.
Back to table of contents4. Household income
Figure 2: Real Household Disposable Income per head and Perception of Financial Situation
UK
Source: Office for National Statistics and GfK (for the Eurobarometer Consumer Survey)
Notes:
- Household's perception of their own financial situation over the last 12 months - last month of each quarter used.
- Households do not include non profit institutions serving households (NPISH).
- Q1 refers to Quarter 1 (January to March), Q2 refers to Quarter 2 (April to June), Q3 refers to Quarter 3 (July to September) and Q4 refers to Quarter 4 (October to December).
- The Eurobarometer Consumer Survey is collected by GfK for the European Commission.
Download this chart Figure 2: Real Household Disposable Income per head and Perception of Financial Situation
Image .csv .xlsIn previous releases, we considered real household disposable income (RHDI) per head of the household and non-profit institutions serving households (NPISH) sector. In March 2015, we published initial estimates of the real disposable income of households only. We consider this a better indicator of the economic well-being of households. Unless stated otherwise, analysis of RHDI in this bulletin excludes NPISH. Real household and NPISH disposable income per head will continue to be published alongside RHDI per head (excluding NPISH) in the reference tables.
In Q1 2016, RHDI per head increased 4.8% compared with the same quarter a year ago. The main contributors to this growth were net social benefits other than transfers in kind and compensation of employees, which grew by 14.1% and 3.5% respectively compared to the same quarter a year ago. Growth in compensation of employees was mainly driven by 10.1% growth in employers social contributions compared to Q1 2015. Increased contributions from employers to employee pension pots are reminiscent of behaviour seen during 2012 and 2013.
On a quarterly basis, RHDI per head increased by 1.8% in Q1 2016 compared with Q4 2015. As a result, in Q1 2016, RHDI per head was 7.0% above its pre-economic downturn level.
As GDP began to fall in mid-2008, RHDI per head remained relatively resilient. By Q2 2009, RHDI per head was 3.2% above its pre-economic downturn level. This initial improvement in real household income per head was a result of several factors.
Firstly, interest rates reached historic lows and therefore household incomes were helped by falling mortgage payments.
Additionally, as employment fell and unemployment rose, people paid less Income Tax and claimed more benefits, supporting RHDI per head. However, moving into early 2011, the impact of these factors wore off and inflation rose. Prices grew more strongly than household income and therefore, over time, people found that their income purchased fewer goods and services.
Following this, RHDI per head began to rise in early 2012 before stabilising toward the end of 2012. In Q1 2013 the series fell to 1.0% below its pre-economic downturn level, but it has been on a general upward trend since, increasing 7.0% between Q1 2014 and Q1 2016. This could be attributed to an improvement in real earnings since Q2 2014. Between Q2 2014 and Q2 2015, real earnings quarter-on-same-quarter-a-year-ago growth increased from negative 1.0% to positive 2.9%. This was mainly due to improving nominal earnings and disinflation, with the CPI inflation rate remaining near zero throughout most of 2015.
For international comparisons it is important to consider benefits in kind, such as education and healthcare services. The real household and NPISH adjusted disposable income per head series, which makes the adjustment for benefits in kind, can be found in the reference table.
Perception of financial situation
As well as considering levels of household income, it is important to consider individuals' perceptions of their own income. The Eurobarometer Consumer Survey asks respondents their views on the financial situation of their household over the past 12 months. A negative balance means that, on average, respondents reported their financial situation got worse, a positive balance means they reported it improved and a zero balance indicates no change.
In the years before the economic downturn a peak of 3.3 was reported in October 2007 but in general it remained around the 0 no change balance. At the beginning of 2008 following the economic downturn the balance sharply fell and reached a low of negative 25.2 in March 2012. Between the end of Q4 2015 and the end of Q1 2016, the aggregate balance increased from 3.5 to 3.7, continuing the positive balances that have been seen in recent months following sharp increases since early 2013.The figure suggests that, on average, households are beginning to feel their financial situation has improved slightly over the past 12 months.
The Eurobarometer Consumer survey also asks respondents their views on whether now is a good time to save. The balance had been negative from April 2011 onwards, but following improvements from May 2013, the series reached a positive figure in June 2015. Between the end of Q4 2015 and the end of Q1 2016, the balance fell from 1.7 to 0.9. This slightly positive figure suggests that respondents believe now is a good time to save, although it is near the zero no change figure. Also, on average, households reported saving at least some of their income.
Additionally, Understanding Society provides information on the proportion of individuals that report being somewhat, mostly, or completely, satisfied with the income of their household, and the proportion of households that report finding it quite, or very, difficult to get by financially.
In the financial year ending 2014, the proportion of individuals that reported finding it difficult to get by financially was 9.1%. This was 1.0 percentage point lower than a year earlier, continuing the downward trend since it peaked at 12.3% in the financial year ending 2010. Despite falling in recent years, the proportion of individuals that report finding it difficult to get by financially remains above pre-economic downturn levels.
In the financial year ending 2014, the percentage of respondents that were somewhat, mostly, or completely, satisfied with their level of income was 53.7%. This is broadly unchanged from a year earlier. Satisfaction with income demonstrated a downward trend between 2007 and the financial year ending 2012, recording a 4.5 percentage point decline between the financial years ending 2011 and 2012. While the increase in the financial year ending 2013 and 2014 shows some improvement in this trend, it remains below the levels seen prior to the economic downturn.
Distribution of income
Figure 3 : Real median household income and S80:20 ratio, 1977 to financial year ending 2015
United Kingdom
Source: Office for National Statistics
Notes:
- From 1994 onwards the series changes from a calendar year to a financial year basis.
Download this chart Figure 3 : Real median household income and S80:20 ratio, 1977 to financial year ending 2015
Image .csv .xlsIn the financial year ending 2015, real median equivalised disposable income (the income of the middle household if all households are ranked from the lowest income to the highest, after accounting for inflation and household composition) was £25,700, - 3.3% higher than the financial year ending 2014. This continues growth seen since the financial year ending 2013, so that real median equivalised disposable income reached a similar level to that recorded in financial year ending 2008 - its pre-economic downturn level.
Median household income represents the middle of the income distribution and provides a good indication of the “typical” household. However, it is also important to consider how income is distributed and the equality of the income distribution.
One commonly used indicator for analysing the income distribution is the ratio of total real equivalised disposable income received by the richest fifth of households to that received by the poorest fifth ( known as the S80:S20 ratio). An increasing ratio implies increasing inequality between the top fifth and bottom fifth of households. Between the financial years ending 2014 and 2015, this ratio remained at 5.3, suggesting no change in income inequality on this measure. The stability in the ratio was the result of the mean income of the richest fifth rising at a similar rate to that of the mean income of the poorest fifth, rising 3.6% and 3.8% respectively. This continues a trend seen since the early 90’s, greater stability in income inequality compared to the late 70’s and 80’s.
The effect of taxes and benefits lead to income being shared more equally between households. In the financial year ending 2015, before taxes and benefits, the poorest fifth of households had an average original income of £6,100, compared with the average original income of the richest fifth, £83,800 - a ratio of 14 to 1. However, after accounting for all taxes and benefits, including indirect taxes and benefits in kind, this ratio fell to 4 to 1, as the income of the poorest fifth of households increased to £16,500 whilst the richest fifth saw their final income drop to £62,500. This is mainly attributed to the richest fifth paying a larger percentage of their income in direct tax, such as income Tax, whilst the poorest fifth receive more benefits in kind, such as education, and cash benefits, such as tax credits. However, as a percentage of disposable income, the poorest fifth pay almost double on indirect taxes, such as VAT, when compared to the percentage of disposable income the richest fifth pay.
Notes for household income
The Eurobarometer Consumer Survey is collected by GfK for the European Commission. There is more information about interpreting the Eurobarometer Consumer Survey in background note 5.
Understanding Society is a household longitudinal study that captures information from a representative UK sample. More information can be found in background note 6.
Real household disposable income (RHDI) is published in both non-seasonally adjusted (NSA) and seasonally adjusted (SA) formats in the United Kingdom Economic Accounts, with the latter removing seasonal effects to allow comparisons over time. However, it is sensitive to short-term changes in its components, particularly on a quarterly basis, meaning that quarter-on-quarter movements can appear volatile. To better present the longer-term movement in household income, this bulletin presents RHDI growth on a quarter on the same quarter a year ago and on an annual basis.
The income measure used in this section, unless otherwise stated, is real equivalised household disposable income. Disposable income is the amount of money that households have available for spending and saving after direct taxes (such as Income Tax and Council Tax) have been accounted for. It includes earnings from employment, private pensions and investments, as well as cash benefits provided by the state. Equivalisation is the process of accounting for the fact that households with many members are likely to need a higher income to achieve the same standard of living as households with fewer members.
Original income is income before government intervention (for example income from employment and investment)
A series being "real" means that it has taken account of inflation effects
Throughout this release Q1 refers to Quarter 1 (January to March), Q2 refers to Quarter 2 (April to June), Q3 refers to Quarter 3 (July to September) and Q4 refers to Quarter 4 (October to December).
5. Household spending
Income is a viable measure of the material well-being in the economy, however, a fuller picture of the economic well-being of a country can be found by looking at how much households consume.
In June 2014, we published [Income, Expenditure and Personal Well-being, 2011/12][3], which presented new findings on the relationship between personal well-being, household income and expenditure using regression analysis. It found that household expenditure appeared to have a stronger relationship with personal well-being than household income.
Figure 4 : Household final consumption expenditure (HHFCE) per head, Q1 2008 to Q1 2016
UK
Source: Office for National Statistics
Notes:
- Households do not include non profit institutions serving households (NPISH).
- Throughout this release Q1 refers to Quarter 1 (January to March), Q2 refers to Quarter 2 (April to June), Q3 refers to Quarter 3 (July to September) and Q4 refers to Quarter 4 (October to December).
Download this chart Figure 4 : Household final consumption expenditure (HHFCE) per head, Q1 2008 to Q1 2016
Image .csv .xlsIn Q1 2016, real household spending per head (excluding non-profit institutions serving households) grew 0.5% compared with the previous quarter, continuing the general upward trend seen since Q3 2011. However, real household spending per head (excluding NPISH) remains 1.5% below its pre-economic downturn level. This is despite the fact that real household income per head (excluding NPISH) was 7.0% above its pre-economic downturn level in Q1 2016.
Since Q3 2011, real household spending per head has steadily increased, possibly reflecting improved economic sentiment among households. Increased spending per head on transport and recreation and culture, more than offset declines in expenditure per head on alcohol and tobacco, and education. In 2015 overall, real household spending per head (excluding NPISH) was 1.8% higher than 2014. The pace of growth between 2014 and 2015 was faster than the 1.4% growth seen between 2013 and 2014.
As with household income, for international comparisons it is important to consider benefits in kind. Real household and NPISH actual final consumption per head, which makes the adjustment for benefits in kind, can be found in the reference table.
Back to table of contents6. Wealth
This section considers 2 different measures of wealth; net worth from the national accounts and household wealth from the Wealth and Assets Survey (WAS).
Total net worth
In 2014, the net worth of the economy as a whole (of households, businesses and the government) increased by £385 billion (5.0%), to £8.1 trillion. Total net worth is the sum of the values of financial assets (for example, shares and deposits) and non-financial assets (for example, dwellings and machinery), minus financial liabilities. These measures have not been adjusted for inflation, which was 1.5% on average, as measured by the Consumer Price Index (CPI) between 2013 and 2014. This suggests that the growth in total net worth was stronger than the growth in the general price level between 2013 and 2014.
As shown in figure 5, the largest contribution to growth in whole economy net worth was from households and NPISH. The net worth of this sector grew by £1.0 trillion (12.2%) between 2013 and 2014, contributing 13.4 percentage points to total growth. As a result, net worth increased by £38,000 to £354,000 per household between 2013 and 2014. Positive contributions from the household and NPISH sector were offset by a decline in the net worth of financial corporations (negative £364 billion), non-financial corporations (negative £54 billion) and government (negative £227 billion). More information on this is available in the 2015 National Balance Sheet publication.
The net worth of the economy as a whole is important as it indicates the sustainability of current levels of production and corresponding income flows. It is possible that a nation might be increasing its output while its stock of assets decline. This could mean that its level of production is unsustainable. However, for a complete appraisal of sustainability, natural, human and social capital should also be considered.
Looking at the historical context, Figure 5 shows that between 2004 and 2007, total net worth increased year-on-year, mainly driven by increases in household and NPISH net worth. Total net worth contracted over the economic downturn in 2008 and 2009, but has since recovered, again, largely due to growth in the net worth of households and NPISH.
Figure 5: Contributions to growth of whole economy net worth by sector, 2005 to 2014, Current prices
UK
Source: Office for National Statistics
Notes:
- Here 'net' is used to decribe the net wealth position (assets minus liabilities), rather than making an adjustment for capital consumption.
- Components may not sum to total due to rounding.
- NPISH stands for Non-profit Institutions Serving Households.
Download this chart Figure 5: Contributions to growth of whole economy net worth by sector, 2005 to 2014, Current prices
Image .csv .xlsHousehold net worth
Household net worth increased by £1.0 trillion (12.2%) to £9.4 trillion between 2013 and 2014. This is the largest year-on-year percentage change since 1998, when household net worth grew by 13.8%. As with total net worth, household net worth has not been adjusted for inflation. As a result, these figures should be taken in some context. For instance, household net worth includes non-financial assets, such as houses, which experienced price growth of 10.0%2 in 2014.
An increase in the value of net financial assets (17%) was the main driver of growth in household net worth between 2013 and 2014. Dwellings - the most valuable household asset between 2004 and 2014 - increased by 9.1% between 2013 and 2014.
Figure 6: Household and Non-Profit Institutions Serving Households Net Wealth by Asset Type
UK
Source: Office for National Statistics
Notes:
- NPISH - Non Profit Institution Serving Households.
- Components may not sum to total due to rounding.
Download this chart Figure 6: Household and Non-Profit Institutions Serving Households Net Wealth by Asset Type
Image .csv .xlsDistribution of household wealth
In December 2015, the main results from the Wealth and Assets Survey (WAS) for the period July 2012 to June 2014 were published. Estimates from WAS are updated every 2 years, therefore different measures demonstrating the distribution of wealth will be presented at this point in each quarterly bulletin.
Figure 7 highlights that there was a greater degree of variance in median financial assets than median non-mortgage financial liabilities across regions from July 2012 to June 2014. The South East had the largest value of median financial assets (£13,800), while the North East had the smallest (£2,600). This means that the gap between the wealthiest and least wealthy region, in terms of median financial assets was £11,200. In comparison, the gap between regions in terms of highest and lowest median non-mortgage financial liabilities was £1,170 (South East £4,000, Wales £2,830).
When comparing regional financial wealth, it is important to consider the flow of income within those regions. One reason for this is that it might be expected that regions with higher incomes are associated with higher levels of financial wealth. As Figure 5 shows, higher income regions such as the South East, South West and East of England are associated with higher median levels of financial assets. However, the proportion of median financial wealth to median net equivalised income varies considerably by region. The ratio of median financial assets to median net equivalised income is 47.9% in the South East, compared with 11.8% in the North East. This suggests that there are factors, other than income, which influenced regional disparities in median household financial assets from July 2012 to June 2014.
Figure 7: Financial assets and wealth by region
UK

Source: Office for National Statistics, Wealth and Assets Survey
Download this image Figure 7: Financial assets and wealth by region
.png (34.7 kB) .xls (101.9 kB)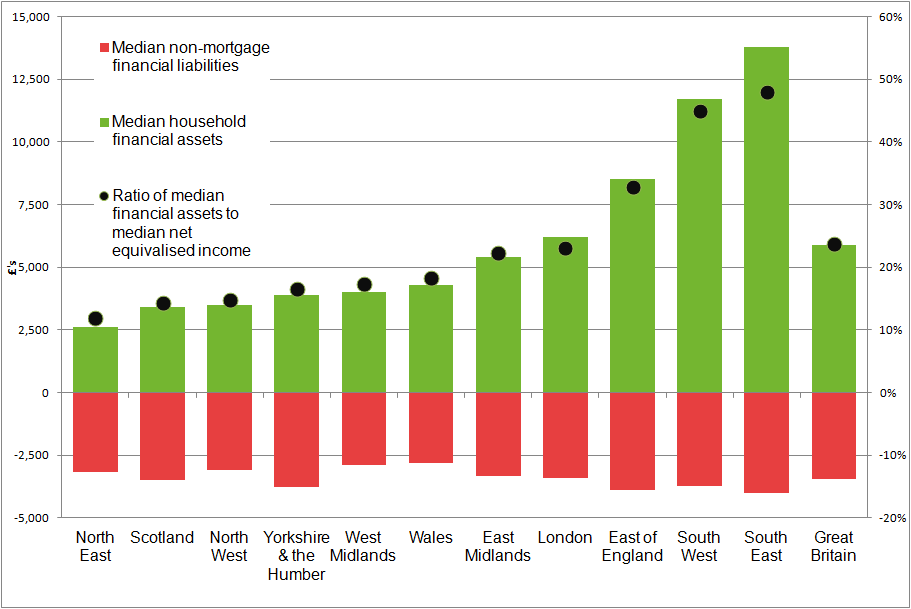
Notes for wealth
These measures are currently under development as part of the Measuring National Well-being programme and will be included in future releases where relevant.
Calculated using a mix-adjusted index, which adjusts house prices for the types of property being sold from 1 year to the next.
Here "net" is used to describe the net wealth position (assets minus liabilities), rather than making an adjustment for capital consumption.
Other non-financial assets includes “other buildings and structures”, “machinery and equipment”, “cultivated biological products”, “intellectual property products”, “inventories” and “contracts, leases and licences”.
Throughout this release Q1 refers to Quarter 1 (January to March), Q2 refers to Quarter 2 (April to June), Q3 refers to Quarter 3 (July to September) and Q4 refers to Quarter 4 (October to December).
7. Unemployment
Figure 8: Unemployment, Q1 2008 to Q1 2016
UK
Source: Office for National Statistics
Notes:
- All aged 16 and over.
- Seasonally adjusted.
- Q1 refers to Quarter 1 (January to March), Q2 refers to Quarter 2 (April to June), Q3 refers to Quarter 3 (July to September) and Q4 refers to Quarter 4 (October to December).
Download this chart Figure 8: Unemployment, Q1 2008 to Q1 2016
Image .csv .xlsIn the 3 months to March 2016 (Q1 2016) the unemployment rate was 5.1% – unchanged from Q4 2015. The unemployment rate has been on a downward trend since its post-economic downturn peak of 8.4% in Q4 2011. Since then it has fallen, on average, 0.2 percentage points per quarter to reach 5.1% in Q1 2016. As a result, the unemployment rate in Q1 2016 was 0.1 percentage points below its pre-economic downturn rate of 5.2%, recorded in Q1 2008.
Looking at unemployment by duration, the proportion of the unemployed population (aged 16 and over) who have been unemployed for over 12 months has been on a downwards trend in recent years. In Q1 2014, 36.9% of those unemployed had been so for over 12 months, which decreased to 27.6% in Q1 2016. This compares to an increase in the proportion of the unemployed that had been so for up to 6 months from 47.1% to 56.2% over the same period. The fact that unemployed people are, on average, spending less time in unemployment could be seen as a positive sign for people’s well-being with possible positive consequences for both household finances and life satisfaction.
The employment rate for those aged 16 to 64 increased to 74.2% in the 3 months to March 2016, the highest since comparable records began in 1971. This is up from 73.5% in the same quarter a year ago (Q1 2015). Our Labour Market Flows release shows that the inflows into employment from unemployment and inactivity are still greater than the outflows, resulting in net flows to employment. However, the employment net flow decreased on the quarter, with the inflow to employment decreasing for both unemployment and inactivity whilst outflows remained fairly stable. Moving from unemployment to employment can impact on economic well-being through individuals’ income, and may directly impact on their personal well-being (ratings of life satisfaction, sense that things they do in life are worthwhile, happiness and anxiety). The latest personal well-being information is available in our Measuring National Well-being: Personal Well-being in the UK, 2014 to 2015 release.
Alongside the record high employment rate, the inactivity rate for those aged 16 to 64 fell to 21.7% in the 3 months to March 2016, the joint lowest since records began. In Q1 2016 the main inflows to unemployment came from inactivity, and the net flow showed 101,000 individuals moving from inactivity to unemployment. Individuals moving from inactivity to unemployment could be seen as making a positive step towards employment.
Notes for unemployment
Throughout this release Q1 refers to Quarter 1 (January to March), Q2 refers to Quarter 2 (April to June), Q3 refers to Quarter 3 (July to September) and Q4 refers to Quarter 4 (October to December).
The Labour Market Flows statistics are experimental.
8. Inflation
Figure 9: Consumer Price Index (CPI) Inflation, Jan 2008 to May 2016
UK
Source: Office for National Statistics
Download this chart Figure 9: Consumer Price Index (CPI) Inflation, Jan 2008 to May 2016
Image .csv .xlsIn the year to March 2016 (the final month of Q1 2016) the rate of inflation, as measured by the Consumer Prices Index (CPI), was 0.5%. This was its highest rate since the year to December 2014, when it was also 0.5%. Throughout 2015 the CPI 12-month rate remained close to zero which means that, on average, consumers experienced very little change in prices compared with 2014. The rate of inflation has picked up and from November 2015 onwards the rate has been positive. In the year to March 2016 it was 0.2 percentage points greater than the 0.3% recorded in the year to February 2015 and the year to January 2016.
Looking at contributions to the March 12 month CPI rate, prices of transport, clothing and footwear and (to a lesser extent) restaurants and hotels have had an upward pull on the rate of inflation. These have been counterbalanced by a downward pull from price movements for food and non-alcoholic beverages.
Despite the rate of inflation being positive from November 2015 onwards, it remains weak in the historical context. In the year to May 2016 (the latest data point available), the rate was 0.3%, showing no change from the 0.3% recorded in the year to April 2016. Between the year to March 2016 and the year to April 2016, the rate of inflation fell 0.2 percentage points - the first fall since the year to September 2015.
The rate of inflation is important for economic well-being due to its effect on both income and savings. When prices increase faster than income for a sustained period, all else equal, incomes have less purchasing power and households feel worse off. Equally, if incomes increase faster than prices, over time, incomes can buy more and households feel better off. The income section of this release considers the evolution of household income, adjusted for inflation. In addition, inflation can impact on households through its effect on savings. If inflation is lower than the interest rates offered to households by financial institutions, then the real value of savings increases. Similarly, if inflation is higher than these interest rates then the real value of savings decreases.
Perceptions of inflation
It is important to consider not only inflation itself, but also individuals' perceptions of price trends. The Eurobarometer Consumer Survey asked respondents how they thought consumer prices had developed over the past 12 months. Individuals’ perceptions of price changes have mapped reasonably well to actual changes in price levels until May 2015, with the series diverging from June 2015 onwards. Since April 2015 respondents have perceived price changes to have been negative despite the CPI-12 month rate being 0.2% or higher since December 2015, suggesting that people’s perceptions of price changes have been less accurate in recent periods.
There has been a general downward trend since mid-2011, reaching a peak of 56.1 in July, with the aggregate balance falling to negative 9.2 in March 2016 (the last month of Q1 2016), slightly up from negative 10.6 in December 2015 (the last month of Q4). This compares with an aggregate balance of negative 10.5 in February 2016 and negative 9.9 in January 2016. An aggregate balance near zero implies that, on average, people perceive prices to be similar to that of a year ago whereas a negative figure means people perceive prices to have fallen over the last 12 months.
Notes for inflation
1.Throughout this release Q1 refers to Quarter 1 (January to March), Q2 refers to Quarter 2 (April to June), Q3 refers to Quarter 3 (July to September) and Q4 refers to Quarter 4 (October to December).
Back to table of contents