Table of contents
- Key findings
- Background
- Guidance on interpreting results
- Quality of care
- Dignity and respect
- Relief of pain
- Preferences and choice at the end of life
- Support for relatives, friends or carers at the end of life
- Response rates and NHS Area Team samples
- Uses and users of end of life care statistics
- Further information
- Acknowledgements
- References
- Background notes
- Methodology
1. Key findings
Overall quality of care is consistent across the majority of NHS Area Teams in England
Reports of ‘always’ being treated with dignity and respect are high across all medical professions, although numerous areas differ significantly from the national average
Relief of pain is managed least well at Home and this is more geographically consistent than any other aspect of care assessed
Across NHS Area Teams, between 48% and 58% of people died in their preferred place of death, with the majority of NHS Area Teams showing no significant difference from the national average
2. Background
The National Survey of Bereaved People (VOICES) collects information on bereaved peoples’ views on the quality of care provided to a friend or relative in the last three months of life, for England. The survey has been run in 2011 and 2012 and was commissioned by the Department of Health and administered by the Office for National Statistics (ONS). The End of Life Care Strategy published by the Department of Health in July 2008 set out a commitment to promote high quality care for all adults at the end of life and stated that outcomes of end of life care would be monitored through surveys of bereaved relatives (Department of Health, 2008).
In 2011 and 2012 survey publications were titled ‘National Bereavement Survey’. Following a request from the steering group, the survey name has been changed to ‘National Survey of Bereaved People’. This is to clarify that the survey is asked of bereaved people, rather than about bereavement.
This Statistical Bulletin reports on the combined results of the first and second national surveys of the bereaved to facilitate results to be presented for individual NHS Area Teams. These are the middle layer of health geography for England, with four NHS Regions being the highest, and 211 Clinical Commissioning Groups (CCGs) being the lowest.
National findings by individual year can be seen in the bulletins “National Bereavement Survey, 2011” and “National Bereavement Survey, 2012”.
Back to table of contents3. Guidance on interpreting results
This bulletin uses data from VOICES 2011 and 2012, which have been combined to enable detailed analysis at sub-national level. Combining the two years of data creates a larger sample size increasing the validity of the results. Results are presented in this bulletin for NHS Area Teams with data for each question provided in reference table 1 (284 Kb Excel sheet).
Despite combining two years of data, the sample size was not large enough to present the majority of results by individual CCG. This is because the small samples in each CCG are unlikely to be representative of the population within the CCG and reliable conclusions cannot be drawn from them. It has been possible to provide a selection of findings from questions that were answered by the majority of respondents, and these are presented in reference table 2 (325 Kb Excel sheet). Results are presented for the positive end of the response scale (e.g. ‘outstanding’ or ‘excellent’) because more people responded positively, so these estimates are more robust. Few people responded negatively (e.g. ‘poor’ or ‘never’) so these results are less reliable and therefore not presented.
The VOICES survey is based on a sample and as such is subject to variability in the results found. To aid interpretation, the confidence intervals are presented in the reference tables. These enable comparisons to be drawn between groups or areas and indicate the amount of uncertainty there is around a figure (the larger the interval, the greater the uncertainty). Where confidence intervals between two figures overlap, we cannot say with certainty that there is more than a chance difference between the figures. The confidence intervals for each of the NHS Area Teams commonly overlap with each other and this is important to consider when interpreting results (see background note 6).
The survey routes respondents to questions relevant to their situation and therefore some questions have more responses than others. For instance, few people experienced care in Hospices and the number of responses to Hospice related questions is far lower than to questions on themes such as support provided to carers at the end of a life, which are relevant to all respondents. Questions with fewer responses are less robust and consequently have wider confidence intervals, reducing the likelihood of significant differences between areas. As well as question response differences, VOICES is also subject to response bias and it is important to remember that the survey reflects the views of responders only and nothing is known about the experiences of people who do not respond.
Questions in the VOICES survey use a range of response option scales. For instance, overall quality of care is measured on a five point scale from ‘outstanding’ to ‘poor’, while quality of care by setting is measured on a four point scale from ‘excellent’ to ‘poor’. Caution should be taken in comparing results based on different scales, as differences in results can be caused by having a different number of response options for respondents to choose from. This is particularly true for comparing questions under the theme ‘Support for carer and the family’.
The aim of this bulletin is not to identify ‘best’ or ‘worst’ NHS Area Teams, but to provide an overview of the geographical spread of care quality. For example, some aspects of care may vary widely geographically and others may show little geographic variability. To help interpretation, average results are presented alongside the percentage point difference between the highest and lowest scoring areas. The percentage point difference can show where there is little geographic variability between NHS Area Teams (where the percentage point difference is small) and where there is wide variability (where the percentage point difference is great). This will help to inform where local or national policies are having an impact, or could be targeted.
Back to table of contents4. Quality of care
Overall quality of care
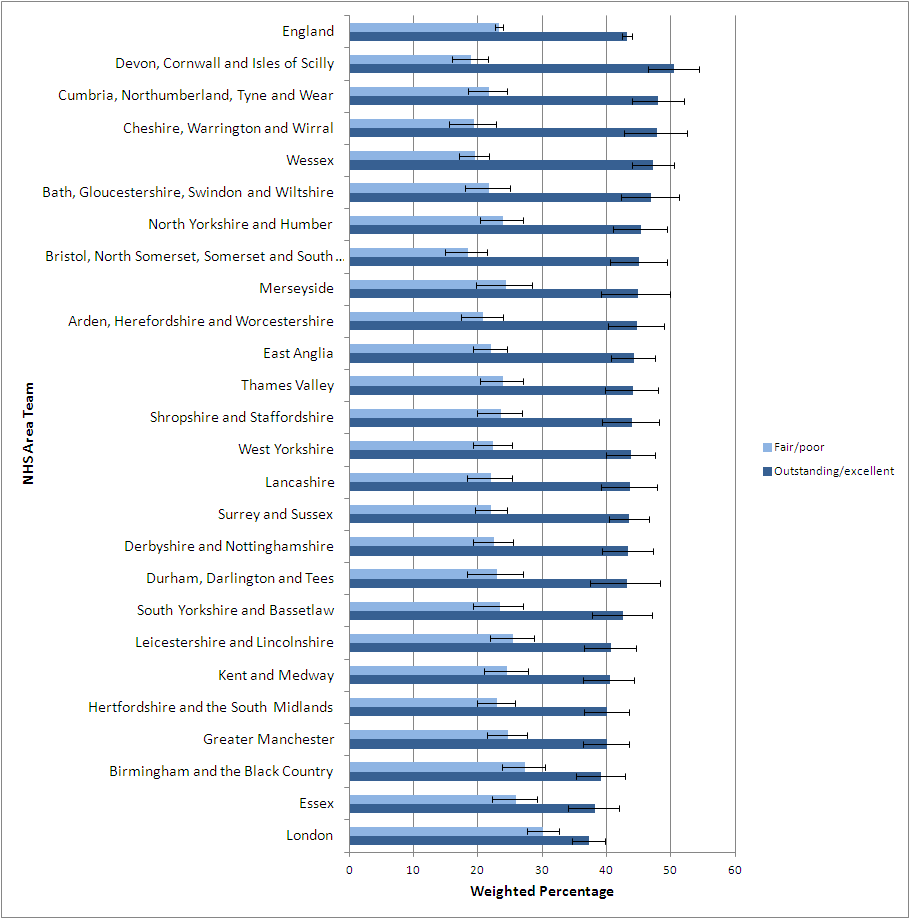
Overall quality of care provided in the last three months is a question answered by the majority of respondents. Quality of care, taking all services into account, is rated on a five point scale, from ‘outstanding’ to ‘poor’. The majority of people responded ‘excellent’. To aid interpretation, ‘outstanding’ and ‘excellent’ were combined at the top of the scale, and ‘fair’ and ‘poor’ at the bottom. Figure 1 presents results for each NHS Area Team for ratings of ‘outstanding/excellent’ and ‘fair/poor’.
For England, 43% of people rated care as ‘outstanding/excellent’, compared to 23% of ratings as ‘fair/poor’. All NHS Area Teams show greater proportions of ‘outstanding/excellent’ scores than ‘fair/poor', with less than one third of respondents rating care as ‘fair/poor’ within any area.
Results revealed little geographic variability in quality of care across England. Figure 1 illustrates that ‘Devon, Cornwall and the Isles of Scilly’, ‘Cumbria, Northumberland, Tyne and Wear’ and ‘Wessex’ NHS Area Teams are significantly higher than the national average, with ‘outstanding/excellent’ ratings of 51%, 48% and 47% respectively. In areas where ‘outstanding/excellent’ ratings are lower, proportions of ‘fair/poor’ care quality increase. ‘London’ and ‘Essex’ NHS Area Teams have significantly lower than average ratings of ‘outstanding/excellent’ (37% and 38% respectively), and the highest proportions of ‘fair/poor’ results (30%, 26% respectively).
Figure 1: Overall quality of care rated 'outstanding/excellent' or 'fair/poor'
NHS Area Teams, 2011-2012
Source: Office for National Statistics
Notes:
- Question 51 asks 'Overall, taking all services into account, how would you rate the quality of care in the last three months?' The five response options, 'Outstanding', 'Excellent',' Good', 'Fair' and 'Poor'. 'Outstanding and Excellent' and 'Fair and Poor' have been combined due to the majority of responses being given as 'Excellent'. 'Good' is not presented.
- NHS Area Teams are ordered with the highest average 'Outstanding/Excellent' score at the top of the figure.
Download this image Figure 1: Overall quality of care rated 'outstanding/excellent' or 'fair/poor'
.png (55.6 kB) .xls (47.6 kB)
While there is variability in quality of care between areas, the majority of NHS Area Teams do not differ significantly from each other. ‘Cumbria, Northumberland, Tyne and Wear’, ‘Wessex’ and ‘Essex’ only differ significantly by 0.1% and this small difference may not be replicated in future results. Some areas are not significantly different and this can be due to influences from sampling. For instance, ‘Cheshire, Warrington and Wirral’ is not significantly different from the national average, despite having a higher percentage of ‘outstanding/excellent’ than ‘Cumbria, Northumberland, Tyne and Wear’. This is due to ‘Wessex’ having a larger population and sample size and higher response rate than ‘Cheshire, Warrington and Wirral’ (see reference table 1 (284 Kb Excel sheet) ).
Map 1 displays NHS Area Teams which are significantly above and below the national average for overall quality of care rated ‘Outstanding/Excellent’. The map illustrates that the majority of NHS Area Teams do not differ significantly. The areas significantly below average both fall in the South East of England, while areas significantly above average are located in more rural areas in the North and South west. This suggests a possibility that demographic factors may influence the quality of care reported. Previous research on VOICES data has shown a link between deprivation and overall quality of care (ONS, 2013) and further research could usefully investigate a link between urban and rural areas and quality of care.
Map 1: NHS Area Teams performing above or below national average on overall quality of care, England, 2011-2012
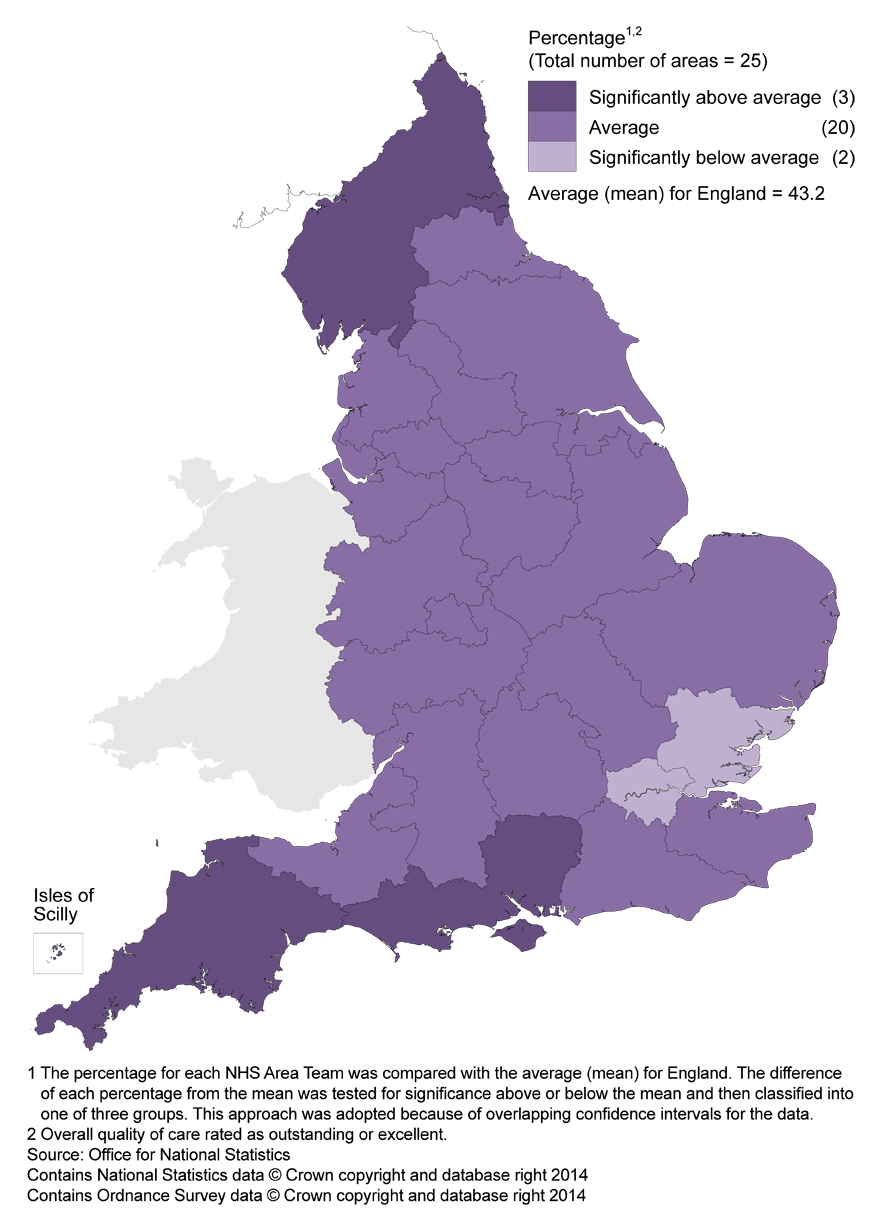
Source: National Bereavement Survey (VOICES) - Office for National Statistics
Download this image Map 1: NHS Area Teams performing above or below national average on overall quality of care, England, 2011-2012
.png (302.8 kB)
Quality of care in different settings
In addition to an overall measure of quality of care, quality of care was also assessed across different settings. Seven settings are reported by NHS Area Team: Out of Hours, District and Community Nurses, General Practitioners (GP’s), Care Homes, Hospital Doctors, Hospital Nurses and Hospices. Quality of care by setting is measured as ‘excellent’, ‘good’, ‘fair’ or ‘poor’. Table 1 shows the proportion of responses of ‘excellent’ across each setting, with the lowest and highest proportion of ‘excellent’ scores for each area. Geographic variability between NHS Area Teams is illustrated by the number of percentage points difference between the highest and lowest scoring areas; a low figure shows little variability, while a high figure shows quality of care varies widely in that setting.
Table 1 shows that in all care settings, at least one in four people rate the care as ‘excellent’. The quality of care is rated significantly higher in Hospices than in any other care setting (78%) although an 18 percentage point difference across NHS Area Teams suggests that care is more variable across NHS Area Teams in this setting. (It is worth noting that significantly fewer people experienced care in Hospices. This is demonstrated by the lower number of responses to this question.) Similarly, almost half (45%) of respondents rated the care that District Nurses provide as ‘excellent’, although this varies across NHS Area Teams by 19 percentage points with eight areas differing significantly from the national average. Care Homes are also rated as providing excellent care by almost half of respondents (45%), but there is less variability across NHS Area Teams (14 percentage points, and six NHS Area Teams differing significantly from the national average) than for District Nurses.
Care provided by Out of Hours services has the lowest proportion of people rating it as excellent quality (27%) while care provided within Hospitals is relatively consistent between Doctors and Nurses (12 percentage points difference). However, quality of care from Hospital Doctors has eight NHS Area Teams differing significantly from the national average, while for Hospital Nurses, only four areas are significantly different. Variability across NHS Area Teams in Hospitals is lower than in other settings.
The results show that different care settings vary in terms of their quality of care. Table 1 suggests that high care provision, high duration settings such as in Hospices and Care Homes provide better quality of care than the low care provision, low duration services offered by Out of Hours services. Despite this, evidence shows that the link between health care quality and cost is inconsistent (i.e. more expensive care is not necessarily better quality), with little known about what types of spending improves quality (Hussey et al., 2013).
Table 1: Overall quality of care across all settings rated as 'excellent'
| England, 2011-2012 | |||||
| Weighted percentage | |||||
| Setting | Number of question responses | Mean % Excellent | Lowest % Excellent | Highest % Excellent | Variability (% point difference) |
| Care Homes | 13,578 | 46.1 | 39.4 | 53.2 | 13.8 |
| District Nurses | 19,146 | 45.3 | 34.0 | 53.2 | 19.2 |
| GPs | 31,590 | 34.6 | 25.8 | 40.6 | 14.8 |
| Hospices | 4,876 | 77.5 | 67.5 | 85.3 | 17.8 |
| Hospital Doctors | 25,132 | 38.6 | 34.3 | 45.8 | 11.5 |
| Hospital Nurses | 27,055 | 36.9 | 32.7 | 44.9 | 12.2 |
| Out of Hours | 19,270 | 26.5 | 20.2 | 33.2 | 13.1 |
| Source: Office for National Statistics | |||||
| Notes: | |||||
| 1. The sample size for Hospices is significantly smaller than for other settings due to fewer people experiencing Hospice care. | |||||
Download this table Table 1: Overall quality of care across all settings rated as 'excellent'
.xls (34.3 kB)5. Dignity and respect
Another aspect of care was whether staff treated the patient with dignity and respect. This was assessed across seven different care settings: District and Community Nurses, GPs, Care Homes, Hospital Doctors and Hospital Nurses and Hospice Doctors and Hospice Nurses.
Reports of ‘always’ being treated with dignity and respect are high across all settings (50% to 85%). Hospice Doctors (85%) and Nurses (81%) receive the highest proportions of people perceiving that patients are ‘always’ treated with dignity and respect.
Respect from Nurses is significantly lower than for Doctors in both Hospices and Hospitals. Dignity and respect from Hospice Nurses varies across NHS Area Teams more than in any other setting (17 percentage points) and varies more than Hospice Doctors (14 percentage points) indicating a difference in consistency of dignity and respect between Doctors and Nurses within the same setting. Despite this, very few NHS Area Teams differ significantly from the national average for dignity and respect provided by Hospice Doctors and Nurses.
Hospital Doctors and Nurses show a similar level of consistency across NHS Area Teams (14 and 13 percentage points respectively), although Doctors are seen to always provide dignity and respect significantly more than Nurses in Hospitals (58% compared to 50%). Four NHS Area Teams differ significantly from the national average for respect shown from Hospital Nurses, and seven differ significantly for respect shown by Hospital Doctors.
Respect from District and Community Nurses and GPs is rated more highly than in Hospitals with 79% of District and Community Nurses and 72% of GPs always showing respect. Six NHS Area Teams are significantly below the national average in dignity and respect provided by Community Nurses and two are above average. Four NHS Area Teams are above average in the dignity and respect provided by GPs, while six areas are below the national average.
Care Homes show the lowest proportion of variability between NHS Area Teams for dignity and respect (12 percentage points) compared with other settings. Six NHS Area Teams differ significantly from the national average.
Table 2: Responses of 'Always' treated with dignity and respect, by setting
| England, 2011-2012 | |||||
| Weighted percentage | |||||
| Setting | Number of question responses | Mean % always | Lowest % always | Highest % always | Variability (% point difference) |
| Care Homes | 13,536 | 61.8 | 54.9 | 66.6 | 11.7 |
| District and Community Nurses | 19,037 | 78.6 | 67.0 | 83.6 | 16.6 |
| GP | 30,959 | 72.4 | 64.8 | 79.8 | 15.0 |
| Hospice Doctors | 4,380 | 85.1 | 76.4 | 90.1 | 13.7 |
| Hospice Nurses | 4,691 | 81.3 | 73.4 | 90.5 | 17.1 |
| Hospital Doctors | 24,396 | 57.9 | 52.7 | 66.0 | 13.3 |
| Hospital Nurses | 26,679 | 49.9 | 45.1 | 58.0 | 12.9 |
| Source: Office for National Statistics | |||||
| Notes: | |||||
| 1. The sample size for hospices is significantly smaller than for other settings due to fewer people experiencing hospice care. | |||||
Download this table Table 2: Responses of 'Always' treated with dignity and respect, by setting
.xls (34.3 kB)6. Relief of pain
How well pain was managed during the last three months of life was assessed in four settings: at Home, in Care Homes, in Hospitals and in Hospices. Pain was controlled ‘completely, all of the time’ most commonly in Hospices (63%) and least for patients at Home (18%). This significantly lower level of pain control for people at Home is consistent across NHS Area Teams, with only a 6 percentage point difference between the highest and lowest scoring areas and only one area differing significantly from the national average. Pain is managed ‘completely, all of the time’ in between 15% and 21% of cases in each NHS Area Team, compared to effective pain control in more than half (54% to 70%) of cases in Hospices. Despite the broader variability in pain relief provided by Hospices, no NHS Area Team differs significantly from the national average, due to the smaller sample size.
Relief of pain is managed more effectively in Care Homes than in Hospitals. In almost half of cases (45%) pain is managed ‘completely, all of the time’ in Care Homes compared to 37% in Hospitals. This may seem surprising given the onsite support available in Hospitals, but is consistent across all NHS Area Teams, with only a 10 percentage point difference between the highest and lowest. It is possible that this difference in pain control between settings reflects the ethos of different care providers; Hospitals being primarily for treatment and rehabilitation, while Hospices and Care Homes provide long term and palliative care. Different training and professional focus may affect the care provided in different settings.
Table 3: Responses of pain managed 'Completely, all of the time' by setting
| England, 2011-2012 | |||||
| Weighted percentage | |||||
| Setting | Number of question responses | Mean % Completely | Lowest % completely | Highest % completely | Variability (% point difference) |
| Home | 18,952 | 17.7 | 14.6 | 20.9 | 6.3 |
| Care Homes | 9,423 | 45.4 | 37.9 | 50.5 | 12.7 |
| Hospices | 3,810 | 62.6 | 54.4 | 70.2 | 15.7 |
| Hospital | 20,829 | 37.4 | 33.2 | 42.9 | 9.7 |
| Source: Office for National Statistics | |||||
| Notes: | |||||
| 1. The sample size for hospices is significantly smaller than for other settings due to fewer people experiencing hospice care. | |||||
| 2. The table refers to responses of pain managed 'Completely, all of the time'. | |||||
Download this table Table 3: Responses of pain managed 'Completely, all of the time' by setting
.xls (34.3 kB)7. Preferences and choice at the end of life
Respondents were asked if they knew where the deceased wanted to die. Only 30% of responders said that a preference had been expressed. 13% of respondents reported that the deceased ‘did not mind where they died’, ‘changed their mind’, or wanted to die ‘somewhere other than their Home, a Hospital or Care Home or Hospice’. Of those wanting to die ‘somewhere else’, this was commonly reported as a family member’s home or the home or country where they grew up.
The majority of people (71%) were reported to want to die at Home, while only 21% of people actually did. 14% of people wanted to die in a Care Home or Hospice compared with 27% who did and only 2% wanted to die in Hospital, although 52% did. Respondents were also able to write free text if the deceased wanted to die ‘somewhere else’ and some people took the opportunity to state that although the deceased did not want to die in Hospital, it was the most suitable place for them. This suggests that higher proportions of people dying in Hospital than wanted to, does not necessarily reflect poor care.
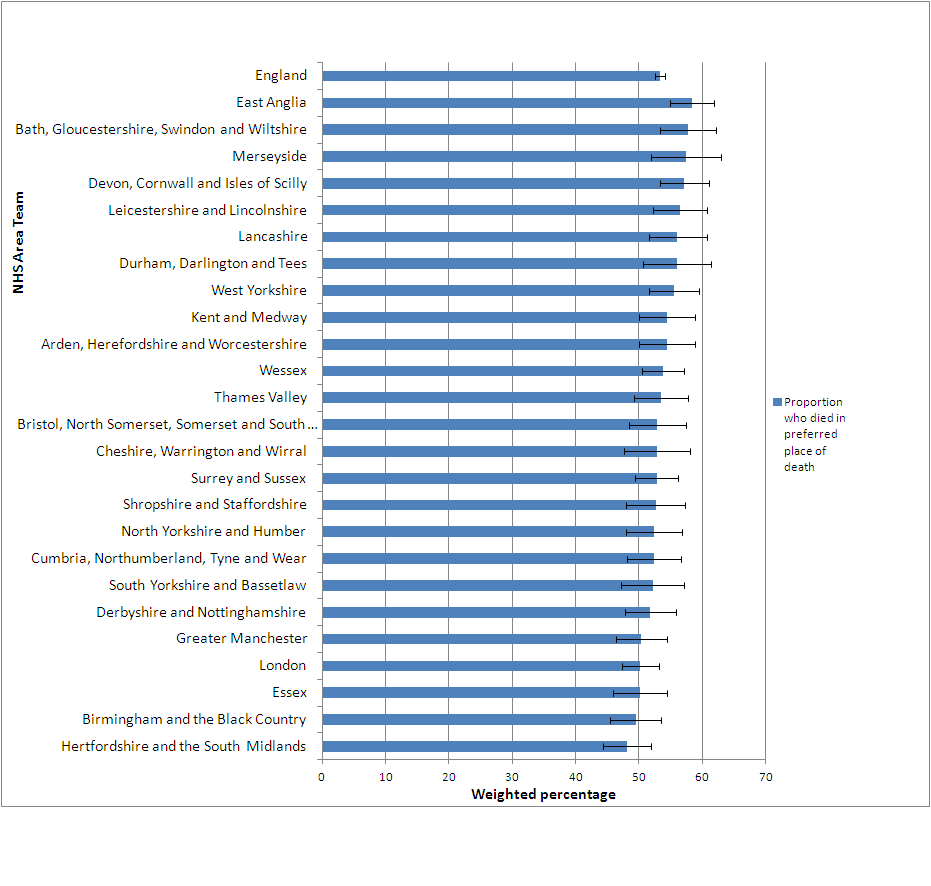
Figure 2 shows the proportion of people who died in their preferred place, by NHS Area Team. The data shows that across NHS Area Teams, between 48% and 58% of people died in their preferred place of death. The majority of areas do not differ significantly from each other in the proportion enabling people to die in their place of choice. ‘East Anglia’ is the only NHS Area Team that is significantly above the national average and only ‘Hertfordshire and the South Midlands’ is below average.
The preferred place of death tables in reference table 1 (284 Kb Excel sheet) show that the majority of people who died at Home, wanted to die at Home (between 95% and 100%). In contrast people who die in Hospital most commonly wish to die at Home (between 81% and 91%). Between 38% and 56% of people who died in Care Homes or Hospices wanted to die there, while most of those who did not, wanted to die at Home (between 44% and 60%).
Figure 2: Percentage of people who died in their preferred place
NHS Area Teams, 2011-2012
Source: Office for National Statistics
Notes:
- The proportion of people dying in their preferred place of death is calculated from the place of death registered on the death certificate and the deceased's preference as reported by the respondent.
- NHS Area Teams are ordered with the highest to lowest proportion of people dying in their preferred place of death.
Download this image Figure 2: Percentage of people who died in their preferred place
.png (53.9 kB) .xls (23.6 kB)
8. Support for relatives, friends or carers at the end of life
Some questions asked about the support the respondent and family of the deceased received after the death. This suite of questions all relate to support for the carer and family, but cannot be directly compared as they use different response options. For a yes/no response question, almost all (94%) of respondents said they/the deceased’s family were dealt with sensitively following the death and there is little variability across NHS Area Teams (6 percentage points difference, Table 5). Less than two thirds (60%) felt that they were ‘definitely’ given support at the time of death (26% said ‘to some extent and 14% ‘not at all’, Table 4). Over three quarters (78%) were involved in decisions relating to care as much as they wanted to be, with 22% wanting to be more involved and less than 1% wanting to be less involved (see Table 6).
The support given at time of death varied more widely across NHS Area Teams with a 13 percentage point difference between areas. Eight areas differed significantly from the national average. Variability of people feeling they were definitely ‘dealt with sensitively’ and ‘involved in decisions’ as much they wanted were both relatively low at 6%. For each of these questions, four NHS Area Teams differed significantly from the national average.
Table 4: Was the respondent given enough help and support by the healthcare team at the actual time of the death?
| England, 2011-2012 | |||||
| Weighted percentage | |||||
| Response | Number of question responses | Mean % | Lowest % | Highest % | Variability (% point difference) |
| Yes, definitely | 39,604 | 59.8 | 53.1 | 66.3 | 13.2 |
| Source: Office for National Statistics | |||||
Download this table Table 4: Was the respondent given enough help and support by the healthcare team at the actual time of the death?
.xls (24.6 kB)
Table 5: Staff dealt with the respondent in a sensitive manner
| England, 2011-2012 | |||||
| Weighted percentage | |||||
| Response | Number of question responses | Mean % | Lowest % | Highest % | Variability (% point difference) |
| Yes | 38,560 | 93.5 | 89.9 | 95.5 | 5.6 |
| Source: Office for National Statistics | |||||
Download this table Table 5: Staff dealt with the respondent in a sensitive manner
.xls (24.6 kB)
Table 6: The respondent was involved in decisions about care
| England, 2011-2012 | |||||
| Weighted percentage | |||||
| Response | Number of question responses | Mean % | Lowest % | Highest % | Variability (% point difference) |
| Respondent was involved as much as they wanted to be | 39,121 | 77.9 | 74.2 | 80.6 | 6.3 |
| Source: Office for National Statistics | |||||
Download this table Table 6: The respondent was involved in decisions about care
.xls (24.6 kB)9. Response rates and NHS Area Team samples
The VOICES survey has been run in 2011 and 2012. In 2011, respondents were selected from a sample of approximately one in six adults who died in England between November 2010 and June 2011. In 2012, respondents were selected from a sample of approximately one in three adults (aged 18+) who died between January and April the same year. The shorter sampling period allowed contact with respondents to occur 4 to 11 months after bereavement, which balances maximising accurate recall against avoiding the acute periods of grief which occur directly after a death and on the first anniversary.
In each year, the data were weighted to adjust for sampling and response biases. For this combined dataset, the weight was adjusted to account for the different sampling periods (see background note 8). The sample each year was selected to be representative of deaths in England, for instance place of death, cause of death and geographical area. Certain causes of death were excluded from the sample, such as those resulting from external or sudden causes, e.g. suicides and accidents.
There are 25 NHS Area Teams, which vary demographically and the analysis presented does not account for these differences. For example, urban and rural differences and deprivation levels may affect the actual quality of care available and the expectations of care delivery of the respondent. While these factors may influence results, they have not been controlled due to the aim of NHS England to provide a high standard of care, regardless of the demographics of the area.
The London NHS area team is distinct in that it covers the same area as the London NHS region. It therefore has the largest population (6.5 million people aged over 17) while all other areas have a population between approximately one and two million people. Naturally, London also has the highest number of deaths (45 thousand deaths in 2012), compared to between 11 and 25 thousand in all other areas.
Over the two survey years, 45,000 people have responded to the VOICES survey, representing 45% of people who have been contacted. NHS Area Team sample sizes vary between 2,407 in Merseyside and 9,968 in London. Response rates vary between 38% in London and 51% in Bath, Gloucestershire, Swindon and Wiltshire.
Approximately half of respondents in each NHS Area Team were female and half were aged over 80.
The most variable aspect of the sample was the proportion of the deceased living in a ‘most deprived’ area. This ranged between 4% in Thames Valley and 53% in Merseyside.
Further details on the demographics of the sample can be found in reference table 1 (284 Kb Excel sheet), sample details.
Back to table of contents10. Uses and users of end of life care statistics
The findings from this survey will be used by a range of users to evaluate the quality of end of life care.
The Department of Health commissioned this survey to follow up on a commitment made in the End of Life Care Strategy. The results of this survey will be used to inform policy decisions and to enable evaluation of the quality of end of life care in different settings, across different ages and different causes of death.
The Liverpool Care Pathway has provided a protocol for end of life care which has received criticism in a recent review (NHS England, 2013a). Following this review, the Leadership Alliance for the Care of Dying People has been established to provide improvements in end of life care (NHS England, 2013b). VOICES statistics provide data which will enable care quality to be monitored during this transitional period.
NHS England, are taking this work forward. Quality of end of life care is one of the key areas in the NHS Outcomes Framework. This has relevance for Domain 2 ‘Enhancing quality of life for people with long-term conditions’ and Domain 4 ‘Ensuring that people have a positive experience of care’. Indicator 4.6 ‘Improving the experience of care for people at the end of their lives’ uses data from the National Survey of the Bereaved (VOICES) to gather bereaved carers’ views on the quality of care in the last three months of life.
Other key users include the range of organisations and people involved in end of life work. These include the National End of Life Care Intelligence Network, the National End of Life Care Programme, academics, health researchers and charities. Service providers and policy makers also use the information to help determine their needs and assess their performance.
It is anticipated that members of the public, including survey respondents, will have a particular interest in the results of this survey.
We welcome feedback from users on the content, format and relevance of this release. Data users can post or email feedback to the address found in the Background Notes section.
Back to table of contents