This page contains data and analysis published by the Office for National Statistics (ONS) from 13 to 17 July 2020. Go to our live page for the most up-to-date insights on COVID-19.
17 July 2020
Deaths involving COVID-19 fell in June
Between 1 March and 31 June 2020, 218,837 deaths occurred in England and Wales. Of these deaths, 50,335 (23%) involved the coronavirus (COVID-19) with 46,736 of these having COVID-19 assigned as the underlying cause of death.
Of the deaths involving COVID-19 that occurred in England and Wales over that time period, there was at least one pre-existing condition in 91.1% of cases; this is a similar level to that shown in March to May. Dementia and Alzheimer disease was the most common main pre-existing condition found among deaths involving COVID-19 and was involved in 12,869 deaths (25.6% of all deaths involving COVID-19).
In June 2020, we continued to see a fall in the amount of deaths involving COVID-19. Mortality rates were down from the levels seen in May with the rate of deaths due to COVID-19 being 53.0 and 47.0 per 100,000 persons in England and Wales respectively; these are the lowest rates since March.
In June, 7.1% of all deaths (2,525 deaths) were due to COVID-19, making it the third most frequent underlying cause of death for the month. This represents a large decrease compared with May, when COVID-19 was the most frequent underlying cause of death and accounted for 21.6% of all deaths.
When looking at the split between the sexes, the rate of death due to COVID-19 fell for both in June. However, males continued to have a higher rate of death than females in England and Wales. The mortality rate for males was 65.1 deaths per 100,000 males compared with 43.3 deaths per 100,000 females.
The rate of deaths involving COVID-19 decreased between May and June 2020
Age-standardised mortality rates for deaths involving and due to COVID-19, per 100,000 persons, England and Wales, deaths occurring between March and June 2020

Source: Office for National Statistics – Deaths involving COVID-19
Notes:
- Figures exclude deaths of non-residents.
- Based on the date a death occurred rather than when it was registered.
- Figures are provisional.
- In this entry, we use the term “due to COVID-19” when referring only to deaths with an underlying cause of death as the coronavirus (COVID-19) and the term “involving COVID-19” when referring to deaths that had COVID-19 mentioned anywhere on the death certificate, whether as underlying cause or not.
- Age-standardised mortality rates (ASMRs) per 100,000 population, standardised to the 2013 European Standard Population.
Download this image The rate of deaths involving COVID-19 decreased between May and June 2020
.png (12.6 kB) .xls (58.4 kB)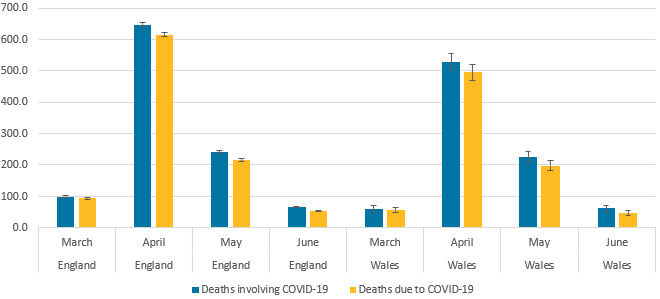
16 July 2020
UK labour market
Our latest figures on the UK labour market have now been published.
Early indicators for June 2020 suggest that the number of employees in the UK on payrolls is down around 650,000 compared with March 2020. The largest falls were seen at the start of the coronavirus (COVID-19) pandemic and while the number of payroll employees is still falling, the decline is slowing. Flows analysis suggests that the falls in May and June were mainly because of fewer people entering the labour market.
Inflows into paid employment continued to fall, while outflows have fallen below their long-term average
Month-on-month change in paid employment and contributions to this change from inflows (positive) and outflows (negative), seasonally adjusted, UK, January 2017 to June 2020
Source: HM Revenue and Customs – Pay As You Earn Real Time Information
Notes:
- The latest period is based on early data and therefore could be subject to revisions.
- Testing of these experimental data indicates a tendency for both inflows and outflows to be revised downwards. For this reason, additional caution should be used when interpreting these statistics. The scale of these revisions should not affect the broad analysis presented in the bulletin text.
Download this chart Inflows into paid employment continued to fall, while outflows have fallen below their long-term average
Image .csv .xlsThe headline indicators of employment and unemployment are largely unchanged, but there are some signs of inactivity rising, with people out of work not currently looking for work.
There is still a large number of people temporarily away from work, including furloughed workers, although this was falling through May. New analysis shows that there was around 450,000 people away from work because of the coronavirus pandemic and receiving no pay.
Between March to May 2019 and March to May 2020, total actual weekly hours worked in the UK decreased by 175.3 million, or 16.7%, to 877.1 million hours. This was the largest annual decrease since estimates began in 1971, with total hours dropping to its lowest level since May to July 1997.
Pay fell for most measures in April 2020, declining more in industries where furloughing was most prominent, many of these being the lowest-paying industries, in particular accommodation and food service activities.
Vacancies in the UK in April to June 2020 were at the lowest level since the survey began in April to June 2001, at an estimated 333,000.
The Claimant Count, an Experimental Statistic, fell slightly in June 2020, reaching 2.6 million. This is still an increase of 1.4 million compared with March 2020.
14 July 2020
GDP, March to May 2020
UK gross domestic product (GDP) fell by 19.1% in the three months to May 2020, as government restrictions on movement dramatically reduced economic activity. Today’s GDP monthly estimate release captures the direct effects of the coronavirus (COVID-19) pandemic across the economy.
All the headline sectors provided a negative contribution to GDP growth in the three months to May 2020. The services sector fell by 18.9%, production by 15.5% and construction by 29.8%.
There have been large falls in the three months to April 2020, and the three months to May 2020, when compared to quarterly growth rates
UK GDP growth, Quarter 1 (Jan to Mar) 2005 until March to May 2020
Embed code
Monthly GDP grew by 1.8% in May 2020 but was still well below the levels seen in February 2020. The level of output had not recovered from the record falls seen in March and April 2020, and the change in GDP from February to May 2020 was negative 24.5%.
14 July 2020
Services, production and construction
The economy has experienced a significant shock since the start of the coronavirus (COVID-19) pandemic. The Index of Services, Index of Production and construction output all remained well below their February 2020 levels in May 2020.
A detailed analysis of the impact on the output of businesses has been published in Coronavirus and the impact on output in the UK economy: May 2020.
The output of services industries remained 24.4% below the level of February 2020, growing only by 0.9% in May. The production industries remained 19.1% below their February 2020 level, even after growth of 6.0% in May.
Services industries that are linked to retail activity had a boost in May 2020, particularly from online sales. Many other services industries contracted in May 2020, citing a lack of demand from their business customers, following the earlier impact of the coronavirus pandemic.
Some of the industries in production and services saw a small rise in May 2020, but most remained substantially below their February 2020 level
Index for various industries, seasonally adjusted, UK, January 2018 to May 2020
Embed code
Construction output grew by a record 8.2% in the month-on-month all work series in May 2020 following the record decline of 40.2% in April 2020; the level of construction output was down 38.8% on February 2020 before the impact of the coronavirus pandemic. Total housing work drove much of the fall from February, but housebuilders began to return to construction sites during May, while operating according to social distancing measures.
14 July 2020
UK trade
Falls in imports and exports in the three months to May 2020 are detailed in today’s UK trade publication. This includes falls in both trade in goods and trade in services.
This release covers UK trade data for March to May 2020, during which the UK, as well as many of its major trading partners, introduced lockdown measures to combat the coronavirus (COVID-19).
The total trade balance, excluding non-monetary gold and other precious metals, decreased by £5.2 billion to a deficit of £1.7 billion in the three months to May 2020. Exports fell £47.7 billion to £120.4 billion, while imports fell by £42.6 billion to £122.1 billion.
Total exports and imports, excluding precious metals, remained low in May 2020, following large falls in March and April
Total trade exports and imports, excluding non-monetary gold and other precious metals, month-on-month May 2019 to May 2020
Source: Office for National Statistics – UK trade
Download this chart Total exports and imports, excluding precious metals, remained low in May 2020, following large falls in March and April
Image .csv .xls13 July 2020
Multigenerational households
Older people have been shown to be particularly vulnerable to the coronavirus (COVID-19). Over 80% of deaths registered up to 26 June 2020 that mention COVID-19 on the death certificate in England and Wales relate to someone aged 70 years or over.
Most people in the UK aged 70 years or over either live alone (44%) or with just one other person (47%), the majority of whom are another adult aged 50 years or over.
However, a small proportion of the population in this age group live as part of a larger household with a mix of ages, and this is more common among people from certain ethnic groups.
People aged 70 years or over of Bangladeshi or Pakistani ethnicity are more likely to live with those from a range of ages compared with people of white ethnicity of the same age group.
Three-quarters of households containing someone aged 70 years or over whose ethnicity is White are either single-person households or only have people aged 70 years or over within them.
This compares with around a quarter of households that have at least one person aged 70 years or over whose ethnic group is Bangladeshi. Just over half of these households contain more than one generation living together with at least one person aged 0 to 19 years, one person aged 20 to 69 years and one person aged 70 years or over.
Older people living in households with younger adults and children may be more exposed to COVID-19, as these younger people go out to work or return to school.
To understand more about people of different ages living together at a local level, explore our map showing people aged 70 years or over living in households with people aged under 60 years from the 2011 Census.
Households containing someone aged 70 years or over are more likely to contain a mix of ages living together if that person’s ethnicity is Bangladeshi or Pakistani
Proportion of households with at least one person aged 70 years or over by ethnic group of that person, by mix of ages in the household, UK, 2018
Embed code
Other age groupings are available to download.
13 July 2020
Covering a sudden loss of household income
We have published analysis of households’ ability to cope with a sudden fall in employment income for a period of up to three months – a situation faced by many households during the coronavirus (COVID-19) lockdown.
The analysis is based on responses to our Wealth and Assets Survey between April 2016 and March 2018. In each case, the income loss is compared with financial assets (such as savings) held but does not consider any counteracting income support from the government. The analysis includes households in Great Britain where the household head is employed (or self-employed).
By industry, households where the head works in accommodation and food services, largely shut down since the end of March (67% of workforce furloughed), are least equipped to cope with a loss of income.
In this industry, just over a quarter of households (28%) had insufficient financial assets (such as savings) to cover a 20% drop in employment income for a single month. This rises to 39% if the drop was sustained for two months and 41% for a three-month period (the lockdown period to date).
Households where the head is employed in industries with lower rates of furloughing, such as IT and professional services, are more likely to be able to cover a drop in employment income.
Households where the head works in accommodation and food services are least likely to be able to cover a loss of income
Percentage of households unable to cover a three-month loss of employment income, by industry in which household head works, Great Britain, April 2016 to March 2018
Embed code
Renting households are less likely than homeowners to have enough savings to cope with a fall in employment income. By region, renting households in the North East appear to be most vulnerable financially – 42% would be unable to cover a 20% loss of income for one month, rising to 65% (almost two-thirds) if the loss were sustained for three months.
Meanwhile, by household type, single parents of dependent children are least likely to be able to cover a loss of income. Considering employees only, 50% of lone parent households with dependent children would be unable to cover three months with 20% less employment income.
In line with our previous analysis, households of all types (children or no children) are generally more resilient to an income shock if the head of household is self-employed. There is evidence that self-employed households have higher formal financial wealth, on average, than employee households; the median value of household formal financial assets for self-employed-led households is £12,000, compared with £8,200 for employee-led households (WAS, April 2016 to March 2018).