Table of contents
- Main points
- Statistician’s quote
- Things you need to know
- The UK population mainly identifies as heterosexual or straight
- Males are more likely to identify as gay, lesbian or bisexual than females
- London has the largest percentage of the population who identify as gay, lesbian or bisexual
- Lesbian, gay and bisexual population are most likely to be single, never married or civil partnered
- Links to ONS related statistics
- What has changed within this publication?
- Quality and methodology
- Background notes
1. Main points
In 2015, 1.7% of the UK population identified themselves as lesbian, gay or bisexual (LGB).
More males (2.0%) than females (1.5%) identified themselves as LGB in 2015.
Of the population aged 16 to 24, there were 3.3% identifying themselves as LGB, the largest percentage within any age group in 2015.
The population who identified as LGB in 2015 were most likely to be single, never married or civil partnered, at 68.2%.
Back to table of contents2. Statistician’s quote
Pamela Cobb, Population Statistics Division, Office for National Statistics
Follow Population Statistics Division on Twitter @PaulVickers_ONS
Back to table of contents3. Things you need to know
Sexual identity is one part of the umbrella concept of “sexual orientation”. Sexual identity does not necessarily reflect sexual attraction or sexual behaviour – these are separate concepts which the Office for National Statistics (ONS) currently does not measure.
Sexual identity estimates are based on social survey data from the Annual Population Survey (APS). The questions collect information on self-perceived sexual identity from the household population aged 16 and over in the UK.
Currently no further breakdown of the category “Other” is collected.
This bulletin presents percentages. Estimates of the population numbers and measures of quality (to show the levels of uncertainty associated with survey estimates) are presented in the datasets. You are advised to consult the quality measures when interpreting the estimates.
Back to table of contents4. The UK population mainly identifies as heterosexual or straight
In 2015, the Annual Population Survey found 1.7% of adults in the UK identified themselves as lesbian, gay or bisexual (LGB) (Figure 1). This comprised:
1.1% who identified themselves as gay or lesbian
0.6% who identified themselves as bisexual
A further 0.4% of the population identified themselves as “Other” which means that they did not consider themselves to fit into the heterosexual or straight, bisexual, gay or lesbian categories.
A larger group, 4.1%, refused or didn’t know how to identify themselves.
Figure 1: Sexual identity, UK, 2015
Percentages
Source: Office for National Statistics
Notes:
- Quality measures (including confidence intervals and coefficient of variance) for the estimates are displayed within the datasets.
- Totals may not sum to 100% due to rounding.
Download this chart Figure 1: Sexual identity, UK, 2015
Image .csv .xls5. Males are more likely to identify as gay, lesbian or bisexual than females
Around 2.0% of males identified themselves as lesbian, gay or bisexual (LGB) in 2015; this compared with 1.5% of females identifying as LGB (Figure 2).
Figure 2: Sex by gay or lesbian and bisexual population, 2015
UK
Source: Office for National Statistics
Notes:
- Quality measures (including confidence intervals and coefficient of variance) for the estimates are displayed within the datasets.
- Totals may not sum due to rounding.
Download this chart Figure 2: Sex by gay or lesbian and bisexual population, 2015
Image .csv .xlsIn the UK, the Annual Population Survey found that 1.6% of males identified themselves as gay or lesbian and a further 0.5% identified themselves as bisexual. For females the picture was quite different with only 0.7% identifying as gay or lesbian, with a larger percentage (0.8%) identifying as bisexual.
Figure 3: Age by gay or lesbian and bisexual population, 2015
UK
Source: Office for National Statistics
Notes:
- Quality measures (including confidence intervals and coefficient of variance) for the estimates are displayed within the datasets.
- Totals may not sum due to rounding.
Download this chart Figure 3: Age by gay or lesbian and bisexual population, 2015
Image .csv .xlsLarger proportions of younger people identified themselves as LGB in 2015. Within the 16 to 24 year old category, 3.3% identified themselves as LGB compared with 0.6% of those aged 65 and over. Figure 3 shows that older age groups were more likely to identify as heterosexual or straight, with the percentage that identified themselves as heterosexual or straight becoming larger for each consecutive age group. For all age groups, except the 16 to 24 year olds, the percentage that identified themselves as gay or lesbian was larger than the percentage that identified themselves as bisexual.
One reason for this pattern may be that younger people could be more likely to explore their sexuality combined with more social acceptability of sexual identities and the ability to express these.
Back to table of contents6. London has the largest percentage of the population who identify as gay, lesbian or bisexual
In 2015, the population of London had the largest percentage who identified themselves as lesbian, gay or bisexual (LGB) at 2.6% (Figure 4). This may be associated with a young age structure or the ethnic diversity of the population of London. The North West had the second largest proportion with 2.0% of the population identifying as LGB.
The East of England had the lowest percentage of the population identifying as LGB at 1.2%, this could be associated with an older age structure of the population in this region.
Figure 4: English Region and UK Country by gay or lesbian and bisexual population, 2015
UK

Source: Office for National Statistics
Notes:
- Quality measures (including confidence intervals and coefficient of variance) for the estimates are displayed within the datasets.
Download this image Figure 4: English Region and UK Country by gay or lesbian and bisexual population, 2015
.png (16.6 kB) .xls (27.1 kB)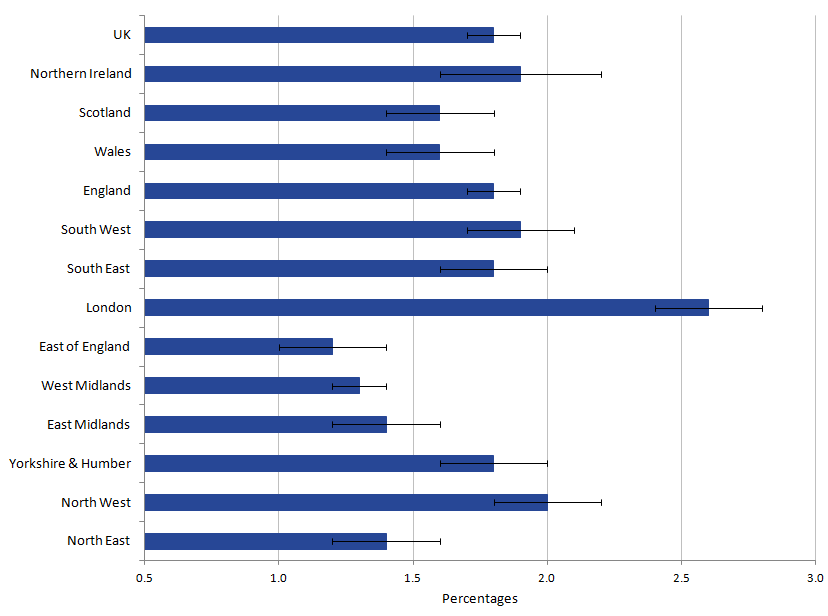
Within the countries of the UK, Northern Ireland had the highest percentage of the population identifying as LGB (1.9%), this was closely followed by England with 1.8% of the population. The difference between the 2 countries can be seen in more detail when looking at the population who identify as gay or lesbian and the population who identify as bisexual. In England, 1.2% identified themselves as gay or lesbian and 0.6% as bisexual. In Northern Ireland, only 0.8% identified themselves as gay or lesbian and 1.1% as bisexual.
Scotland and Wales both had the lowest percentage (1.6%) identifying as LGB.
Back to table of contents7. Lesbian, gay and bisexual population are most likely to be single, never married or civil partnered
Figure 5 shows the legal marital status distribution of those who identified themselves as lesbian, gay or bisexual (LGB) in 2015. The LGB population are most likely to be single (68.2%). This could be associated with:
the young age structure of the population that identify themselves as LGB
legal unions available to same-sex couples are relatively new
Figure 5: Lesbian, gay and bisexual population by legal marital status, 2015
UK
Source: Office for National Statistics
Notes:
- Single, never married or civil partnered.
- Married includes separated.
- The Marriages (Same Sex Couples) Act 2013 made provision for the marriage of same sex couples in England and Wales from 29th March 2014 onwards.
- Civil Partnerships were introduced in England and Wales in December 2005. Includes separated.
Download this chart Figure 5: Lesbian, gay and bisexual population by legal marital status, 2015
Image .csv .xlsThe second most common marital status for the LGB population was to be in an opposite-sex marriage (13.1%). People who identify themselves as bisexual make up the majority of the LGB population in opposite-sex marriages.
The LGB population who are single may be in same-sex cohabiting couples. In the UK, 0.5% of families are same-sex cohabiting couple families.
In 2015, of the LGB population 14.0% were in a civil partnership or a same-sex marriage, 4.1% were divorced or had dissolved a civil partnership and 0.6% were widowed or a surviving partner from a civil partnership.
Figure 6: Ethnicity by gay or lesbian and bisexual population, 2015
UK
Source: Office for National Statistics
Notes:
- 0.1% of respondents to the APS did not have an ethnicity recorded, 0.2% of those identified themselves as LGB.
Download this chart Figure 6: Ethnicity by gay or lesbian and bisexual population, 2015
Image .csv .xlsIn 2015, the Annual Population Survey found that 1.8% of the population who describe their ethnicity as “White” also identified themselves as LGB. The highest percentage was seen amongst those who describe their ethnicity as “Mixed or Multiple ethnic groups” where 2.5% identified themselves as LGB.
Smaller percentages were seen for those who are “Asian or Asian British” (0.8%), “Black, African, Caribbean or Black British” (1.0%) and “Other ethnic group” (1.7%).
Figure 7: NS-SEC by gay or lesbian and bisexual population, 2015
UK
Source: Office for National Statistics
Notes:
- Routine and Manual includes the "Never worked and long-term unemployed" category.
- Examples of jobs for each category are: Routine and Manual: Labourers, bar staff. Intermediate: Bank staff, paramedics. Managerial and Professional: Doctors, Lawyers.
Download this chart Figure 7: NS-SEC by gay or lesbian and bisexual population, 2015
Image .csv .xlsFigure 7 shows that 2.2% of the population who are in managerial and professional occupations identified themselves as LGB, while 1.6% of those in both intermediate, and routine and manual occupations identified themselves as LGB.
Back to table of contents9. What has changed within this publication?
This is the first time that sexual identity estimates have been published in a separate publication.
Back to table of contents10. Quality and methodology
In 2006, the Office for National Statistics (ONS) established a sexual identity project to meet user requirements for information on sexual identity and to address a gap in the lack of sufficient and reliable sources of data on sexual orientation which was identified in the ONS-led cross-government Review of Equality Data.
The project was concluded with the sexual identity question being added to the Integrated Household Survey (IHS) in 2009. Sexual identity guidance and project documentation is available.
We are currently taking forward a research and testing plan to help determine how and whether to meet user need for sexual identity information identified as part of the 2021 Census topic consultation. This plan includes work to develop statistics from ONS social surveys and to investigate the feasibility of producing sexual identity estimates at lower levels of geography.
Sexual identity estimates were previously produced from the Integrated Household Survey (IHS), the IHS questions were removed from the Living Costs and Food Survey in 2014. The IHS variables (including sexual identity) were added to the Annual Population Survey (APS) in 2014 but they were still subject to IHS methodologies. The IHS variables were fully integrated into the APS in 2015 and are now subject to APS methodologies. A consistent back series from 2012 and a comparison of the estimates produced from the IHS and the APS are available.
The sexual identity question is asked of respondents aged 16 years and over; it is not asked by proxy. Proxy interviews are defined as those where answers are supplied by a third party, who is usually a member of the respondent’s household.
The sexual identity question is asked in both face-to-face and telephone interviews, at first personal contact. During the face-to-face interviews, adults were asked: "Which of the options on this show card best describes how you think of yourself?" For telephone interviews, a slightly different way of collecting the information was used: "I will now read out a list of terms people sometimes use to describe how they think of themselves". The list is read out to respondents twice. On the second reading, the respondent has to say "stop" when an appropriate term they identified with is read out. In both modes, the order in which the terms appeared, or are read out, is unique for each household’s respondent to ensure confidentiality.
The "Other" option on the question is included to address the fact that not all people will consider they fall in the first 3 categories, that is, heterosexual or straight, gay or lesbian, or bisexual.
The Sexual identity Quality and Methodology Information document contains important information on:
- strengths and limitations of the data
- the quality of the output: including the accuracy of the data and how it compares with related data
- uses and users
- how the output was created
ONS publishes sexual identity estimates for the UK and constituent countries only.
There is a revisions policy for population statistics available.