1. Main points
The employment rate in Great Britain was highest in the South East (77.0%) and lowest in Wales and the North East (69.8%)
The unemployment rate in Great Britain was highest in the North East (7.7%) and lowest in the South East (4.2%)
The inactivity rate in Great Britain was highest in Wales (25.5%) and lowest in the South West and the East of England (19.4%)
The headline Claimant Count rate in Great Britain was highest in the North East (4.0%) and lowest in the South East and the South West (1.3%)
2. In this bulletin
This bulletin shows the latest main labour market statistics for the regions and countries of Great Britain, along with statistics for local authorities, travel-to-work areas and parliamentary constituencies.
Data for Northern Ireland are available separately.
Updated this month
Labour Force Survey estimates for the period December 2014 to February 2015. Claimant Count for March 2015. Annual Population Survey estimates for the period January 2014 to December 2014.
Also in this release
Workforce Jobs estimates for December 2014. Public and private sector employment for December 2014.
Back to table of contents3. Overview of regional labour market published 17 April 2015
The employment rate estimates for those aged 16 to 64, for the 3 months to February 2015, compared to the 3 months to November 2014, showed increases for nearly all of the regions and countries of the UK.
The largest increases in the employment rate estimates were for the North West and Wales, at 1.1 percentage points. The only region to show an estimated decrease for the latest period was the East of England, at only 0.1 percentage point.
For all regions, including the East of England, the general pattern is for flat or gently increasing employment rates. With the exception of Wales, the latest employment rate estimates are higher than the same period 1 year ago.
The 3 regions with the highest employment rates continue to be the South East, at 77.0%, South West, at 76.8% and East of England, at 76.5%.
The employment levels for the North West, Yorkshire and The Humber, South East and South West are all at record highs, with most other regions close to record highs.
Regional estimates for the unemployment rate are quite volatile, which needs to be allowed for when considering the pattern of change over time.
There were no large increases in the unemployment rate estimates for the 3 months to February 2015, compared to the 3 months to November 2014.
The largest decreases in the unemployment rate estimates were for the North East and Wales, at 0.8 percentage points and North West, at 0.7 percentage points.
For all regions, the general pattern is for flat or gently falling unemployment rates. All regions are showing decreases in the unemployment rate compared with a year ago.
The unemployment rate for the North East remains the highest in the UK, at 7.7%.
The Claimant Count for March 2015 compared with February 2015, is showing decreases in the count for both men and women across all regions of the UK. However, the rate of decrease in the North East has slowed compared with the rest of the UK.
Back to table of contents4. Employment
The employment rate for people aged from 16 to 64 for the UK was 73.4%, for the period December 2014 to February 2015.
The regions with the highest rate in Great Britain were the South East, at 77.0%, followed by the South West, at 76.8% and the East of England, at 76.5%. The regions with the lowest rate were Wales and the North East, both at 69.8%, followed by the West Midlands, at 70.8% and the North West, at 71.6%.
The regions with the largest increase in the employment rate on the previous period (September 2014 to November 2014), were Wales and the North West, both with an increase of 1.1 percentage points, followed by the East Midlands, with an increase of 0.7 percentage points and London, with an increase of 0.6 percentage points. The only decrease in the employment rate was in the East of England, with a decrease of 0.1 percentage point. The West Midlands and Scotland remained unchanged. The UK employment rate increased by 0.5 percentage points.
Figure 1: Employment rates by region and comparison year on year, December 2014 to February 2015, seasonally adjusted
Source: Labour Force Survey - Office for National Statistics
Download this chart Figure 1: Employment rates by region and comparison year on year, December 2014 to February 2015, seasonally adjusted
Image .csv .xlsOver the year, the regions with the largest increase in the employment rate were the East Midlands, with an increase of 2.1 percentage points, followed by the North West, with an increase of 1.8 percentage points. The only decrease in the employment rate was in Wales, at 1.1 percentage points. The East of England had the smallest increase, of 0.6 percentage points.
Back to table of contents5. Unemployment
The unemployment rate for people aged 16 and over for the UK was 5.6%, for the period December 2014 to February 2015.
The regions with the highest rate in Great Britain were the North East, at 7.7%, followed by the West Midlands, Wales, Yorkshire and The Humber, and London, all at 6.2%. The regions with the lowest rate were the South East, at 4.2%, followed by the South West, at 4.6%.
The regions with the largest decrease in the unemployment rate on the previous period (September 2014 to November 2014), were the North East and Wales, both at 0.8 percentage points, followed by the North West, at 0.7 percentage points and Yorkshire and The Humber, at 0.6 percentage points. There were 2 regions with an increase in the unemployment rate: Scotland, at 0.3 percentage points and the South West, at 0.2 percentage points. The unemployment rate in the East of England and the West Midlands both remained unchanged. The UK rate decreased by 0.3 percentage points.
Figure 2: Unemployment rates by region, December 2014 to February 2015, seasonally adjusted
Source: Labour Force Survey - Office for National Statistics
Download this chart Figure 2: Unemployment rates by region, December 2014 to February 2015, seasonally adjusted
Image .csv .xlsOver the year, all regions showed a decrease in the unemployment rate. The largest decreases were in Yorkshire and The Humber, at 2.2 percentage points, the East Midlands, at 2.1 percentage points and the West Midlands, at 2.0 percentage points. The smallest decrease in the unemployment rate was in the South West, at 0.3 percentage points.
An interactive chart showing regional unemployment rates over time is available on our website.
Back to table of contents6. Workforce Jobs (first published on 18 March 2015)
Workforce Jobs increased in 7 of the 11 regions of Great Britain between September 2014 and December 2014. The largest increase of 40,000 was in the South East, followed by the South West, which increased by 30,000. The largest decrease of 14,000 was in Yorkshire and The Humber, followed by the East of England and Scotland, which both decreased by 10,000.
The East Midlands had the highest proportion of jobs in the production sector, at 13.7%, whilst London had the lowest proportion, at 2.9%. For the service sector, London had the highest proportion, at 91.8%, whilst Wales had the lowest proportion, at 78.0%.
Figure 3: Workforce Jobs by broad industry group and by region, December 2014, seasonally adjusted
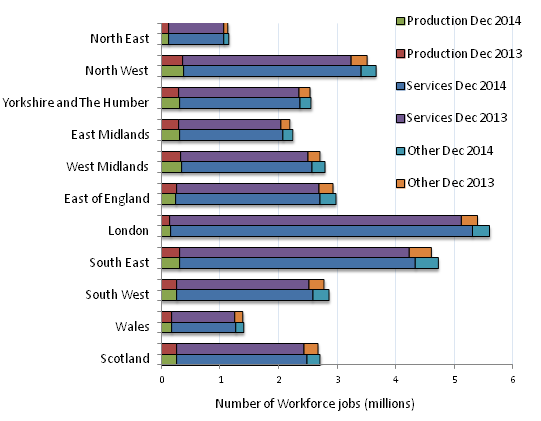
Source: Office for National Statistics
Download this image Figure 3: Workforce Jobs by broad industry group and by region, December 2014, seasonally adjusted
.png (28.5 kB)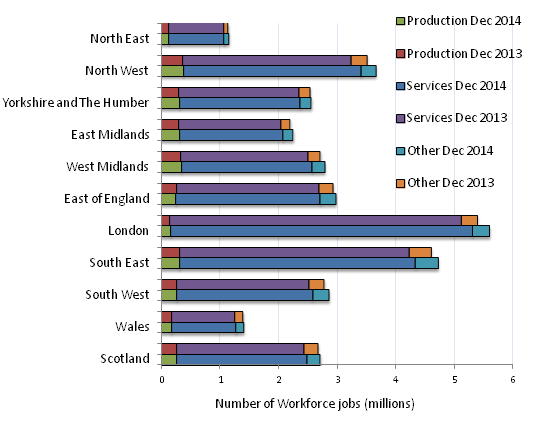
7. Jobseeker's Allowance
The seasonally adjusted headline Claimant Count rate for the UK was 2.3% in March 2015, down 0.1 percentage point from February 2015, with the level down 20,700.
The region with the highest rate in Great Britain was the North East, at 4.0%, remaining unchanged from the previous month. The next highest rates were in Yorkshire and The Humber, and Wales, both at 3.2% and the West Midlands, at 3.0%.
The regions with the lowest rate were the South East and the South West, both at 1.3%, the East of England, at 1.6% and London, at 2.1%.
Figure 4: Claimant Count rates by region, March 2015, seasonally adjusted
Source: Department for Work and Pensions
Download this chart Figure 4: Claimant Count rates by region, March 2015, seasonally adjusted
Image .csv .xls8. Local authority labour market indicators
Indicators from the Annual Population Survey
For the period January 2014 to December 2014, the local authorities with the highest employment rate in Great Britain, were the Orkney Islands, at 89.3%, East Northamptonshire, at 86.4%, and Oadby and Wigston, at 85.9%. Liverpool is now the only local authority with an employment rate lower than 60%; at 59.2%.
For the period January 2014 to December 2014, the local authority with the highest unemployment rate in Great Britain, was Middlesbrough, at 12.5%, followed by Liverpool, at 12.0% and Kingston upon Hull, at 11.7%. The local authorities with the lowest unemployment rate were South Northamptonshire and Stratford-on-Avon, both at 2.4%, followed by the Orkney Islands, at 2.7%. These were followed by 3 local authorities, all at 2.8% and a further 10 local authorities, all at 2.9%.
Indicators using Jobseeker’s Allowance data
In March 2015, the local authorities with the lowest proportion of the population aged from 16 to 64 years claiming Jobseeker’s Allowance in Great Britain, were Harrogate and the Isles of Scilly, both at 0.4%, followed by 9 local authorities, all at 0.5%. There were a further 82 local authorities, with a proportion of less than 1.0%. The proportion was highest in Kingston upon Hull, at 4.8%, followed by Wolverhampton and Birmingham, both at 4.5% and Blaenau Gwent and Middlesbrough, both at 4.4%. There were a further 3 local authorities in Great Britain, all with a proportion of 4.0% or more.
Figure 5: Claimant Count Map
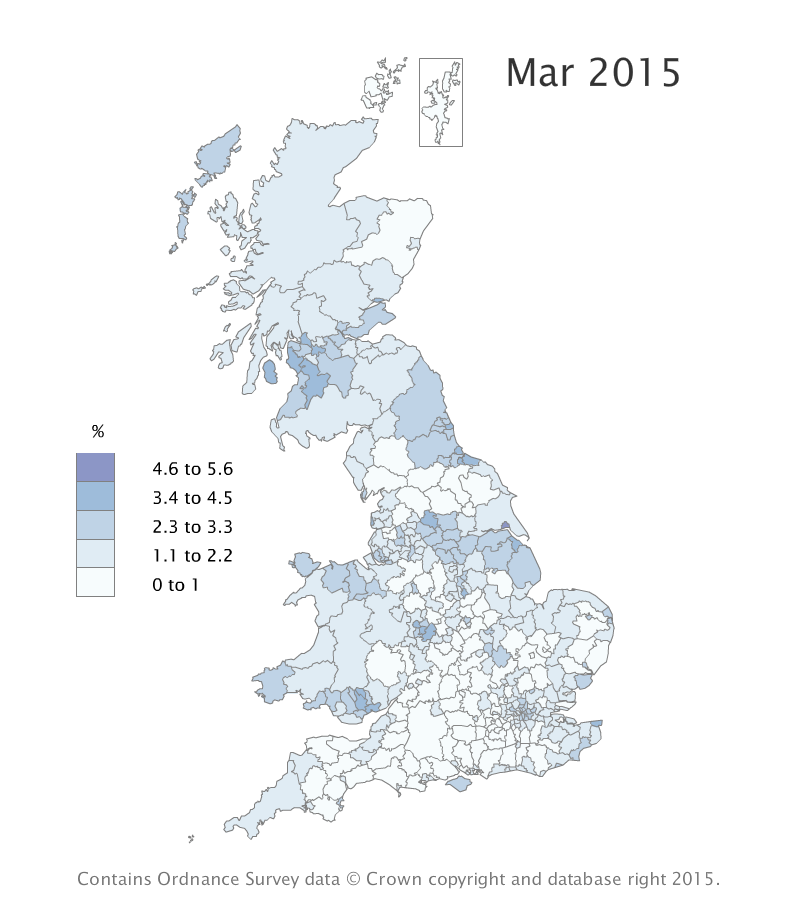
Source: Department for Work and Pensions
Download this image Figure 5: Claimant Count Map
.png (111.4 kB)
An interactive version of this map showing Claimant Count proportions by local authority over time is available on our website. This map also shows Claimant Count proportions for males, females, 18 to 24 year olds and those claiming for over 12 months.
Job densities
The job density of an area is the number of jobs per head, of resident population, aged 16 to 64. In 2013, the highest jobs density in Great Britain was the City of London, at 81.79 and the lowest was East Renfrewshire, at 0.40. Westminster (4.35), Camden (2.15) and Islington (1.36), all in London, were the next highest jobs densities. The highest jobs density outside London was Watford, at 1.32. After East Renfrewshire, the lowest jobs densities were Lewisham, at 0.41, followed by Barking and Dagenham, at 0.44 and East Dunbartonshire, Waltham Forest, Redbridge and Haringey, all at 0.45.
Back to table of contents9. Index of tables
LFS headline indicators (Employment, unemployment and inactivity):
Headline Indicators for All Regions (HI00) (7.45 Mb Excel sheet)
LFS headline indicators (Employment, unemployment and inactivity); Employment and Workforce Jobs estimates; Claimant Count; and Economic Activity and Inactivity estimates for each region are available in the following tables:
Headline Indicators for North East (HI01) (2.27 Mb Excel sheet)
Headline Indicators for North West (HI02) (2.04 Mb Excel sheet)
Headline Indicators for Yorkshire and The Humber (HI03) (2.46 Mb Excel sheet)
Headline Indicators for East Midlands (HI04) (2.61 Mb Excel sheet)
Headline Indicators for West Midlands (HI05) (2.43 Mb Excel sheet)
Headline Indicators for East of England (HI06) (2.4 Mb Excel sheet)
Headline Indicators for London (HI07) (2.05 Mb Excel sheet)
Headline Indicators for South East (HI08) (2.02 Mb Excel sheet)
Headline Indicators for South West (HI09) (2.02 Mb Excel sheet)
Headline Indicators for Wales (HI10) (2.26 Mb Excel sheet)
Headline Indicators for Scotland (HI11) (2.44 Mb Excel sheet)
The following tables contain local labour market indicators for all regions:
Local Indicators for Unitary and Local Authorities (LI01) (246.5 Kb Excel sheet)
Local Indicators for Parliamentary Constituencies (LI02) (311.5 Kb Excel sheet)
Local Indicators for Constituencies of the Scottish Parliament (LI02.1) (115.5 Kb Excel sheet)
Local Indicators for Travel-to-Work Areas (LI03) (176.5 Kb Excel sheet)
Local Indicators for NUTS3 areas (LI04) (175 Kb Excel sheet)
Local Indicators for Local Enterprise Partnerships (LI05) (101.5 Kb Excel sheet)
The following tables contain local Claimant Count data for all regions:
Claimant Count by Unitary and Local Authority (JSA01) (257.5 Kb Excel sheet)
Claimant Count by Parliamentary Constituency (JSA02) (622.5 Kb Excel sheet)
Claimant Count by Constituencies of the Scottish Parliament (JSA02.1) (123.5 Kb Excel sheet)
Claimant Count by Local Enterprise Partnership (JSA03) (102.5 Kb Excel sheet)
Other tables:
Summary of Headline Indicators (S01) (85.5 Kb Excel sheet)
Sampling Variability and Revisions Summary (S02) (61.5 Kb Excel sheet)
Claimant Count Denominators (S03) (69 Kb Excel sheet)
Model Based Estimates of Unemployment (M01) (2.81 Mb Excel sheet)
Estimates of Employment by Age (Experimental Statistics) (X01) (6.86 Mb Excel sheet)
Estimates of Unemployment by Age (Experimental Statistics) (X02) (6.82 Mb Excel sheet)
Estimates of Inactivity by Age (Experimental Statistics) (X03) (6.84 Mb Excel sheet)
Regional public and private sector employment (RPUB1) (215 Kb Excel sheet)
Back to table of contents