Table of contents
- Main points
- Overview
- Your views matter
- E-commerce event on the changing shape of business
- Computer and internet use
- Frequency of internet use
- Mobile internet access
- Internet activities
- Internet shopping
- Public authorities and services
- Internet security and internet storage
- Household internet access
- Background notes
- Methodology
1. Main points
The internet was accessed every day, or almost every day, by 78% of adults (39.3 million) in Great Britain in 2015, compared with 35% (16.2 million) in 2006, when directly comparable records began
Almost all adults aged 16 to 24 (96%) accessed the internet “on the go”, compared with only 29% of those aged 65 years and over
Social networking was used by 61% of adults, and of those, 79% did so every day or almost every day
In 2015, 76% of adults bought goods or services online, up from 53% in 2008. “Clothes or sports goods” were purchased by 55% of adults, making them the most popular online purchase
In the last 3 months, 22% of adults purchased online once or twice, while 28% of adults purchased 11 or more times. Online purchases totalling £100 to £499 were made by 42% of adults who had bought online in the last 3 months
In 2015, 86% of households in Great Britain (22.5 million) had internet access, up from 57% in 2006
2. Overview
The internet continues to change the way people go about their lives, especially in areas such as shopping and communication. In 2015, over three quarters of adults in Great Britain used the internet every day, or almost every day (78%) and a similar proportion (74%) accessed the internet “on the go” (away from home or work).
The Internet Access Survey results are derived from the Opinions and Lifestyle Survey (OPN). Estimates for 2015 in this release refer to data collected in the January, February and April 2015 modules of the OPN.
We first collected statistics on internet access in 1998. Since then, various changes have been made to the Internet Access Survey, including the publication of annual results since 2006. Where possible, comparisons over time are made in this release. However, the available coverage for time series comparisons varies, as the questions included in the survey change each year.
In this release, new estimates by disability status have been introduced, to accompany breakdowns by age group and sex. These breakdowns are based on respondents reporting that that they have a health condition or illness in line with the Equality Act definition of disability. These new estimates show that adults with the status of “Equality Act disabled” consistently reported lower rates of internet activities than those who did not have this status.
Back to table of contents3. Your views matter
We are constantly aiming to improve this release and its associated commentary. We would welcome any feedback you might have and would be particularly interested in knowing how you make use of the data to inform your work. Please contact us via email: esociety@ons.gov.uk or telephone Cecil Prescott on +44 (0)1633 456767.
Back to table of contents4. E-commerce event on the changing shape of business
Since 2012, a series of annual events has been held on the theme of the changing shape of business. These have been jointly co-ordinated with the Department of Business, Innovation and Skills (BIS). The last event, The changing shape of UK manufacturing, was held on 22 October 2014.
On 8 October 2015, we will be holding the next event in the series, called “How e-commerce is changing the shape of business”. This will be held at the BIS Conference Centre, London. The event will feature a range of talks from users, producers and suppliers of e-commerce business statistics, from government, international organisations and business. For more information about the event, or to register your attendance, please email BusinessStatisticsUserConference@bis.gov.uk.
Back to table of contents5. Computer and internet use
Computer and internet use have increased over time, as shown in Figures 1 and 2. Use of a computer is linked to the ability of an individual to use the internet. In 2015, 72% of adults in Great Britain used a computer every day, up from 45% in 2006, while only 10% of adults had never used a computer in 2015. Of those adults aged 16 to 24, only 1% had never used a computer, while 32% of adults aged 65 and over had never done so.
Figure 1: Daily computer use by age group, 2006 and 2015, Great Britain
Source: Office for National Statistics
Download this chart Figure 1: Daily computer use by age group, 2006 and 2015, Great Britain
Image .csv .xls6. Frequency of internet use
In 2015, 78% of adults (39.3 million) in Great Britain used the internet every day or almost every day. This was more than double the proportion of adults (35%) that used the internet daily in 2006, when directly comparable records began. Daily internet use increased by 2 percentage points since 2014 (as shown in Figure 2).
Figure 2: Daily internet use by adults, 2006 to 2015, Great Britain
Source: Office for National Statistics
Download this chart Figure 2: Daily internet use by adults, 2006 to 2015, Great Britain
Image .csv .xls7. Mobile internet access
The availability of wireless (wifi) hotspots has been rapidly increasing and thousands of hotspots are available across the country at various places, such as pubs, cafes, hotels and others.
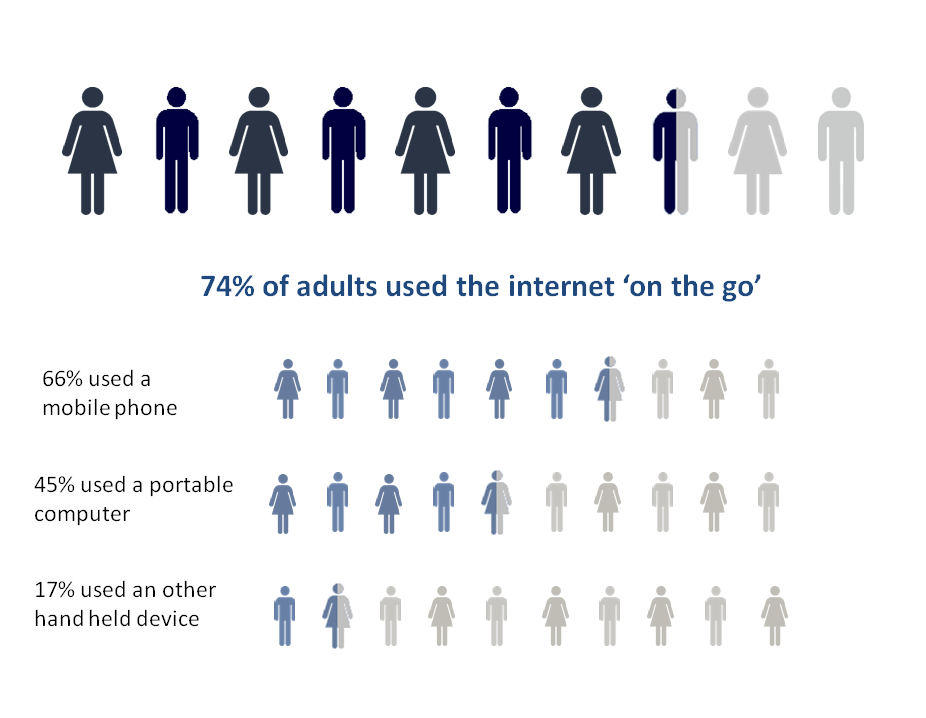
In 2015, 74% of adults had used the internet “on the go” using a mobile phone, portable computer or handheld device (as shown in figure 3). Almost all adults aged 16 to 24 (96%) accessed the internet “on the go”, compared with only 29% of those aged 65 years and over.
The most common type of device used to access the internet "on the go" was a mobile phone or smartphone (66%), followed by portable computer, such as, a laptop or tablet (45%). Other handheld devices were used to access the internet "on the go" by 17% of adults.
Figure 3: Mobile internet use, 2015, Great Britain
Source: Office for National Statistics
Download this image Figure 3: Mobile internet use, 2015, Great Britain
.png (60.2 kB) .xls (19.5 kB)
8. Internet activities
Of the internet activities surveyed in 2015, email remained the most common, with 76% of adults having used the internet for this purpose. This was an increase of just 1 percentage point since 2014, but 19 percentage points since the 2007 estimate of 57%. The second most common internet activity in 2015 was finding information about goods and services, undertaken by 69% of adults. This estimate is up from 58% in 2007, but down slightly compared with 73% in 2014.
All internet activities that were surveyed in 2007 and again in 2015 have seen an increase in use. "Reading online news, newspapers or magazines" showed the largest increase; 62% of adults used the internet to read online news, newspapers or magazines in 2015, more than 3 times the proportion doing so in 2007 (20%).
Figure 4: Internet activities by year, 2007 and 2015, Great Britain
Within the last 3 months
Source: Office for National Statistics
Download this chart Figure 4: Internet activities by year, 2007 and 2015, Great Britain
Image .csv .xlsIn 2015, adults aged 25 to 34 had the highest (or joint highest) use across 7 of the 17 categories surveyed. Those aged 16 to 24 reported the highest (or joint highest) use in 6 of the 17 categories.
Adults aged 16 to 24 were most likely to engage in online activities that focused on leisure or recreation, such as social networking (92%) or education and training (59%). Adults aged 25 to 34 reported the highest level of use in some “day-to-day” activities such as use of email (88%, the same as the 35 to 44 age group) and reading online news, newspapers or magazines (77%). Since 2007, the use of internet banking has nearly doubled, from 30% of adults, to 56% in 2015. More than three quarters (76%) of those aged 25 to 34 carried out internet banking in 2015.
Figure 5: Internet activities by age group, 2015, Great Britain
Source: Office for National Statistics
Download this chart Figure 5: Internet activities by age group, 2015, Great Britain
Image .csv .xlsUse of the internet for social networking continued to grow, rising to 61% in 2015. This was an increase from 45% in 2011 and 54% in 2014. Social networking is widespread in all age groups, up to and including those aged 55 to 64, where 44% of adults reported use. Of those aged 65 and over, 15% used social networks. Social networking has become part of many adults’ everyday lives. Of the 61% of adults who used social networks in the last 3 months, 79% did so every day or almost every day.
For the majority of the internet activities surveyed, there was little difference in the proportion of men and women carrying out the activities. Exceptions to this were downloading software, which was carried out by 38% of men, compared with 19% of women, and professional networking, which was also carried out by a higher proportion of men (21%) than women (10%).
Back to table of contents9. Internet shopping
The number of high street shops has been in decline, as highlighted by the BBC. In recent years there has been strong growth in internet shopping. In 2015, more than three quarters (76%) of adults reported buying goods or services over the internet in the last 12 months, up from 53% in 2008. Younger adults have embraced internet shopping, with 65% of those aged 16 to 24 purchasing over the internet in 2008, rising to 90% in 2015. This was twice the proportion of adults aged 65 and over (42%) who bought online in 2015. However, there was large growth in the rate of online purchasing by those aged 65 and over, rising from 16% in 2008.
“Clothes or sports goods” were the most popular online purchase in 2015, bought by 55% of adults. Those aged 16 to 24 most likely to buy these items (74%). “Household goods (for example, furniture, toys etc)" were the next most popular items, purchased online by 44% of adults. “Travel arrangements” and “holiday accommodation” were both purchased online by 37% of adults.
In 11 of the 15 categories surveyed, adults aged 35 to 44 reported the highest (or joint highest) rates of internet shopping.
There are differences between age groups in goods and services bought online. Figure 6 focuses on the 10 categories with the largest differences between the youngest and oldest age groups. The largest difference was for “clothes or sports goods”, with 74% of adults aged 16 to 24 purchasing these, compared with 19% of those aged 65 and over.
Figure 6: Purchases made over the internet by age group, 2015, Great Britain

Source: Office for National Statistics
Download this image Figure 6: Purchases made over the internet by age group, 2015, Great Britain
.png (38.1 kB) .xls (21.0 kB)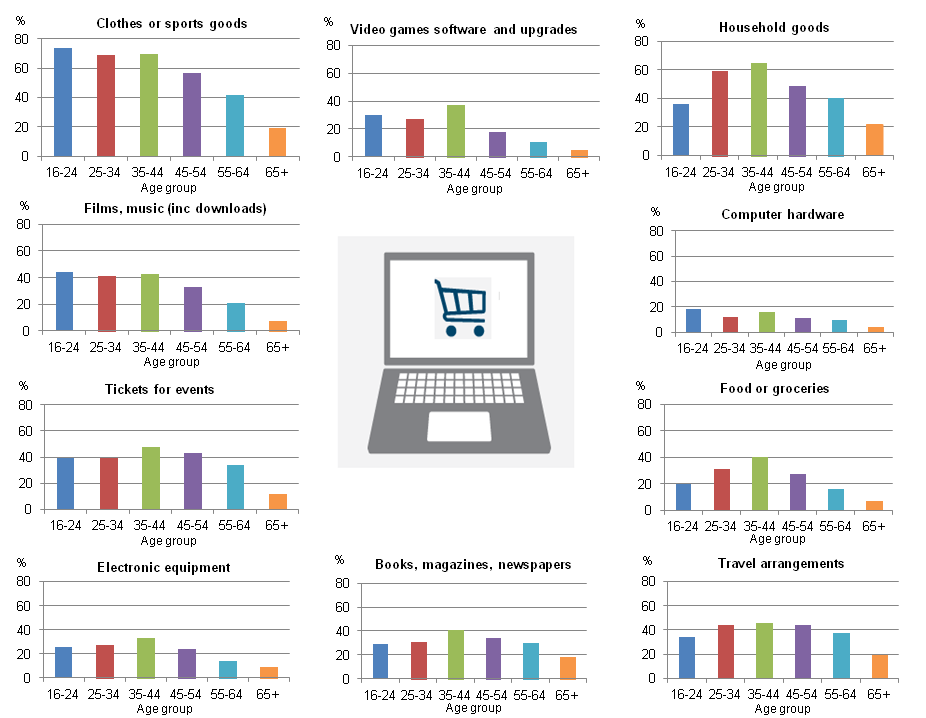
In 2015, new estimates were collected on the total value of respondents’ internet purchases. Of those adults who had purchased online in the last 3 months, 42% made purchases totalling £100 to £499, 12% made purchases of less than £50, and 9% made purchases of £2,000 or more.
Purchases valued from £100 to £499 were the most common across all age groups. Unlike many of the comparisons in this release, there was relatively little difference between the age groups in the values of their internet expenditure. Of those aged 16 to 24, 49% spent on purchases in this range, compared with 42% of those aged 65 and over.
Figure 7: Value of adults' internet purchases, by expenditure range, 2015, Great Britain
Within the last 3 months
Source: Office for National Statistics
Download this chart Figure 7: Value of adults' internet purchases, by expenditure range, 2015, Great Britain
Image .csv .xlsOf those adults who had bought over the internet in the last 3 months, 28% had done so 11 or more times, while 22% had done so only once or twice. Adults aged 35 to 44 purchased most often, with 42% buying online 11 times or more in the last 3 months.
Figure 8: Frequency of internet purchasing, by age group, 2015, Great Britain
Within the last 3 months
Source: Office for National Statistics
Download this chart Figure 8: Frequency of internet purchasing, by age group, 2015, Great Britain
Image .csv .xlsIn 2015, adults who had bought or ordered goods or services online were asked about problems they may have encountered. The most common problems encountered were “technical failure of website during ordering or payment” and “speed of delivery slower than indicated”, both at 27%. However, 50% reported that they had not encountered any problems with internet purchasing.
Adults who had not bought over the internet in the last 12 months were asked why this was. The most common reason, given by 58%, was that they “preferred to shop in person”. “Payment security or privacy concerns” were cited by 27% of these adults and “lack of skills or knowledge” by 19%.
Back to table of contents11. Internet security and internet storage
A range of security problems are experienced when adults use the internet. In 2015, 17% of adults who used the internet in the last 12 months had caught a virus or other infection on their computer (for example, a “worm” or “trojan”), which resulted in a loss of information or time. However, the other categories of security problems that were surveyed were experienced by very few internet users. Just 3% reported that they had experienced abuse of personal information, and/or other privacy violations and 3% experienced financial loss due to fraudulent messages or fake websites.
Adults also reported awareness of internet security issues. Of those who had used the internet in the last 12 months, 65% were aware that cookies can be used to trace online activity and 52% had made back up files to an external storage device or to internet storage space.
Respondents were asked about their security concerns. Of those who had used the internet in the last 12 months, 17% reported that security concerns had limited them “providing personal information to online communities for social and professional networking”. Security concerns also resulted in 14% of adults limiting their internet banking activities and 12% limited their internet purchasing.
The availability of internet storage space has grown in recent years with services such as iCloud, Dropbox and Google Drive available for free. In 2014, 67% of adults were aware of services to store information and data on the internet and in 2015, 40% of adults had used such services.
The youngest age group, adults aged 16 to 24, had the highest proportion using internet storage space, at 55%. In both the 25 to 34 and 35 to 44 age groups, 47% of adults used internet storage space.
Back to table of contents12. Household internet access
In 2015, 86% of households in Great Britain (22.5 million) had an internet connection. This was up from 84% in 2014 and 57% in 2006. Household internet access has increased since we first began collecting these statistics in 1998. There were changes in the survey source, periodicity and coverage over the period 1998 to 2005. This means that the estimates prior to 2006 are not directly comparable with the annual estimates from 2006 onwards, but they have been provided as our best available indication of growth over this period.
Internet access varies depending on household composition. Nearly all (97%) of households with children have an internet connection. Access to the internet by single adult households varies considerably depending on age. For households with one adult aged 65 or over, only 49% had internet access. In contrast 80% of households with only one adult aged 16 to 64 years, had internet access. The vast majority of households with internet access had fixed broadband, such as DSL, cable or optical fibre (94%).
In 2015, of the 14% of households in Great Britain with no internet access, 31% reported that this was due to a lack of skills. Further barriers reported included equipment costs being too high (14%) and access costs being too high (12%), while 53% of households without internet access reported that this was because they didn’t need it.
Back to table of contents