1. Main points
In quarter 1 (Jan to Mar) 2015, 86% of adults (44.7 million) in the UK had used the internet in the last 3 months (recent users), an increase of 1 percentage point since the quarter 1 (Jan to Mar) 2014 estimate of 85%
11% of adults (5.9 million) had never used the internet, falling by 1 percentage point since quarter 1 (Jan to Mar) 2014
The South East had the highest proportion of recent internet users (90%) and Northern Ireland was the area with the lowest proportion (80%)
In quarter 1 (Jan to Mar) 2015, the proportion of adults who were recent internet users was lower for those that were disabled (68%), compared with those that were not disabled (92%)
In quarter 1 (Jan to Mar) 2015 the proportion of adults aged 16 to 24 years who were recent internet users was lower for those that were disabled (95% recent users) compared with those that were not disabled (99% recent users). The proportion of adults aged 75 years and over who were recent internet users was also lower for those that were disabled (27% recent users) compared with those that were not disabled (40% recent users)
2. Overview
This is the first annual publication of quarterly estimates of internet use by adults aged 16 years and over in the UK. This release has replaced the Internet Access Quarterly Update that was last published on 14 May 2014. This was discontinued following our consultation on statistical products that took place in 2013. Our response to the consultation on statistical products explained that in future, the estimates of internet users would be published on an annual basis.
Following the outcome of our consultation on statistical products, we conducted a further consultation on the future of statistics to measure the digital economy. This included questions on the format of this new annual internet users release. The majority of respondents indicated that their preference was to include all quarterly periods rather than just 1 quarter from each year. Therefore, this annual release contains all quarterly periods from quarter 1 (Jan to Mar) 2014 to quarter 1 (Jan to Mar) 2015.
Estimates in this release show how internet use is correlated to various socio-demographic characteristics, such as age, sex, disability and geographical location. As a result of user needs, this release has also introduced a new breakdown of internet users, into adults who have used the internet within the last 3 months (recent users) and adults who last used the internet more than 3 months ago (lapsed users). These replace the simpler definition of internet users as “adults who have ever used the internet” that was used in the discontinued internet access quarterly update.
The estimates in this release are derived from the Labour Force Survey (LFS) and are not seasonally adjusted. The detailed regional estimates contained in Tables 5A and 5B are included to meet user interest. These estimates are based on smaller sample sizes than the higher level regional estimates in Tables 4A and 4B and are therefore subject to a greater degree of sampling variability, so should be treated with caution. In addition, in Tables 5A and 5B the categories of "last used the internet more than 3 months ago" and "never used" have been combined due to the small sample sizes at this level of geography.
On 7 August 2014, we published the annual Internet Access - Households and Individuals 2014 statistical bulletin. This provides more information on the range of activities carried out on the internet. However, while the estimates in the Households and Individuals annual bulletin are more detailed, they are derived from the Opinions and Lifestyle Survey, which has a much smaller sample size than the LFS. Therefore, any comparisons made between estimates in this release and the existing annual Internet Access Households and Individuals publication should be undertaken with caution.
Back to table of contents3. Your views matter
We are constantly aiming to improve this release and its associated commentary. We would welcome any feedback you might have; please contact us via email: esociety@ons.gov.uk or telephone Cecil Prescott on +44 (0)1633 456767.
Back to table of contents4. Recent, lapsed and non-users
In quarter 1 (Jan to Mar) 2015, 86% of adults (44.7 million) had used the internet in the last 3 months. While 2% (1.1 million) had last used the internet more than 3 months ago, 11% (5.9 million) had never used it.
The percentage of adults that were recent internet users has increased from 80% in quarter 2 (Apr to June) 2011, when comparable records began, to 86% in quarter 1 (Jan to Mar) 2015.
The percentage of adults who have never used the internet has decreased from 17% in quarter 1 (Jan to Mar) 2011 to 11% in quarter 1 (Jan to Mar) 2015.
Figure 1: Internet non-users
UK, quarter 1 2011 to quarter 1 2015
Source: Office for National Statistics
Notes:
- Q1 refers to quarter 1 (Jan to Mar), Q2 refers to quarter 2 (Apr to June), Q3 refers to quarter 3 (July to Sept) and Q4 refers to quarter 4 (Oct to Dec).
Download this chart Figure 1: Internet non-users
Image .csv .xls5. Age
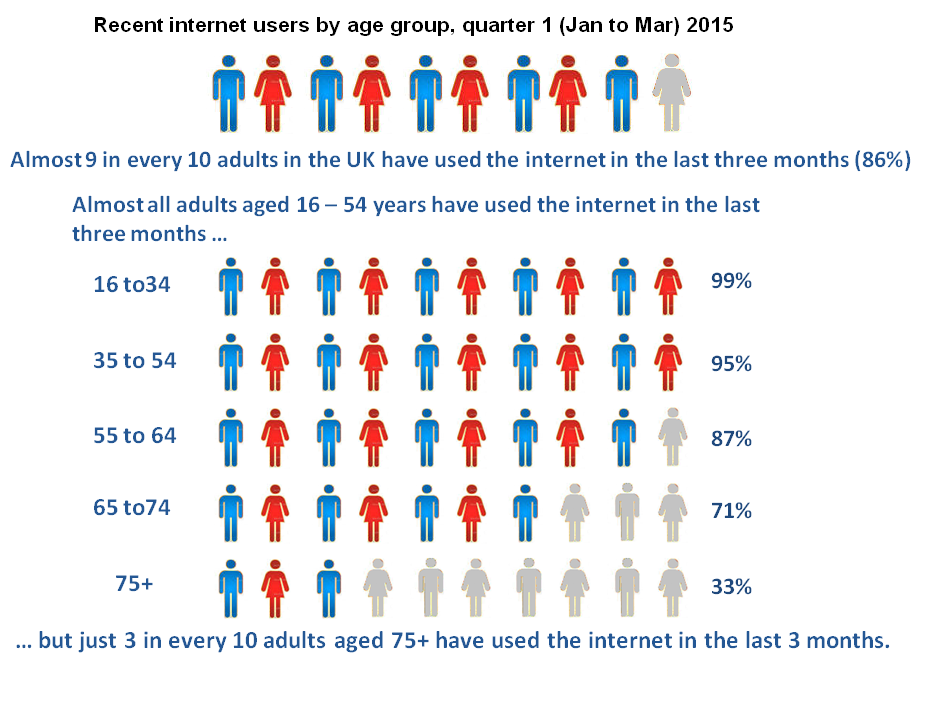
Age is a factor as to whether an adult has used the internet. Since the survey began in 2011, adults aged 16 to 24 years have consistently shown the highest rates of internet use, with each successively older age group reporting a lower rate of use.
In quarter 1 (Jan to Mar) 2015, almost all adults aged 16 to 24 years were recent internet users (99%), in contrast with 33% of adults aged 75 years and over. Although recent internet use is notably lower in the older age groups, the proportion of adults aged 75 years and over who had never used the internet, decreased from 76% in quarter 2 (Apr to June) 2011 to 61% in quarter 1 (Jan to Mar) 2015.
Adults aged 75 years and over also had the highest rate of lapsed internet users in quarter 1 (Jan to Mar) 2015 at 6%, compared with 0.3% of adults aged 16 to 24 years. This suggests that, although more adults aged 75 years and over are becoming internet users, they are not necessarily continuing to use the internet.
Of the 5.9 million adults who had never used the internet in quarter 1 (Jan to Mar) 2015, just over half (3.0 million) were aged 75 years and over.
Recent internet users by age group, quarter 1 (Jan to Mar) 2015
Download this image Recent internet users by age group, quarter 1 (Jan to Mar) 2015
.png (140.5 kB)
6. Sex
In quarter 1 (Jan to Mar) 2015, 88% of men (22.2 million) and 85% of women (22.4 million) were recent internet users. Since quarter 2 (Apr to June) 2011, the proportion of men and women who were recent internet users has increased by 6 and 8 percentage points respectively.
Figure 2a: Internet users by sex, Women
UK, 2011 quarter 2 to 2015 quarter 1
Source: Office for National Statistics
Notes:
- Persons aged 16 years and over
- Q1 refers to quarter 1 (Jan to Mar), Q2 refers to quarter 2 (Apr to June), Q3 refers to quarter 3 (July to Sept) and Q4 refers to quarter 4 (Oct to Dec).
Download this chart Figure 2a: Internet users by sex, Women
Image .csv .xls
Figure 2b: Internet users by sex, Men
UK, 2011 quarter 2 to 2015 quarter 1
Source: Office for National Statisitcs
Notes:
- Persons aged 16 years and over.
- Q1 refers to quarter 1 (Jan to Mar), Q2 refers to quarter 2 (Apr to June), Q3 refers to quarter 3 (July to Sept) and Q4 refers to quarter 4 (Oct to Dec).
Download this chart Figure 2b: Internet users by sex, Men
Image .csv .xlsMen in the oldest 2 age groups are more likely to use the internet than women in the same age groups. In quarter 1 (Jan to Mar) 2015, 41% of men aged 75 years and over were recent internet users compared with 27% of women.
There is little difference in the rates of internet use between men and women in all age groups under 65 years of age.
Recent internet users by sex and age group, quarter 1 (Jan to Mar) 2015

Download this image Recent internet users by sex and age group, quarter 1 (Jan to Mar) 2015
.png (146.2 kB)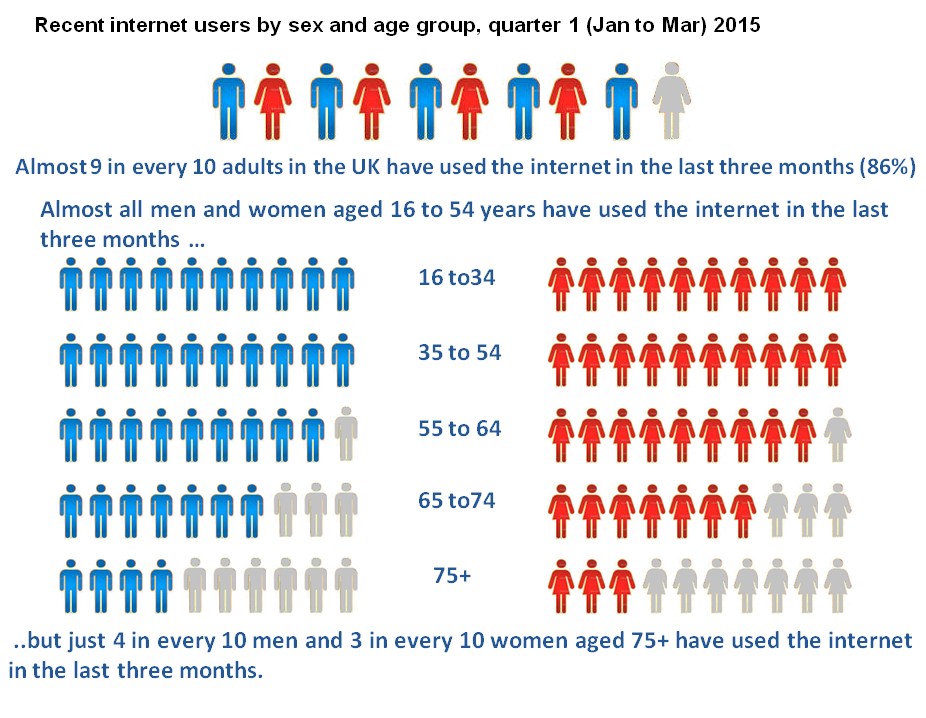
7. Disability
Estimates of adults with a disability are presented from quarter 1 (Jan to Mar) 2014 as defined by the Equality Act. The term "disabled" is used to refer to those who self-assess that they have a disability in line with the Equality Act.
In quarter 1 (Jan to Mar) 2015, 27% of disabled adults (3.3 million) had never used the internet. There were 0.5 million disabled adults, who had last used the internet over 3 months ago, making up 48% of the 1.1 million lapsed internet users.
In quarter 1 (Jan to Mar) 2015 the proportion of adults aged 16 to 24 years who were recent internet users was lower for those that were disabled (95% recent users) compared with those that were not disabled (99% recent users). The proportion of adults aged 75 years and over who were recent internet users was also lower for those that were disabled (27% recent users) compared with those that were not disabled (40% recent users). Across all age groups, the proportion of adults who were recent internet users was lower for those that were disabled, compared with those that were not disabled.
Figure 3: Internet non-users by disability status
UK, 2013 quarter 2 to 2015 quarter 1
Source: Office for National Statisitcs
Notes:
- Persons aged 16 and over.
- Equality Act disabled refers to those who self-assess that they have a disability in line with the Equality Act definition of disability.
- Q1 refers to quarter 1 (Jan to Mar), Q2 refers to quarter 2 (Apr to June), Q3 refers to quarter 3 (July to Sept) and Q4 refers to quarter 4 (Oct to Dec).
Download this chart Figure 3: Internet non-users by disability status
Image .csv .xls8. Ethnic Group
In quarter 1 (Jan to Mar) 2015, the ethnic group with the highest percentage of recent internet users was the mixed or multiple ethnic background (97%). However, it should be noted that there is a higher degree of sampling variability around some categories of ethnic group and internet use, due to the small sample sizes used to compile the estimates. Therefore these estimates should be treated with caution.
Back to table of contents9. Regional Distribution
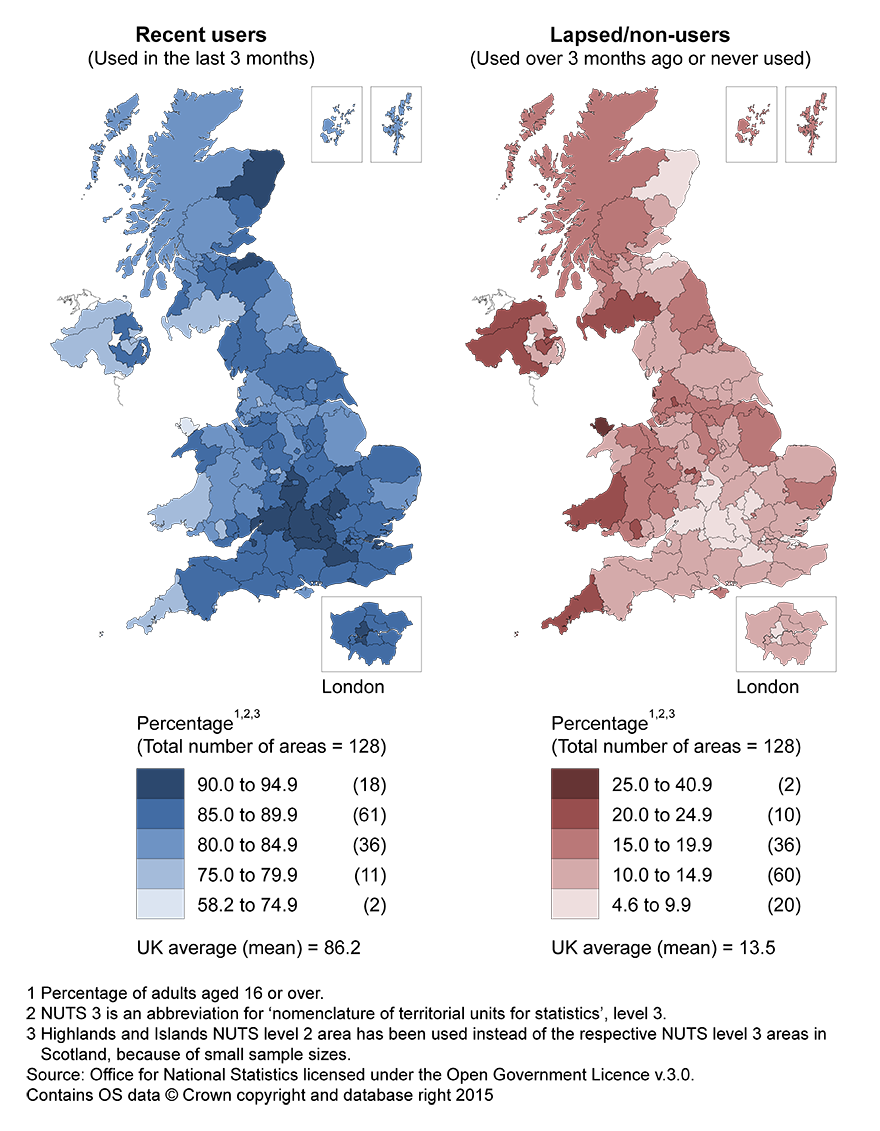
The South East had the highest proportion of recent internet users (90%) and Northern Ireland was the area with the lowest proportion (80%).
Internet use, Q1 2015, by NUTS3 area, United Kingdom
Download this image Internet use, Q1 2015, by NUTS3 area, United Kingdom
.png (442.0 kB)
The NUTS Classification is a hierarchical system dividing up economic territory of the EU for the purpose of regional statistics. There are 3 NUTS levels, all of which are used in this release.
While Tables 4A and 4B (471 Kb Excel sheet) are presented at NUTS 2 level, Tables 5A and 5B are presented at the more detailed NUTS 3 level due to user needs. The estimates in Tables 5A and 5B (471 Kb Excel sheet) are based on smaller sample sizes than the higher level regional estimates in Tables 4A and 4B and are therefore subject to a greater degree of sampling variability, so should be treated with caution (see Background note 6). The categories of “used over 3 months ago” and “never used” have been combined in Tables 5A and 5B due to the small sample size at this level of geography.
The maps show the proportion of internet use by NUTS 3, the most detailed geographical classification available. While there is sampling variability around these estimates, in quarter 1 (Jan to Mar) 2015 the area with the highest proportion of adults who had last used the internet more than 3 months ago, or who had never used it, was the Isle of Anglesey (41%).
Back to table of contents