Table of contents
- Main findings
- Overview
- User engagement
- UK gross R&D expenditure, 2011
- Expenditure by performers of R&D in the UK
- Civil and defence expenditure, by sector carrying out the work
- R&D expenditure by funding sector
- Regional breakdown of UK R&D expenditure
- International comparisons
- Background notes
- Methodology
1. Main findings
In 2011, the UK’s gross domestic expenditure on research and development (GERD), in current price terms, increased by 5% to £27.4 billion compared with 2010. Adjusted for inflation, in constant price terms, R&D expenditure increased by 2% compared with 2010.
The largest increase in UK R&D expenditure, in current price terms, was in the business sector. Business R&D increased by 8% in current price terms to £17.4 billion compared with 2010 and by 6% when adjusted for inflation.
Higher education R&D expenditure, in current price terms increased by 2% to £7.1 billion compared with 2010 and by 0.2% when adjusted for inflation.
Total R&D expenditure in the UK in 2011 represented 1.79% of Gross Domestic Product (GDP), which is a slight increase from 1.77% in 2010.
International comparisons show that UK R&D expenditure in 2011 was below the EU-27 average of 2.03% of GDP.
2. Overview
This Statistical Bulletin supercedes the version available between 13 March 2013 and 27 March 2013. There have been minor corrections made to both civil and defence expenditure estimates. All other estimates remain unchanged.
This release provides estimates of R&D performed and funded by the following four sectors of the economy, as defined in the Frascati manual, Business Enterprise (BERD), Higher Education (HERD), Government (GovERD) which includes Research Councils, and Private Non-Profit (PNP) organisations. All these sectors’ R&D data are known collectively as GERD, which represents the gross domestic expenditure on R&D in the UK.
GERD uniquely provides information on total R&D expenditure in the UK, and is the preferred measure for use in international comparisons. This release reports on R&D expenditure in the UK irrespective of the residence of the ultimate owner or users of the R&D produced.
Two types of estimates are presented as part of this release, current and constant price terms. Estimates in current price terms present the value of R&D expenditure collected from annual surveys for all sectors except higher education. Estimates for higher education are supplied to ONS by the Higher Education Funding Councils (HEFC). Constant price estimates have been adjusted for inflation between years using a GDP deflator. This allows changes in the volume of R&D expenditures to be examined more consistently over time.
According to the Department for Business, Innovation and Skills (BIS), R&D is defined as “any project to resolve scientific or technological uncertainty aimed at achieving an advance in science or technology”.
For the purposes of National Statistics, R&D and related concepts follow internationally agreed standards defined by the Organisation for Economic Cooperation and Development (OECD), as published in the ‘Frascati’ Manual. R&D, in the Frascati Manual, is defined as “creative work undertaken on a systematic basis in order to increase the stock of knowledge, including knowledge of man, culture and society and the use of this stock of knowledge to devise new applications”.
The Frascati Manual was originally written by, and for, the experts in OECD member countries that collect and issue national data on R&D. The definitions provided in this manual are internationally accepted and now serve as a common language for designing and evaluating science and technology policy.
The main purpose of collecting R&D data from all sectors of the economy is to supply data for policy and monitoring purposes on science and technology, of which R&D is an important part.
The National Accounts provide the framework that is used to define and measure the UK’s economic performance, such as the size of the UK economy (GDP). Changes to the European System of Accounts (ESA) mean that expenditure on R&D will contribute, from 2014 onwards, to the formation of assets and therefore the value of the UK’s net worth. To facilitate this, additional questions were included as part of the government, business and non-profit organisations 2011 data collections. Please see the ONS ESA 2010 page for more information.
The Business Enterprise estimates in this release are the main component of GERD and are derived from the Business Enterprise Research and Development (BERD) survey published on 20 November 2012; UK Business Enterprise Research and Development 2011 Statistical Bulletin. Approximately 5,000 UK businesses were sampled for this survey from a continually updated register of R&D performers. A paper, ‘Coverage of the Business Enterprise Research and Development Survey (147 Kb Pdf)’, reports on the completeness of these estimates.
As part of this release, business estimates of R&D for 2009 and 2010 have been revised to take account of late returns and misreporting (see background note 5). Government and higher education estimates have been revised for 2007, 2008, 2009 and 2010 due to misreporting and the late receipt of data.
Back to table of contents3. User engagement
We are constantly aiming to improve this release and its associated commentary. We would welcome any feedback you might have, and would be particularly interested in knowing how you make use of these data to inform your work. Please contact us via email: RandD@ons.gov.uk or telephone David Matthews on +44 (0)1633 456756.
Back to table of contents4. UK gross R&D expenditure, 2011
In 2011, in current prices, £27.4 billion was spent on R&D performed within the UK. This is compared with £17.7 billion in 2000 and £7.8 billion in 1985.
Since 1985, there has been a sizeable increase in R&D expenditure in both current (249%) and constant (60%) price terms. This is despite there being a decrease in R&D expenditure in constant price terms between 2007 and 2010 of 1%.
In constant price terms, the 2011 estimate of £27.4 billion is a 6% increase on the 2006 estimate (£25.8 billion) and a 19% increase on the 2000 estimate (£23.0 billion), of expenditure on R&D performed in the UK.
Figure 1: UK gross domestic expenditure on R&D, 1985 to 2011
Source: Office for National Statistics
Download this chart Figure 1: UK gross domestic expenditure on R&D, 1985 to 2011
Image .csv .xlsFigure 2 below shows UK gross expenditure on R&D as a percentage of GDP, in current price terms. Total R&D expenditure in 2011 represented 1.79% of GDP. This estimate is in line with recent years and is a slight increase on the 1.77% estimate for 2010. Figure 2 highlights that gross UK R&D expenditure, as a percentage of GDP in current price terms, peaked in 1986 at 2.14%.
Figure 2: UK gross expenditure on R&D as a percentage of GDP, 1985 to 2011
Source: Office for National Statistics
Download this chart Figure 2: UK gross expenditure on R&D as a percentage of GDP, 1985 to 2011
Image .csv .xlsThe target set by the UK government in the Science and Innovation Framework 2004 - 2014 was to increase public and private investment in R&D to reach 2.5% of GDP by 2014. The ten-year framework followed on from the earlier (2002) Investing in Innovation strategy and the Excellence and Opportunity white paper published in 2000.
Back to table of contents5. Expenditure by performers of R&D in the UK
As mentioned earlier, UK estimates of R&D cover four sectors of the economy, Business Enterprise (BERD), Higher Education (HERD), Government (GovERD) which includes Research Councils, and Private Non-Profit (PNP) organisations. Figure 3, below, shows the contribution each sector has made to the 2011 total GERD estimate.
Figure 3: Composition of UK GERD by performing sector, 2011
Source: Office for National Statistics
Download this chart Figure 3: Composition of UK GERD by performing sector, 2011
Image .csv .xlsTaking each of these R&D sectors in turn:
Business sector
Business carries out by far the most R&D of any sector in the UK, accounting for £17.4 billion of UK R&D expenditure in 2011. This represented 64% of UK gross expenditure on R&D in 2011. The product groups with the highest R&D expenditure in 2011 were pharmaceuticals (£4.9 billion), computer programming and information service activities (£1.8 billion), motor vehicles and parts (£1.5 billion), aerospace (£1.4 billion) and telecommunications (£1.1 billion) (see Figure 4 below). Further, and more detailed, information on business R&D expenditure can be found in the UK Business Enterprise Research and Development, 2011 statistical bulletin published on 20 November 2012.
Figure 4: Product group contributions to overall R&D in the business sector, 2011
Source: Office for National Statistics
Download this chart Figure 4: Product group contributions to overall R&D in the business sector, 2011
Image .csv .xlsHigher education
The higher education sector which includes universities and higher education institutions represented 26% of gross UK R&D expenditure in 2011 at £7.1 billion. This is an increase of 2%, in current price terms, compared with 2010. The funding for this sector is mainly provided by the HEFC and the UK research councils.
Government and research councils
The UK government owns many research institutes and laboratories that carry out R&D. These are managed by different government departments, most notably the Department for Business, Innovation and Skills (BIS), the Department for Environment, Food and Rural Affairs (DEFRA) and the Department of Health (DoH).
BIS is the ministerial department responsible for economic growth. The department has a broad range of responsibilities including universities and science, innovation and space. In December 2011, BIS published a policy paper entitled Innovation and research strategy for growth, which set out their commitment to improving the UK knowledge base and maintaining the budget for science and research programmes.
In 2011, the Government sector’s in-house R&D expenditure decreased by 7% in constant price terms.
Research Councils UK (RCUK) is the strategic partnership of the UK's seven research councils. Each year the research councils perform research covering the full spectrum of academic disciplines from the medical and biological sciences to astronomy, physics, chemistry and engineering, social sciences, economics, environmental sciences and the arts and humanities.
Research councils’ R&D expenditure decreased by 11% in constant prices, from £1.2 billion in 2010 to £1.0 billion in 2011.
In 2011, the government and research councils sector accounted for 9% of total expenditure for R&D performed in the UK.
Private non-profit organisations
The not-for-profit sector includes registered charities and trusts who specialise in mainly health and medical research. Some of the largest in the world are based in the UK. This sector includes, for example, a number of cancer charities that carry out extensive research into types of cancer prevention from drug development to clinical trials.
The Wellcome Trust, a global charitable foundation dedicated to improving human and animal health has published a Ten year strategic plan for 2010 – 2020. This plan reflects the long-term view they take (and others in this sector) in supporting research and the complex and global nature of the challenges that are faced.
PNP is the smallest R&D sector in the UK. In 2011, £0.5 billion was spent on performing R&D by these businesses, which represented 2% of total gross UK R&D spend.
It is important to note that the estimates for this sector for 2011 have been collected from a survey of these businesses for the first time since 2005.
Back to table of contents6. Civil and defence expenditure, by sector carrying out the work
Gross UK R&D expenditure can be divided between the civil and defence sectors. Expenditure in the civil sector in 2011 (£25.3 billion) accounted for 93% of total UK R&D expenditure.
In current price terms, civil R&D expenditure increased by 5% from £24.2 billion in 2010 to £25.3 billion in 2011, and defence R&D increased by 5% from £1.9 billion in 2010 to £2.0 billion in 2011.
In constant price terms, civil R&D expenditure has increased by 73% since 1989 (£14.7 billion) and is now at its highest recorded level. In contrast, defence R&D expenditure has decreased by 56% over this period.
Figure 5: Expenditure on civil and defence R&D performed in the UK, 1989 to 2011
Source: Office for National Statistics
Download this chart Figure 5: Expenditure on civil and defence R&D performed in the UK, 1989 to 2011
Image .csv .xlsCivil and defence R&D expenditure can be further split between the performing UK sectors. The business sector is by far the largest R&D performer of both civil and defence R&D at £15.6 billion and £1.8 billion respectively.
Of particular note, whereas business R&D expenditure, in constant prices, in the civil sector has increased by 54% since 1989, business expenditure on R&D in the defence sector has decreased by 39%.
Back to table of contents7. R&D expenditure by funding sector
UK R&D expenditure can also be split by funding sector (see Figure 6 below). In 2011, the sector providing most of the funding for R&D performed in the UK was the business sector, funding £12.6 billion, 46% of the total UK R&D spend. This is an increase of 7%, in constant price terms, of funding by the business sector from 2010.
Although the government and research councils spend £2.3 billion performing R&D within their UK public institutes, they actually fund £6.1 billion of UK R&D spend, 22% of total funding. This can be better understood through an appreciation of the role of RCUK. On an annual basis, RCUK offers individuals and businesses abroad access to the UK’s research facilities and infrastructure.
Investment from abroad is the third largest funding stream for UK R&D at £4.9 billion, representing 18% of total UK R&D spend in 2011.
Figure 6: Composition of UK GERD by funding sector, 2011
Source: Office for National Statistics
Download this chart Figure 6: Composition of UK GERD by funding sector, 2011
Image .csv .xlsFigure 7, below, is a representation of the flow of R&D funds to the four different R&D sectors using the data from the Excel download below. The values in the boxes are the amount of funding that particular sector provided to the UK in 2011. The arrows indicate the recipient sector, and the values, the amount they received.
Figure 7: Flows of R&D funds in the UK, 2011

Source: Office for National Statistics
Notes:
- Totals do not sum for all sectors, as sectors can fund themselves. For full information please see reference table 1 from the data section of this publication.
- HEFC - Higher Education Funding Councils.
Download this image Figure 7: Flows of R&D funds in the UK, 2011
.png (46.5 kB) .xls (32.3 kB)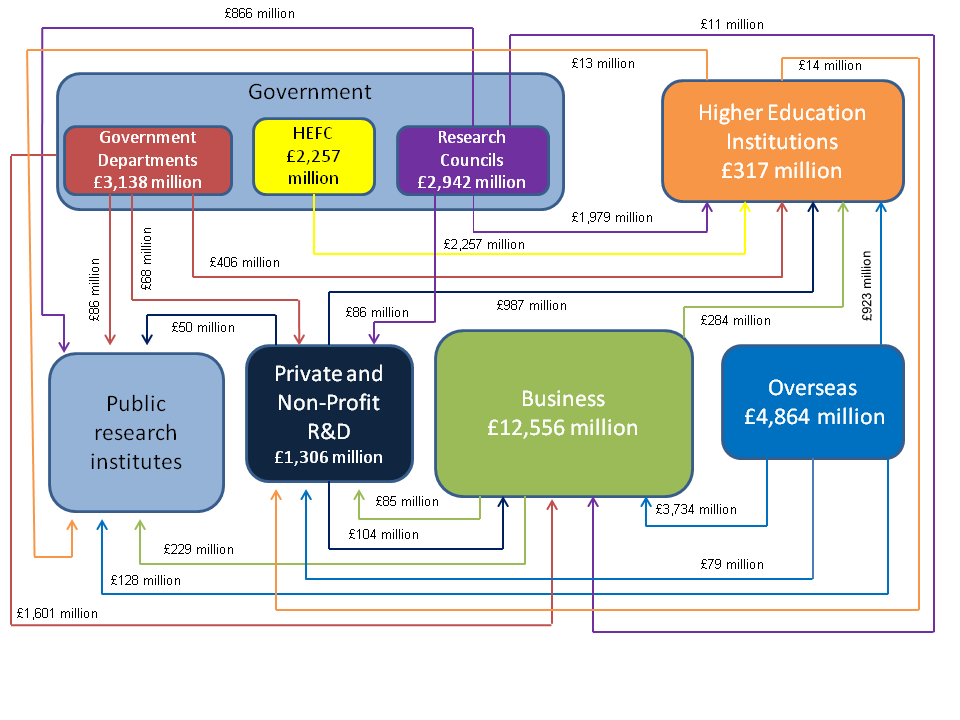
Civil and defence R&D expenditure by funding sector
The majority of funding for civil R&D performed in the UK is provided by the business sector at £12.0 billion, 47% of total civil funding.
Of the £4.9 billion funding from overseas, 96% is for civil sector R&D at £4.7 billion.
As stated earlier, defence R&D expenditure in the UK accounts for 7% of total R&D spend (£2.0 billion). The funding for this comes from the UK government, business sector and abroad. The UK government’s funding of defence R&D in 2011 was £1.3 billion, 64% of the total defence funding. This includes government awarded contracts to UK businesses to develop aircraft, naval ships, submarines and their systems and equipment. The business sector provided £0.5 billion (26%) and abroad, £0.2 billion (9%) of total defence R&D funding in 2011.
Back to table of contents8. Regional breakdown of UK R&D expenditure
It is possible, using R&D expenditure data from all UK sectors, to analyse R&D expenditure by region. In this context, region refers to the location where the R&D is performed, not the location of the funder.
The South East and East of England continue to dominate where R&D is performed in the UK. These two regions accounted for almost 41% of total UK R&D expenditure in 2011 at £11.2 billion.
The majority of UK R&D expenditure was carried out in England, at £24.4 billion in 2011. All of the UK countries, England, Wales, Scotland and Northern Ireland showed an increase in R&D expenditure in current prices in 2011, compared with 2010. With growth of 5%, 8%, 3% and 4% respectively. These increases relate to comparisons of the business, government and higher education sectors only, as the non-profit regional estimates are not available prior to 2011. Regional data is available for 2001 to 2011 in the data for this release section (338 Kb Excel sheet).
Figure 8 shows each sector’s R&D expenditure. It displays the top six regions where their R&D is performed and the value spent in that region. A table of all the regions contribution to each sector is available in the Excel download below the chart.
Figure 8: UK R&D expenditure by sector and the six highest performing regions within each sector, 2011

Source: Office for National Statistics
Notes:
- BERD - Business Enterprise Research and Development. GovERD - Government Expenditure on Research and Development. HERD - Higher Education Research and Development. PNP - Private Non-Profit.
Download this image Figure 8: UK R&D expenditure by sector and the six highest performing regions within each sector, 2011
.png (48.6 kB) .xls (34.3 kB)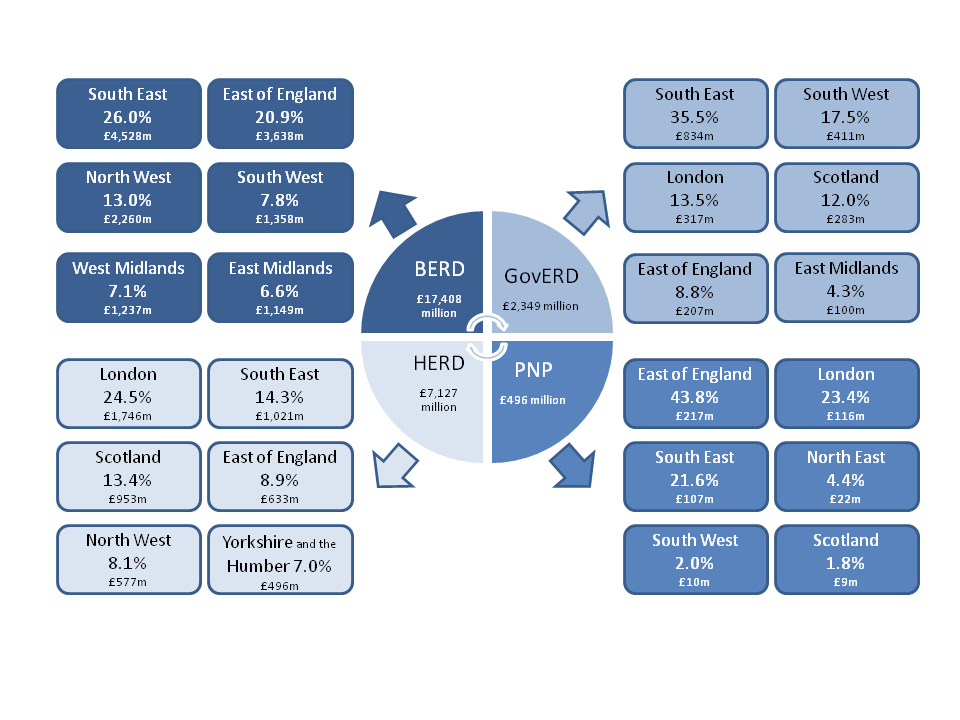
9. International comparisons
Europe 2020 targets for economic growth include 3% of the EU’s GDP (both private and publicly funded) to be invested in R&D/innovation by 2020. This means that these estimates are essential in monitoring progress towards this target.
The ratio of GERD to GDP, one of five key Europe 2020 strategy indicators, increased marginally in the EU-27 up to 2002, reaching a high of 1.88%, before declining modestly through to 2005 (1.83%), and climbing again to 2.01% by 2009. There was a small decline in 2010 when the ratio fell to 2.00%. This decrease, despite the higher absolute level of R&D expenditure, was due to the partial recovery from the financial and economic crisis, as GDP increased at a slightly faster pace than GERD in 2010.
The 2011 data for all EU-27 and OECD countries has not yet been finalised. As such, Figure 9, below, relates to the latest available 2011 data as a means of placing the UK estimates into an international context with regards to GERD to GDP expenditure ratio.
Figure 9: Map of EU countries GERD to GDP ratio, 2011

Source: Eurostat
Download this image Figure 9: Map of EU countries GERD to GDP ratio, 2011
.png (231.7 kB) .xls (32.8 kB)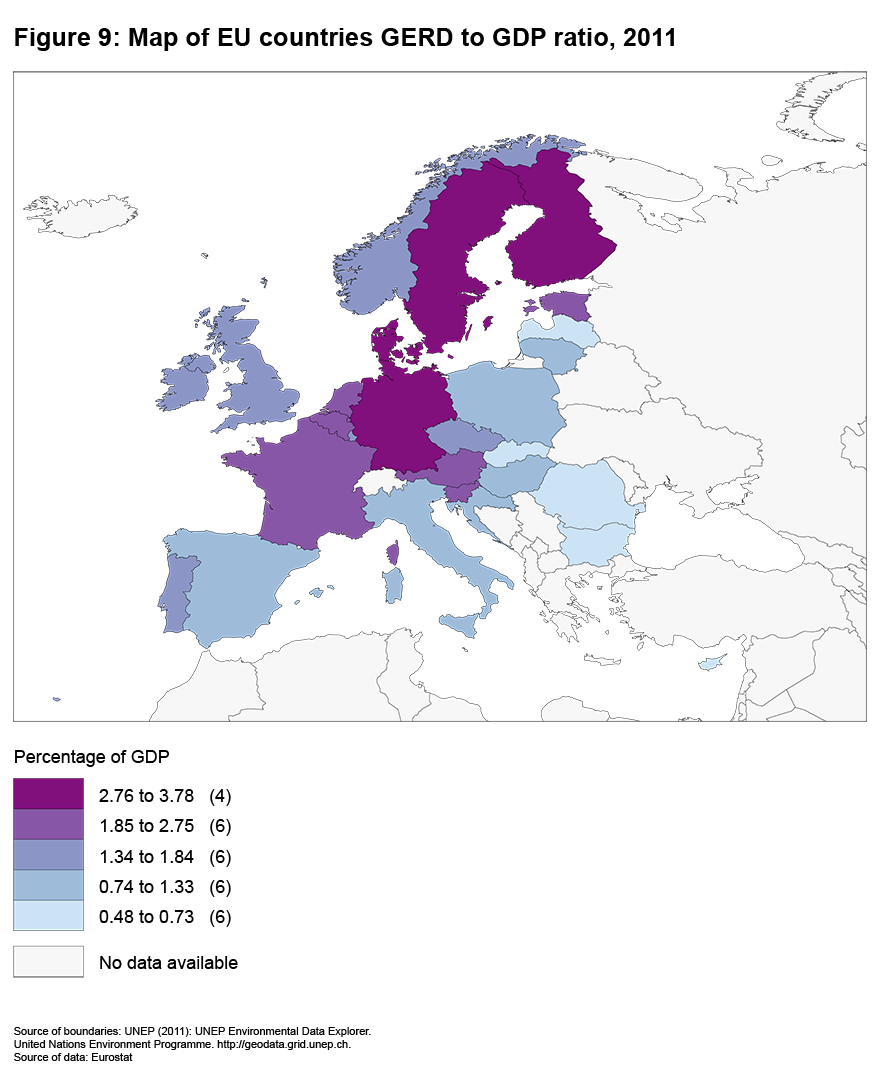
Figure 10 below shows the individual EU-27 countries GERD to GDP ratio, as well as the average for the EU-27 compared with the Europe 2020 target of 3%. These data are early estimates and are indicative only, as not all EU countries are represented. The UK, whose GERD expenditure represents 1.79% of GDP, has the twelfth highest ratio and is below the EU average of 2.03%.
Figure 10: EU countries GERD to GDP ratio as a percentage, 2011
Source: Eurostat
Download this chart Figure 10: EU countries GERD to GDP ratio as a percentage, 2011
Image .csv .xlsThe latest OECD GERD estimates indicate that the modest recovery initiated in 2010 continued into 2011. For 2011, a complete picture is not yet available for the entire OECD area. OECD’s own preliminary estimates indicate a growth rate for GERD of 1.8% between 2010 and 2011. These preliminary estimates also indicate a sustained growth in research in higher education, a slowdown in government R&D and a gradual recovery in R&D performed in the business sector.
When comparing total business R&D intensity across countries, it is important to take into account differences in individual countries industrial structures. The OECD have produced a Science, Technology and Industry Scoreboard to help facilitate these comparisons.
In March 2012, as part of a publication ‘The UK R&D Landscape’, it was reported that “the business enterprise component of R&D expenditure in the UK is low by international standards, even after adjusting for structural difference between countries. It is also concentrated in the hands of a few very large firms and the small number of industrial sectors in which they are based. The official statistics reveal that the largest 10 business R&D spenders accounted for 34% of all UK R&D in 2009 and the largest 50 spenders accounted for 56%” (Hughes and Mina 2012, pp.i).
Back to table of contents