Table of contents
- Key points
- Overview
- User engagement
- R&D expenditure 2011
- Expenditure by product group
- Civil and defence expenditure, by broad product group
- UK business R&D expenditure by industry
- Employment on R&D performed in UK businesses
- Regional breakdown of business R&D expenditure and employment
- Sources of funds for R&D in UK businesses
- Ownership of businesses who perform R&D in the UK
- International comparisons
- Background notes
- Methodology
1. Key points
In 2011, total business research and development (R&D) expenditure in the UK, in cash terms, increased by 8% to £17.4 billion, compared with 2010. In real terms, R&D expenditure increased by 6% compared to 2010
The largest increases in R&D expenditure, in cash terms, were in computer programming and information service activities (£293 million; 19% increase), motor vehicles and parts (£288 million; 23% increase) and the pharmaceuticals industry (£169 million; 4% increase)
Defence R&D expenditure increased by 10% in 2011 to £1.8 billion. This was mainly driven by government awarded contracts to UK businesses to develop aircraft, naval ships, submarines and their systems and equipment
Total R&D expenditure in 2011 represented 1.1% of Gross Domestic Product (GDP), which is in line with previous years
For the first time, the ownership of businesses that perform R&D in the UK is split equally between foreign and UK owned companies
2. Overview
This release provides estimates of businesses' expenditure and employment relating to R&D performed in the UK in 2011, irrespective of the residence of the ultimate owner or users of the R&D produced. Estimates in cash terms present the values of R&D expenditures collected by the Business Enterprise Research and Development (BERD) survey, while real terms estimates have been adjusted for changes in the general price level between years using the GDP deflator. This allows changes in the volume of R&D expenditures to be examined over time.
While R&D is often thought of as synonymous with high-tech firms that are on the cutting edge of new technology, many established consumer goods companies spend large sums of money, on a systematic basis, improving existing products.
The activities that are classified as R&D differ from company to company, but there are two basic models. In one model, the primary function of R&D is to develop new products; in the second model, the primary function of R&D is to discover and create new knowledge about scientific and technological topics with the purpose of uncovering and enabling development of new products, processes, and services. According to the Department for Business Innovation and Skills (BIS), R&D is defined as “any project to resolve scientific or technological uncertainty aimed at achieving an advance in science or technology”.
For the purposes of National Statistics, R&D and related concepts follow internationally agreed standards defined by the Organisation for Economic Cooperation and Development (OECD), as published in the ‘ Frascati’ Manual. R&D, in the Frascati Manual, is defined as “creative work undertaken on a systematic basis in order to increase the stock of knowledge, including knowledge of man, culture and society and the use of this stock of knowledge to devise new applications”.
The Frascati Manual was originally written by, and for, the experts in OECD member countries that collect and issue national data on R&D. The definitions provided in this manual are internationally accepted and now serve as a common language for designing, collecting and using R&D data.
The BERD survey has been run annually since 1993. A sample of approximately 5,000 UK businesses was selected for this survey from a continually updated register of R&D performers. The main purpose of the BERD survey is to supply data for policy and monitoring purposes on science and technology, of which R&D is an important part.
As part of this release, estimates for 2009 and 2010 have been revised to take account of businesses late returns and misreporting (see background note 5).
The National Accounts provide the framework that is used to define and measure the UK’s economic performance, such as the size of the UK economy (GDP). Changes to the European System of Accounts (ESA) mean that expenditure on R&D will contribute, from 2014 onwards, to the formation of assets and therefore the value of the UK’s net worth. To facilitate this, additional questions were included as part of the BERD 2011 data collection. Please see the ONS ESA 2010 page for more information.
Published alongside this release, with the aim of assisting users with their understanding of R&D and related concepts, are two information notes. The first, ‘Coverage of the Business Enterprise Research and Development Survey’ (147 Kb Pdf), reports on the completeness of these estimates. The second, ‘Coherence of UK Research & Development Statistics’ (807.8 Kb Pdf), draws attention to the coherence of BERD R&D estimates with other UK and international measures of R&D.
In March 2013 ONS will publish UK Gross Domestic Expenditure on Research and Development (GERD) for the year 2011. The UK GERD publication includes estimates for R&D carried out by the following four sectors of the economy, as defined in the Frascati manual, business enterprise (BERD), higher education (HERD), government (GovERD) which includes research councils, and Private Non-Profit (PNP) organisations. GERD uniquely provides information on total R&D expenditure in the UK, and is the preferred measure for use in international comparisons of R&D expenditure.
Back to table of contents3. User engagement
We are constantly aiming to improve this release and its associated commentary. We would welcome any feedback you might have, and would be particularly interested in knowing how you make use of these data to inform your work. Please contact us via email: RandD@ons.gov.uk or telephone David Matthews on +44 (0)1633 456756.
Back to table of contents4. R&D expenditure 2011
Since 1985 there has been a steady increase in R&D expenditure in cash terms. In 2011, £17.4 billion was spent on R&D performed within UK businesses. This is compared with £11.5 billion in 2000 and £5.0 billion in 1985. The 2011 estimate of £17.4 billion is an increase of 8% in cash terms (current) compared with the 2010 estimate (£16.1 billion).
In real terms, the 2011 estimate of £17.4 billion is a 6% increase on the 2010 estimate (£16.4 billion) of expenditure on R&D performed in UK businesses. In real terms the general trend (Figure 1) has also been one of an increase in expenditure since 1985 (£6.5 billion increase).
Figure 1: R&D expenditure by businesses in the UK
Source: Office for National Statistics
Download this chart Figure 1: R&D expenditure by businesses in the UK
Image .csv .xlsFigure 2, below, shows expenditure on business R&D as a percentage of GDP, in cash terms. Total BERD R&D expenditure in 2011 represented 1.1% of GDP. This estimate is in line with recent years and is a slight decrease on the 1.2% estimate for the years 2000 and 2001. Figure 2 highlights that business R&D expenditure, as a percentage of GDP in cash terms, peaked in 1986 at 1.5%.
Figure 2: Expenditure on R&D by businesses in the UK as a percentage of GDP
Source: Office for National Statistics
Download this chart Figure 2: Expenditure on R&D by businesses in the UK as a percentage of GDP
Image .csv .xlsThe target set by the UK government in chapter four of the Science and Innovation Framework 2004 - 2014 was to increase business investment in R&D towards a goal of 1.7% of GDP by the end of 2014.
Back to table of contents5. Expenditure by product group
On an annual basis the 400 largest R&D spenders are asked to select the industry product groups that best describe the type of R&D activities that they undertake. The concept of ‘product groups’ is discussed in detail as part of the background notes to this release (background note 9).
The UK is home to some of the world’s largest pharmaceutical companies, and also to the largest aerospace business in Europe. Although there have been some large restructures and closures of key sites during the reporting period, investment in pharmaceutical R&D remains high.
This is reflected in the amount of expenditure invested in pharmaceutical R&D in 2011 at £4.9 billion, an increase of 4% on the 2010 estimate. This expenditure accounts for 28% of the total expenditure on R&D performed in UK businesses in 2011.
Five other product groups reporting significant R&D expenditure in the UK in 2011 were:
computer programming and information service activities, £1.8 billion (10% of total business R&D expenditure)
motor vehicles and parts, £1.5 billion (9% of total business R&D expenditure)
aerospace, £1.4 billion (8% of total business R&D expenditure)
telecommunications, £1.1 billion (6% of total business R&D expenditure)
machinery and equipment, £970 million (6% of total business R&D expenditure)
As indicated in Figure 3 below, these six product groups accounted for 67% of the total UK business R&D expenditure in 2011.
Figure 3: R&D expenditure by businesses in the UK by detailed product groups, 2011
Source: Office for National Statistics
Notes:
- A = Pharmaceuticals
B = Computer programming and information service activities
C = Motor vehicles and parts
D = Aerospace
E = Telecommunications
F = Machinery and equipment
G = All other product groups
Download this chart Figure 3: R&D expenditure by businesses in the UK by detailed product groups, 2011
Image .csv .xlsOf the 33 detailed product groups, 22 saw an increase in levels of R&D expenditure by UK businesses, in cash terms, since 2010, with 11 showing a decrease. In terms of growth in R&D expenditure, in percentage terms since 2010, the largest increases were in construction (57%); casting of iron and steel (57%); shipbuilding (45%) and wholesale and retail trade (33%) product groups. In contrast, two of the top six product groups, aerospace and telecommunications, showed small decreases in expenditure of 1% and 7% respectively compared with the 2010 estimates.
Back to table of contents6. Civil and defence expenditure, by broad product group
R&D expenditure and employment can be divided between the civil and defence sectors. Expenditure in the civil sector in 2011 (£15.6 billion), accounted for 89% of total R&D expenditure.
In cash terms in 2011, civil R&D expenditure increased by 8% from £14.4 billion to £15.6 billion and defence R&D increased by 10% from £1.7 billion to £1.8 billion compared to 2010.
Figure 4, shows that whereas business R&D expenditure in real terms in the civil sector has increased by 54% since 1989, business expenditure on R&D in the defence sector has decreased in real terms by 39%.
Figure 4: Expenditure on civil and defence R&D performed in UK businesses
Source: Office for National Statistics
Download this chart Figure 4: Expenditure on civil and defence R&D performed in UK businesses
Image .csv .xlsCivil R&D expenditure can be further divided between the manufacturing and services sectors. In 2011, expenditure in manufacturing accounted for 70% of total civil R&D expenditure and services accounted for 28%. However, since 2000, expenditure on R&D in manufacturing (10% increase in real terms) has not kept pace with the increase in R&D expenditure in services (76% increase).
Mechanical engineering, part of the manufacturing sector, is the largest contributor to defence R&D expenditure (31% of total defence expenditure) in 2011, with aerospace (23%) and electrical machinery (19%) second and third respectively. See Table SB5 in the data section of this publication.
Back to table of contents7. UK business R&D expenditure by industry
In response to user requirements identified in the BERD quinquennial review (1.44 Mb Pdf), and as part of the UK Statistic Authority assessment of ‘Statistics on Research and Development’ a new table has been included for the first time as part of this publication (Table 27) detailing estimates of R&D expenditure on an industry basis, by Standard Industrial Classification (SIC).
By SIC, R&D was performed predominantly, unsurprisingly, by businesses that are classified to the ‘Scientific research and development’ industry (34% of total expenditure).
Five other industry classifications showing significant R&D expenditure in the UK in 2011 were:
computer programming, consultancy and related activities, £1.5 billion (9% of total business R&D expenditure)
manufacture of motor vehicles, £1.3 billion (7% of total business R&D expenditure)
manufacture of other transport equipment, £1.2 billion (7% of total business R&D expenditure)
manufacture of computer, electronic and optical products, £977 million (6% of total business R&D expenditure)
architectural and engineering activities, £879 million (5% of total business R&D expenditure)
These six industry sectors accounted for 67% of the total UK business R&D expenditure in 2011.
Figure 5: UK businesses R&D expenditure by industry
Source: Office for National Statistics
Notes:
- A = Scientific research and development
B = Computer programming, consultancy and related activities
C = Manufacture of motor vehicles
D = Manufacture of other transport equipment
E = Manufacture of computer, electronic and optical products
F = Architectural and engineering activities
G = All other industrial classifications
Download this chart Figure 5: UK businesses R&D expenditure by industry
Image .csv .xlsIt is important to note that these estimates are not directly comparable with the estimates of R&D expenditure by detailed product groups. This is due to the fact that businesses may have reported significant R&D in industry sectors which are different to the main classification of their business as part of the Inter-Departmental Business Register (IDBR), from which the estimates of SIC are derived. See background notes 9 and 10, which explain the concepts of product groups and SIC in more detail.
Back to table of contents8. Employment on R&D performed in UK businesses
Estimates of employment in R&D are produced on a full-time equivalent (FTE) basis whereby businesses convert part-time employees’ hours into a full-time employees’ equivalent. FTE estimates provide a better indication of total labour input than a simple headcount.
The number of FTE staff employed on R&D increased by 4,000 to 158,000 between 2010 and 2011. The number of scientists and engineers increased from 87,000 to 89,000 and accounted for 56% of all staff employed on R&D in UK businesses. The number of technicians increased by 2,000 to 43,000, while administrative staff numbers remained the same at 27,000 in 2011 (Figure 6).
Figure 6: Employment in R&D performed in UK businesses
Source: Office for National Statistics
Notes:
- This is not a continuous time series
Download this chart Figure 6: Employment in R&D performed in UK businesses
Image .csv .xls9. Regional breakdown of business R&D expenditure and employment
It is possible, using data from the BERD survey, to analyse R&D expenditure by region. In this context, region refers to the location where the businesses perform the R&D, not the location of either the businesses headquarters or of any external funders.
The South East and East of England continue to dominate where R&D is performed in the UK. These two regions accounted for almost half of UK business R&D expenditure in 2011 at 47% (Map 1). These regions also employed 43% of total R&D employment, on an FTE basis, in 2011.
Map 1: Expenditure on R&D performed in UK businesses, 2011

Download this image Map 1: Expenditure on R&D performed in UK businesses, 2011
.png (252.0 kB)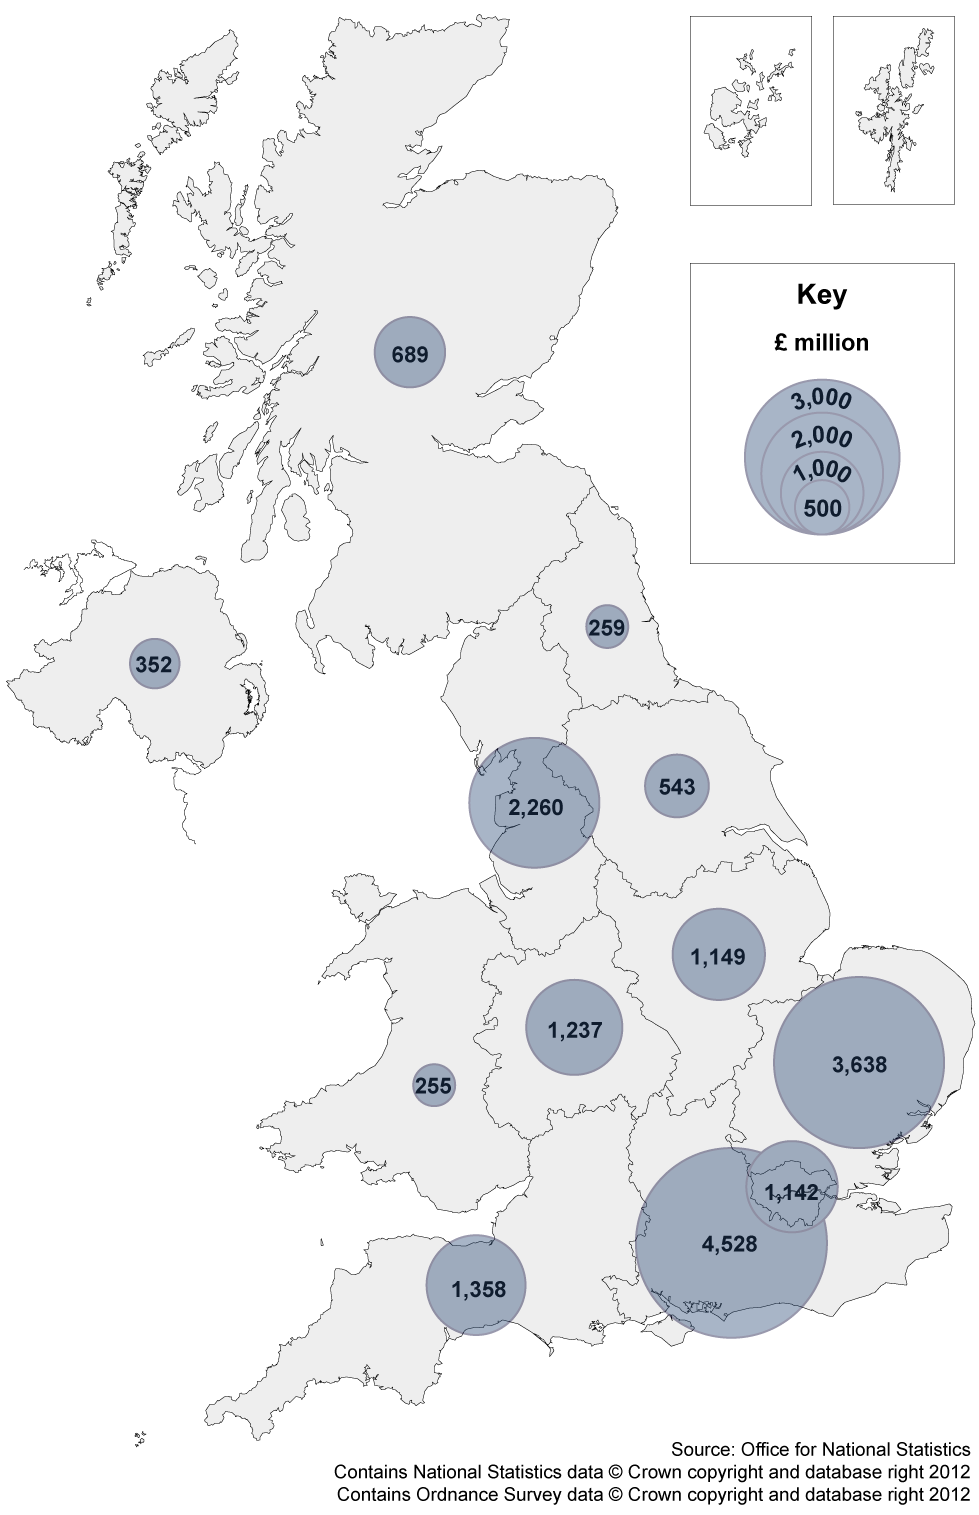
The majority of UK business R&D expenditure was carried out in England, at 93% in 2011. All of the UK regions, England, Wales, Scotland and Northern Ireland showed an increase in business R&D expenditure in 2011 compared to 2010, with growth of 8%, 9%, 11% and 9% respectively.
Back to table of contents10. Sources of funds for R&D in UK businesses
The largest source of R&D funding in 2011 was from businesses’ own funds at £11.3 billion, which accounted for 65% of total R&D expenditure. Overseas funding of UK businesses R&D constituted £3.7 billion in 2011, 21% of total expenditure (Figure 7).
Figure 7: Sources of funds for R&D performed in UK businesses
Source: Office for National Statistics
Download this chart Figure 7: Sources of funds for R&D performed in UK businesses
Image .csv .xlsThe UK government’s funding of businesses’ R&D in 2011 was £1.6 billion, 9% of total expenditure. This funding was predominantly in the defence sector (£1.2 billion), 73% of total government funding. This includes government awarded contracts to UK businesses to develop aircraft, naval ships, submarines and their systems and equipment.
Back to table of contents11. Ownership of businesses who perform R&D in the UK
Since the BERD survey began on an annual basis in 1993, the majority of annual UK business R&D expenditure has always been by UK owned businesses. In 1993, 73% of UK R&D expenditure was by UK owned businesses and 27% by foreign owned businesses. In contrast, in 2011, 50% of UK business R&D expenditure was by foreign owned businesses, and 50% by UK owned businesses (Figure 8).
Figure 8: Ownership of businesses who perform R&D in the UK
Source: Office for National Statistics
Download this chart Figure 8: Ownership of businesses who perform R&D in the UK
Image .csv .xls12. International comparisons
When comparing total business R&D intensity across countries, it is important to take into account differences in their industrial structure. The OECD has produced a Science, Technology and Industry Scoreboard to facilitate these comparisons.
In March 2012, as part of a publication ‘The UK R&D Landscape’, it was reported that “the business enterprise component of R&D expenditure in the UK is low by international standards, even after adjusting for structural difference between countries. It is also concentrated in the hands of a few very large firms and the small number of industrial sectors in which they are based. The official statistics reveal that the largest 10 business R&D spenders accounted for 34% of all UK R&D in 2009 and the largest 50 spenders accounted for 56%” (Hughes and Mina 2012, pp.i).
Back to table of contents