1. Main points
In the year ending (YE) September 2015:
Net long-term international migration = +323,000 (up 31,000 from YE September 2014).
Immigration = 617,000 (up 2,000 from YE September 2014).
Emigration = 294,000 (down 29,000 from YE September 2014).
The latest increase in net migration was not statistically significant compared with YE September 2014. This net increase was the result of a decrease (not statistically significant) in emigration from 323,000 in YE September 2014 and immigration being at a similar level to the previous year.
Net migration in YE September 2015 was 13,000 lower (not statistically significant) than the peak level of 336,000 published for YE June 2015.
Net migration of EU citizens was estimated to be 172,000 (compared with 158,000 in YE September 2014; change not statistically significant). Non-EU net migration (191,000) was similar to the previous year (188,000).
The estimate of immigration for EU citizens was 257,000, compared with 246,000 in YE September 2014. Whilst this was not statistically significant, there was a statistically significant increase in immigration of EU2 citizens to 55,000 in YE September 2015 (up 15,000). Conversely, immigration of non-EU citizens saw a decrease from 289,000 to 273,000 (not statistically significant).
Of the 290,000 people who immigrated for work in YE September 2015 (up 25,000; not statistically significant), 59% (170,000) had a definite job to go to. 165,000 EU citizens came to the UK for work-related reasons. Of these, 96,000 (58%) came for a definite job and 69,000 (42%) came looking for work.
Of all EU2 citizens who came to the UK in YE September 2015, 45,000 (87%) came for work-related reasons, a statistically significant increase of 18,000 from YE September 2014. Around two-thirds (28,000) arrived with a definite job to go to, a statistically significant increase of 17,000 from YE September 2014.
Latest employment statistics from the Labour Force Survey show estimated employment of EU nationals (excluding British) living in the UK was 2.0 million in October to December 2015, 215,000 higher than the same quarter last year. Non-EU nationals in employment increased by 38,000 to 1.2 million and the total number of British nationals in employment increased by 278,000 to 28.3 million. Therefore, nearly half of the growth in employment over the last year was accounted for by foreign nationals. (These growth figures represent the NET change in the number of people in employment, not the proportion of new jobs that have been filled by non-UK workers.)
In 2015, visas granted (non-EU, main applicants) for skilled work rose 1,920 (+4%) to 54,383, accounting for most of the 2,576 (+2%) increase in total work visas granted (to 122,426).
There were 828,000 National Insurance Number (NINo) registrations to adult overseas nationals in 2015, an increase of 60,000 (8%) on the previous year.
Long-term immigration for study was estimated to be 174,000 in YE September 2015, compared with 190,000 in YE September 2014 (not statistically significant). Over the same period, the total number of applications for a visa to study (excluding short-term students) fell by 5% to 239,564 and non-EU applications to study at a UK university (main applicants) fell by 2% to 168,221.
There were 38,878 asylum applications (including dependants) in 2015, an increase of 20% compared with the previous year (32,344). This is the fifth successive year in which asylum applications have risen, although the number of applications is low relative to the peak in 2002 (103,081).
The largest number of applications for asylum, including dependants, came from nationals of Eritrea (3,756; +465), followed by Iran (3,694; +1,195), Pakistan (3,254; -722), Sudan (3,014; +1,399) and Syria (2,846; +493). There were an additional 1,194 Syrian nationals granted humanitarian protection under the Syrian Vulnerable Persons Resettlement Scheme.
Grant rates vary between nationalities; for example, 86% of the total initial decisions made for those giving Syrian as their nationality were grants of asylum or another form of protection, compared with 20% for Pakistani nationals.
Back to table of contents2. About the MSQR
If you are new to migration statistics, you might find it helpful to read our “International migration statistics first time user guide”.
The Migration Statistics Quarterly Report (MSQR) is a summary of the latest quarterly release of official international migration statistics. This edition covers those released on 25 February 2016 and includes links to other migration products released on that date. The latest ONS estimates refer to the year ending September 2015, though other estimates’ periods may differ as stated. A summary version of this report is available on our website. The MSQR series brings together statistics on migration published by the Office for National Statistics (ONS), the Home Office and the Department for Work and Pensions (DWP).
ONS migration statistics use the UN recommended definition of a long-term international migrant: “A person who moves to a country other than that of his or her usual residence for a period of at least a year (12 months), so that the country of destination effectively becomes his or her new country of usual residence.” Figures relating to visas are produced by the Home Office and include long-term and short-term migrants and their dependants; the Department for Work and Pensions National Insurance number allocations to adult overseas nationals also include long-term and short-term migrants. The estimates in the MSQR do not identify illegal migrants.
Long-Term International Migration (LTIM) estimates are mainly based on data from the International Passenger Survey (IPS), with adjustments made for asylum seekers, non-asylum enforced removals, visitor and migrant switchers and flows to and from Northern Ireland. This report uses LTIM estimates where available. However, these adjustments are only possible for single variables (that is, citizenship or reason for migration). Estimates which look at citizenship by reason for migration are based solely on IPS data. In these cases the IPS totals will not match LTIM totals, but will give a good measure of magnitude and direction of change.
There is considerable interest in migration statistics both nationally and internationally, and they are a fundamental component of our mid-year population estimates. These are used for planning and service delivery, resource allocation and managing the economy. Additionally, migration statistics are used to monitor progress against a government-stated ambition of delivering annual net migration in the tens of thousands, not the hundreds of thousands1.
For further information on how our migration statistics are used, along with information on their fitness for purpose including strengths and limitations, please see the “quality and methodology information for long-term international migration (LTIM) releases” and the “accuracy of migration estimates” section.
If you would like to subscribe to our newsletter, please send an email to population.statistics@ons.gov.uk with the subject title “Subscribe to ONS Population Statistics Newsletter”.
You can also follow our statistician @PaulVickers_ONS on Twitter for the latest Population Statistics news and updates, and to join in the conversation.
New for this release
As part of our ongoing work to improve our bulletins, we have now included additional charts and tables within the “Provisional Estimates of Long-Term International Migration” and selected LTIM 2-series tables, showing estimates using the new country groupings on which ONS consulted in 2014. Users will notice that the charts and additional commentary in the MSQR focus on these new country groupings.
The updated LTIM 2 series tables include those on citizenship, country of birth, and country of last or next residence (Tables 2.01a, 2.01b, 2.02, and 2.03). It should be noted, if analysing time-series data, that these estimates are only available from 2010 onwards due to the complexity of calculating LTIM statistics for these new groupings. Also, definitions, such as British citizenship, have changed slightly and may not be precisely consistent if comparing with the old country groupings. Please see the notes pages within the table spreadsheets for more information.
A list of which countries are in each of the old and new groups are available in LTIM tables 3.24, 3.25 and 3.26.
As a result of the improvements above:
A more comprehensive estimate of EU2 citizenship is now available within Table 1b, taking into account the additional LTIM adjustments. Estimates of EU2 migration have previously only been available using IPS data alone.
All estimates quoted within this report are LTIM-based estimates, unless otherwise stated
in the new country groupings agreed in the 2014 consultation, British citizenship was extended to include British Overseas citizenships. All references to British and non-British in this document use this new grouping
Annual final data tables
ONS have also published the underlying data behind the IPS estimates of long-term international migration for calendar years 2000 to 2014. These underlying datasheets provide a finer level of detail than was previously available in our publication tables, providing estimates for individual countries by a number of variables, such as: citizenship, country of birth, and country of last or next residence. The datasheets can be found on our website. These datasheets are designed to be software readable, enabling users to carry out their own analysis of our data.
Throughout the report, all changes referred to are from the year ending September 2014 to the year ending September 2015, unless otherwise stated.
Notes for about the MSQR
Back to table of contents3. Net migration to the UK
Net migration is the difference between immigration and emigration.
- The net migration estimate for the year ending (YE) September 2015 is 323,000 and has a 95% confidence interval of +/-37,000, an increase (although not statistically significant) from the estimate of 292,000 (+/-42,000) in YE September 2014.
Net migration in YE September 2015 was 13,000 lower (not statistically significant) than the peak level of 336,000 published for YE June 2015. Users should note that the data, being based on estimates for the preceding 12 months, will cover overlapping periods.
(From here on, any reference to change, such as increase or decrease, refers to YE September 2015 compared with YE September 2014. All estimates quoted within this section are Long-Term International Migration (LTIM) based estimates, and comparisons are not statistically significant, unless otherwise stated.)
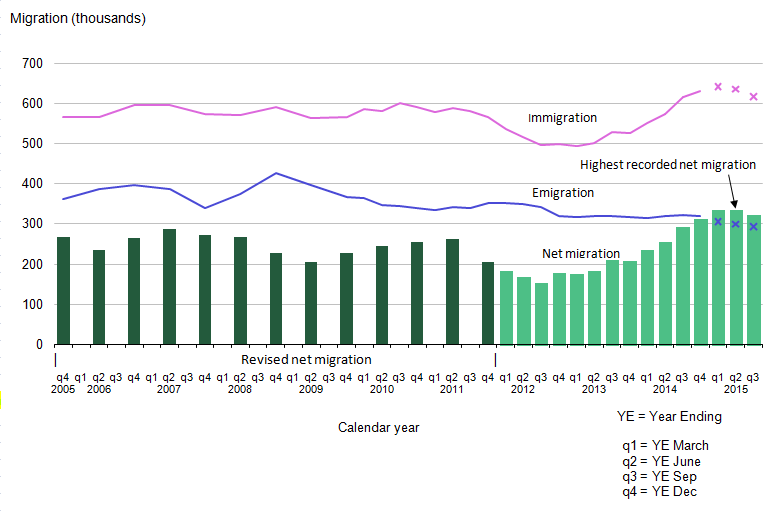
Figure 1 shows rolling annual estimates from YE December 2005 onwards illustrating that the latest provisional net migration estimate is higher than the emigration estimate, a result of immigration being more than twice as high as emigration.
Figure 1: Long-Term International Migration
UK, 2005 to 2015 (YE September 2015)
Source: Long-term International Migration - Office for National Statistics
Notes:
- Figures for years ending 2015 are provisional. In this chart provisional estimates are represented by a cross.
- Net migration estimates for the period 2001 to 2011 have been revised in light of the 2011 Census. Immigration and emigration estimates have not been revised and are therefore not consistent with the revised net migration estimates. The revised estimates are only available for the years ending June and December each year.
Download this image Figure 1: Long-Term International Migration
.png (30.6 kB) .xls (39.4 kB)
Figure 2 provides annual totals from 1970 to 2014 to show the longer-term context.
Figure 2: Long-Term International Migration
UK, 1970 to 2014 (annual totals)

Source: International Passenger Survey (IPS), Long-term International Migration - Office for National Statistics
Notes:
- Net migration estimates for the period 2001 to 2011 have been revised in light of the 2011 Census. Immigration and emigration estimates have not been revised and are therefore not consistent with the revised net migration estimates.
- Data pre-1991 are IPS data only. LTIM data are shown from 1991 onwards.
- Although Malta and Cyprus also acceded in 2004, they are not included in the EU8.
Download this image Figure 2: Long-Term International Migration
.png (26.2 kB) .xls (36.4 kB)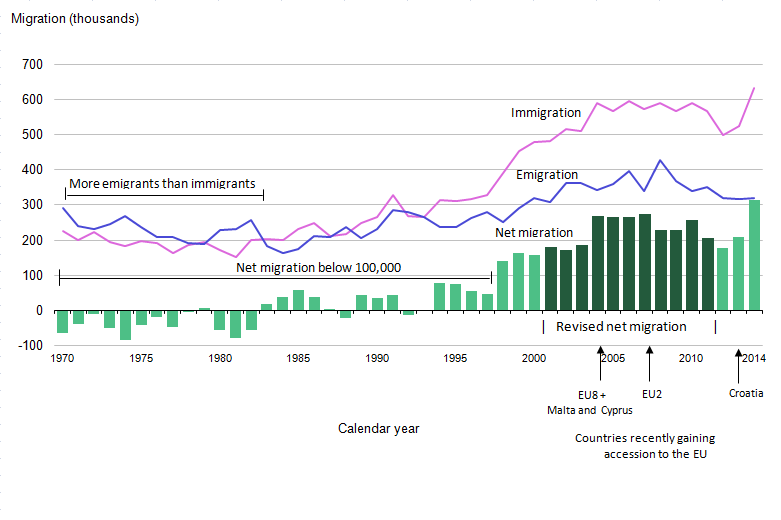
An interactive version of Figure 2 up to 2014 with additional commentary is available on the Neighbourhood Statistics website.
Table 1 shows the headline figures for YE September 2014 and YE September 2015 with their corresponding confidence intervals. Statistically significant changes are normally denoted with an asterisk, but no changes in this table are statistically significant.
Table 1: Latest changes in migration, UK, YE September 2014 and YE September 2015
| United Kingdom | |||||
| thousands | |||||
| YESep 2014 | 95% CI | YE Sep 2015 | 95% CI | Difference | |
| Net migration | 292 | +/-42 | 323 | +/-37 | 31 |
| Immigration | 615 | +/-35 | 617 | +/-32 | 2 |
| Emigration | 323 | +/-23 | 294 | +/-19 | -29 |
| Source: Office for National Statistics Notes: 1. 2015 estimates are provisional. 2. Figures are rounded to the nearest thousand. Figures may not sum due to rounding. 3. Further information on confidence intervals can be found in the MSQR Information for Users. 4. YE = Year Ending. 5. CI = Confidence Interval. 6. Statistically significant change at the 5% level is indicated by an asterisk. | |||||
Download this table Table 1: Latest changes in migration, UK, YE September 2014 and YE September 2015
.xls (27.1 kB)The most recent increase in net migration (not statistically significant) has been driven by a decrease in emigration (not statistically significant) coupled with a similar level of immigration compared with the previous year.
In December 2013, ONS published a report on the history of immigration to the UK based on the 2011 Census in collaboration with the Home Office, which provides further analysis of the drivers behind historical migration to the UK.
Table 2 illustrates EU and non-EU citizens net migration for YE September 2014 and YE September 2015 with their corresponding confidence intervals. Statistically significant changes are normally denoted with an asterisk, but no changes in this table are statistically significant.
Table 2: Latest changes in EU and non-EU citizens net migration, UK, YE September 2014 and YE September 2015
| United Kingdom | |||||
| thousands | |||||
| YE Sep 2014 | 95% CI | YE Sep 2015 | 95% CI | Difference | |
| British | -54 | +/-20 | -40 | +/-18 | 14 |
| EU (Total exc British) | 158 | +/-28 | 172 | +/-26 | 14 |
| EU15 | 77 | +/-20 | 80 | +/-18 | 3 |
| EU8 | 42 | +/-17 | 42 | +/-14 | 0~ |
| EU2 | 35 | +/-10 | 49 | +/-12 | 14 |
| Non-EU | 188 | +/-24 | 191 | +/-20 | 3 |
| Source: Office for National Statistics | |||||
| Notes: | |||||
| 1. 2015 estimates are provisional. | |||||
| 2. 0~ = rounds to zero. | |||||
| 3. Figures are rounded to the nearest thousand. Figures may not sum due to rounding. | |||||
| 4. Further information on confidence intervals can be found in the MSQR Information for Users. | |||||
| 5. YE = Year Ending. | |||||
| 6. CI = Confidence Interval. | |||||
| 7. Statistically significant change at the 5% level is indicated by an asterisk. | |||||
Download this table Table 2: Latest changes in EU and non-EU citizens net migration, UK, YE September 2014 and YE September 2015
.xls (28.7 kB)Figure 3 shows the trend in net migration for EU, non-EU and British citizens. This reflects 7 quarters of data since transitional controls on the employment of EU2 migrants ended on 1 January 2014.
Figure 3: Long-Term International net migration by citizenship
UK, 1975 to 2015 (YE September 2015)

Source: International Passenger Survey (IPS), Long-term International Migration - Office for National Statistics
Notes:
- Figures for 2015 are provisional and quarterly. All other figures are final calendar year estimates of LTIM. Provisional rolling quarterly estimates are represented in this chart by a cross.
- This chart is not consistent with the total revised net migration estimates as shown in Figures 1 and 2. This also means that estimates for the period 2001 to 2011 are not fully comparable with those for later periods.
- Note that the data for 2015 reflects quarterly year ending data whereas before 2014 the data are calendar year data.
Download this image Figure 3: Long-Term International net migration by citizenship
.png (26.9 kB) .xls (36.4 kB)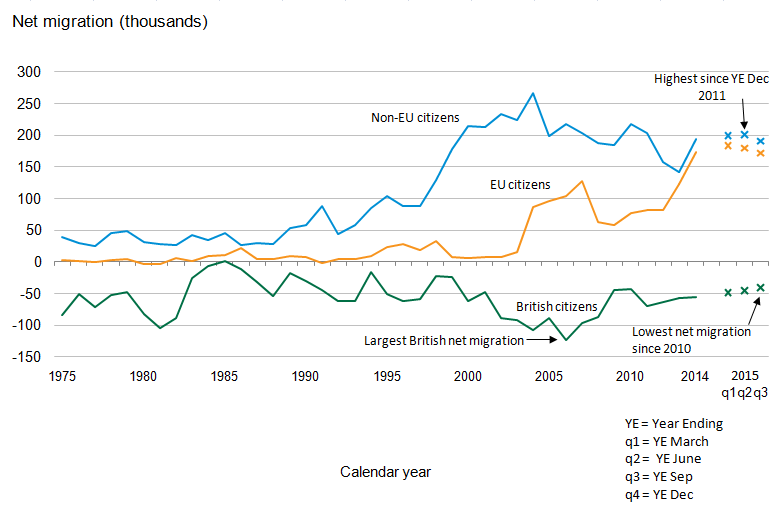
Net migration for EU citizens was estimated to be 172,0001 in YE September 2015 (compared with 158,000 in YE September 2014). The apparent increase in EU net migration (not statistically significant) was largely due to the increase in net migration of EU2 citizens (increasing from 35,000 to 49,000 (not statistically significant)). Net migration of EU15 and EU8 citizens remained similar to the previous year, 80,000 and 42,000 respectively, in YE September 2015.
In YE September 2015, non-EU net migration was 191,000, a similar level compared with the previous year (188,000). However, there were statistically significant increases in net migration of East Asian citizens and Sub-Sahara African citizens (to 40,000 and 24,000 respectively).
Notes for net migration to the UK
- Throughout the report, users are encouraged to review our published tables and note the confidence intervals around our estimates. These confidence intervals give an indication of the accuracy of the estimates and the extent to which comparisons can be drawn between them.
4. Immigration to the UK
- The latest immigration estimate for the year ending (YE) September 2015 is 617,000, with a confidence interval of +/-32,000, similar to 615,000 (+/-35,000) in YE September 2014.
The immigration trend, in Figure 1, showed that immigration decreased slightly in the years ending June 2015 and September 2015. Users should note the data, being based on estimates for the preceding 12 months, will cover overlapping periods.
(From here on, any reference to change, such as increase or decrease, refers to YE September 2015 compared with YE September 2014. All estimates quoted within this section are Long-Term International Migration (LTIM) based estimates and comparisons are not statistically significant, unless otherwise stated.)
Immigration of EU citizens was estimated to be 257,000 compared with 246,000. Non-EU immigration was estimated to be 273,000 compared with 289,000 (Figure 4).
Figure 4: Immigration to the UK by citizenship
2005 to 2015 (YE September 2015)

Source: International Passenger Survey (IPS), Long-term International Migration - Office for National Statistics
Notes:
- Figures for 2015 are provisional. In this chart provisional estimates are represented by a cross.
- This chart is not consistent with the total revised net migration estimates as shown in Figures 1 and 2.
Download this image Figure 4: Immigration to the UK by citizenship
.png (22.2 kB) .xls (35.3 kB)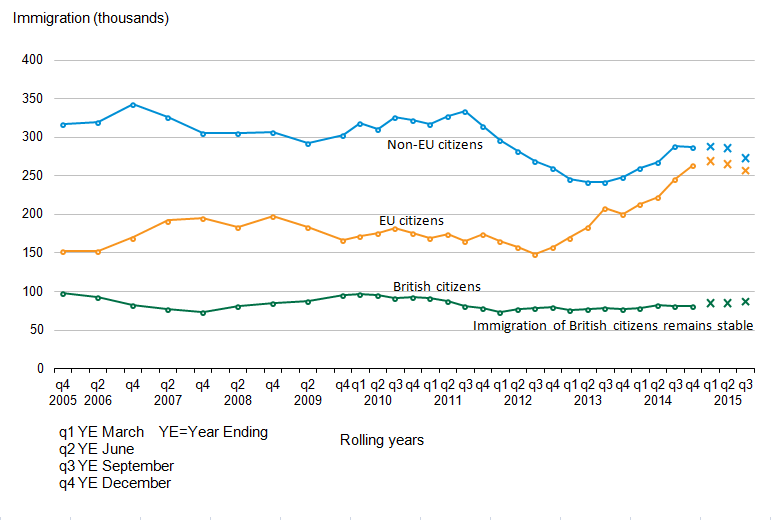
EU citizens
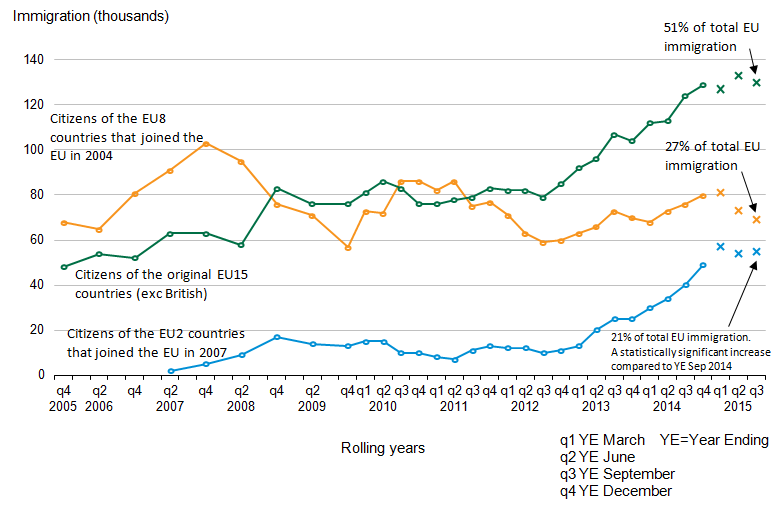
Figure 5 shows how EU immigration is split between the 3 main EU groups.
Figure 5: EU immigration to the UK
2005 to 2015 (YE September 2015)
Source: International Passenger Survey (IPS) - Office for National Statistics
Notes:
- Figures for 2015 are provisional. In this chart provisional estimates are represented by a cross.
Download this image Figure 5: EU immigration to the UK
.png (31.8 kB) .xls (31.7 kB)
While the increase in immigration of EU citizens was not statistically significant, there was a statistically significant increase in EU2 immigration, from 40,000 to 55,000. EU2 citizens now account for 21% of total EU immigration compared with 16% in YE September 2014.
Bulgaria and Romania (EU2) joined the EU on 1 January 2007. Migrants coming to the UK from these countries were initially subject to transitional employment restrictions, which placed limits on the kind of employment they could undertake. These restrictions ended on 1 January 2014.
Estimates of immigration for the EU8 (69,000) and EU15 (130,000) groups showed no statistically significant changes. Figure 5 shows that recent trends for EU15 and EU2 citizens have levelled out, whereas the trend for EU8 citizens shows an apparent decrease (not statistically significant).
Non-EU citizens
Immigration of non-EU citizens was estimated to be 273,000 compared with 289,000. Non-EU citizens continue to account for a slightly larger share of immigration, compared to EU citizens. This gap is narrowing with recent larger increases seen for EU immigration and an overall decrease in immigration from non-EU citizens, following a peak in 2004.
There was a statistically significant decrease of South Asian citizens immigrating, from 67,000 to 53,000.
Immigration estimates of non-EU citizens showed a decline between YE September 2011 and YE June 2013. This decline was largely due to lower immigration of Asian citizens, in particular for study. Visa statistics suggest this was related to the sharp decline in long-term immigrants from South Asia coming to study in the further education sector. Since YE September 2014 until YE June 2015 immigration of non-EU citizens remained steady.
British citizens
Long-Term International Migration estimates show that in YE September 2015, the estimated number of British citizens immigrating to the UK was 87,000. This figure is similar to the 81,000 British citizens estimated to have immigrated to the UK in YE September 2014. These numbers may include British citizens returning to the UK after living abroad for a period, or some British citizens who were born abroad and may be coming to the UK for the first time. IPS estimates show that British citizens are immigrating for:
work-related reasons (42,000)
going home to live (19,000)
accompanying/joining others (12,000)
formal study (9,000)
Entry clearance visas
Nationality information on individuals that are subject to immigration controls, coming from non-EU countries, is provided by data on entry clearance visas.
Figure 6: Entry clearance visas granted (excluding visitor and transit visas) to the UK, top 10 nationalities, 2015

Source: Home Office
Notes:
- China excludes Hong Kong.
- The image shows the number of entry clearance visas granted, excluding visitor and transit visas, for the top 10 nationalities in 2015. The data are available in Home Office Quarterly Immigration Statistics within the visa topic section.
Download this image Figure 6: Entry clearance visas granted (excluding visitor and transit visas) to the UK, top 10 nationalities, 2015
.png (159.5 kB) .xls (278.5 kB)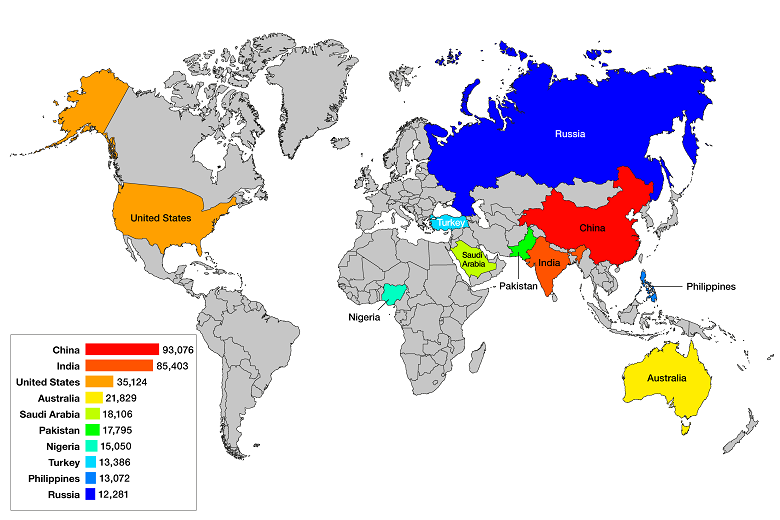
Figure 6 shows, for 2015, the top 10 nationalities granted visas after excluding visitor and transit visas. Asian nationals accounted for 299,009 (56%) of the 534,328 longer-term visas granted in 2015, with China and India accounting for 17% and 16% of the total respectively. The third largest number granted went to Americans, who comprised less than 7% of the total.
The number of such non-visitor visas granted in 2015 (534,328), decreased slightly from 2014 (down 11,749 or –2%). Increases for Chinese nationals (up 7,923 or +9%) were offset by falls for Russians (down 7,281 or –37%) and Libyans (down 7,035 or –82%).
There are a range of potential reasons why the long-term immigration estimates from the passenger survey may differ from figures for visas granted or passenger arrivals, including:
differences in coverage, including differences between intentions and visa length
sampling variation in the IPS
timing differences between when visas are granted and when an individual travels
visa and admissions data includes dependants, and both short-term and long-term migrants
Although the above figures exclude visitor and transit visas, they will include some individuals who do not plan to move to the UK for a year or more, as well as dependants. Nevertheless, recent trends in visas granted have provided a good leading indicator for trends in long-term non-EU immigration.
For more information see the Home Office Immigration Statistics October to December 2015 bulletin. In addition, ONS published an annual report on Short-Term International Migration, 21 May 2015.
Immigration to the UK by main reason
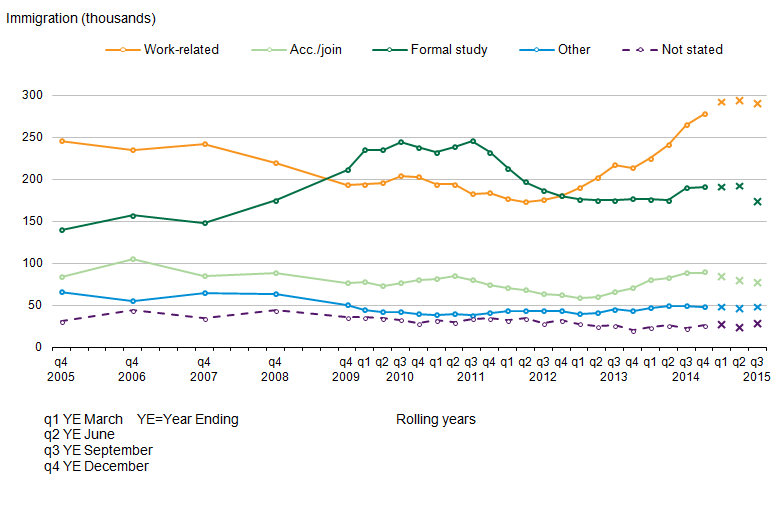
The following sections describe the main reason for migration for long-term immigrants to the UK. Approximately three-quarters of immigrants to the UK are people migrating to work or study (Figure 7).
Figure 7: Long-Term International Migration estimates of immigration to the UK, by main reason for migration
2005 to 2015 (YE September 2015)
Source: International Passenger Survey (IPS), Long-term International Migration - Office for National Statistics
Notes:
- Figures for 2015 are provisional. In this chart provisional estimates are represented by a cross.
- Up to YE Dec 09, estimates are only available annually.
- Acc./join means accompanying or joining.
Download this image Figure 7: Long-Term International Migration estimates of immigration to the UK, by main reason for migration
.png (26.4 kB) .xls (33.3 kB)
Of those whose main reason for migration was work-related, the majority (60%) were EU citizens; whereas of those whose main reason for migration was study, the majority (71%) were non-EU citizens. Changes in flows of people migrating for these reasons are affected by the differing rights of EU and non-EU citizens to migrate to the UK and by the impact of government policy.
Home Office visa statistics show that the largest proportion of the 534,328 visas granted (excluding visitors and transit visas) to non-European Economic Area (EEA) nationals in 2015 was for study (210,348), excluding the short-term student category (formerly known as “student visitors”). The second most important category was work, with 165,977 visas granted, including both skilled and temporary work visas. In addition, 62,626 short-term student category and 37,859 family-related visas were granted.
IPS long-term immigration estimates for work and formal study amongst non-EU nationals broadly follow the same long-term trends as visas granted for work and study. However, IPS estimates will be lower than the visa figures because the IPS estimates exclude those individuals who intend to stay for less than 1 year, and there will be other differences in categorisation. Furthermore, the dependants of those granted a visa to work or study are included in the work and study visas figures, whereas the reason for migration for such individuals, in most cases, are likely to be recorded as accompanying or joining others by the IPS.
IPS statistics and visa statistics represent flows of people, only a proportion of whom will remain for longer periods or seek to stay permanently. A Home Office research report “The reason for migration and labour market characteristics of UK residents born abroad” (September 2014) used data from the Labour Force Survey to provide estimates of the stock of residents born abroad by the reason for original migration. This report revealed that the distribution of original reasons given by non UK-born residents of the UK was very different from that produced when looking at the migration flows reported in the IPS. The Home Office ‘Migrant Journey’ statistics and the ONS report “International Student Migration – What do the statistics tell us” provide further information.
Immigration for work
For long-term international migration flows the most commonly stated reason for immigration to the UK is work (Figure 7). 290,000 people immigrated for work in YE September 2015 compared with 265,000 the previous year. Of these, 59% (170,000) had a definite job to go to.
IPS estimates show around 60% of immigrants arriving for work were EU citizens, 24% were non-EU citizens and 15% were British citizens.
IPS estimates show that 165,000 EU citizens arrived for work in YE September 2015, compared with 143,000 in YE September 2014. While this was not statistically significant, there was a statistically significant increase in EU2 citizens coming for work, from 27,000 to 45,000. EU immigration for work began to increase following the EU Accession (enlargement) in 2004, from 65,000 in 2004, to 125,000 in 2007. There was a decline in EU immigration for work during 2008 and 2009, particularly among EU8 citizens. Up until 2012 it remained steady at around 90,000. Since then EU immigration for work has increased (Figure 8) particularly by EU2 and EU15 nationals.
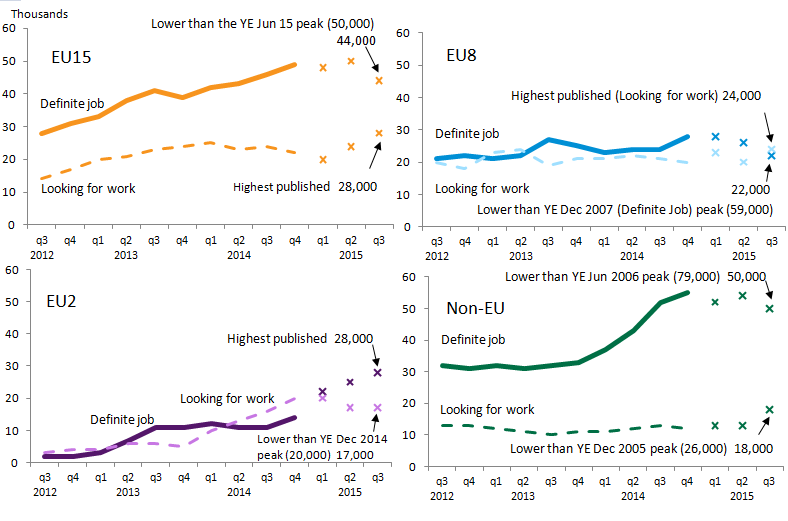
Figure 8: IPS estimates of immigration to the UK for work-related reasons by citizenship
YE September 2012 to YE September 2015
Source: International Passenger Survey (IPS) - Office for National Statistics
Notes:
- Figures for 2015 are provisional. In this chart provisional estimates are represented by a cross.
- These are rolling year estimates, and peaks are shown with the appropriate “year ending” data.
Download this image Figure 8: IPS estimates of immigration to the UK for work-related reasons by citizenship
.png (33.7 kB) .xls (30.2 kB)
IPS estimates show approximately 58% (96,000) of all EU immigrants arriving for work-related reasons reported they had a definite job to go to (the remaining 42% (69,000) came looking for work). The equivalent percentages for the EU2, EU15 and EU8 citizenship groups are 62%, 61% and 48% respectively. These proportions have changed over the last year, from 41%, 66% and 52% respectively. This is showing that for EU15 and EU8 a smaller proportion of those immigrating for work had a definite job to come to in YE September 2015. For EU8 citizens, this is the first time since YE June 2013 that more people arrived looking for work than with a definite job. For EU2 citizens, a much larger proportion of those immigrating for work had a definite job to come to in YE September 2015, a statistically significant increase to 28,000 from 11,000 in YE September 2014.
According to the latest IPS figures, the number of long-term non-EU immigrants arriving for work-related reasons in YE September 2015 was 67,000 (similar to the 66,000 in YE September 2014). Of the non-EU immigrants who arrived for work-related reasons, 50,000 (75%) had a job to go to, reflecting the need to obtain a work visa for people coming from outside the EU, which in most cases would require sponsorship by an employer. Around half of those non-EU immigrants arriving for work-related reasons were Asian nationals, of which 90% had a definite job.
National Insurance Number (NINo) allocations to adult overseas nationals
Figure 9 shows the rolling 12 month totals for NINo registrations to adult overseas nationals, split by EU and non-EU nationals. In YE December 2015, 828,000 overseas nationals registered for a NINo (an increase of 60,000 (8%) on the previous year) of which three-quarters were from within the EU. Of these, 209,000 were EU2 nationals, an increase of 22,000 (12%) on YE December 2014. Romanian citizens were allocated 170,000 and Bulgarian citizens 39,000.
It should be noted that these figures also include short-term migrants and the figures are based on recorded registration date on the national insurance recording and pay as you earn system (NPS), that is, after the NINo application process has been completed, and so are not a direct measure of when a person migrated to the UK. As a result of this, NINo and IPS estimates are not directly comparable with each other. More information on this is available in the MSQR Information for Users.
Although figures do accurately reflect the number of NINos registered over time, a change to the process of recording NINos during the quarter April to June 2014, means that the volume of NINo registrations recorded were lower in that quarter and then higher in the subsequent quarter July to September 2014 than would otherwise be the case. Comparisons of NINo registrations over time between these periods should be viewed with caution.
The sharp rise in registrations to EU2 nationals in 2014 is reflecting migration over an extended period. Over a third of the EU2 nationals registering for a NINo in the year from January 2014 had reported that they were already in the UK before transitional controls were lifted on 1 January 2014.
Figure 9: National Insurance Number allocations to adult overseas nationals entering the UK from the EU and non-EU, rolling 12-months from March 2006 to December 2015
Source: Department for Work and Pensions
Notes:
- The figures are based on recorded registration date on the National Insurance Recording and Pay as you Earn System (NPS), ie after the NINo application process has been completed, and are not a direct measure of when a person migrated to the UK.
Download this chart Figure 9: National Insurance Number allocations to adult overseas nationals entering the UK from the EU and non-EU, rolling 12-months from March 2006 to December 2015
Image .csv .xls
Table 3: National Insurance Number registrations to adult overseas nationals entering the UK, YE December 2015
| United Kingdom | ||||
| thousands | ||||
| World area | Year to December 2014 total | Year to December 2015 total | Difference | % Change to previous year |
| Total | 768 | 828 | 60 | 8% |
| European Union | 590 | 630 | 40 | 7% |
| EU15 | 217 | 232 | 15 | 7% |
| EU8 | 183 | 185 | 2 | 1% |
| EU2 | 187 | 209 | 22 | 12% |
| Non European Union | 176 | 197 | 21 | 12% |
| Source: Department for Work and Pensions | ||||
| Notes: | ||||
| 1. The figures are based on recorded registration date on the National Insurance Recording and Pay as you Earn System, ie after the NINo application process has been completed. This may be a number of weeks or months (and in some cases years) after arriving in the UK. | ||||
| 2.The number of new registrations of NINos to non-UK nationals over a given period is not the same as the total number of non-UK nationals who hold a NINo. | ||||
| 3.The total number of non-UK nationals who have been allocated a NINo is not the same as the number of non-UK nationals working in the UK. This is because people who have been allocated NINos may subsequently have left the UK, or they may still be in the UK but have ceased to be in employment. | ||||
| 4. Some people arriving into the UK may already hold a NINo from a previous stay in the UK. Once a person has been allocated a NINo, they do not need to reapply in order to work in the UK. | ||||
| 5. There are a small number of cases where the nationality of an individual is not recorded on the source system – therefore sum of world areas may differ to total. | ||||
Download this table Table 3: National Insurance Number registrations to adult overseas nationals entering the UK, YE December 2015
.xls (27.6 kB)For EU citizens, the number of NINo registrations in YE December 2015 was 630,000, an increase of 40,000 (7%) on the previous year. The top 5 EU nationalities for new NINo registrations in YE December 2015 were:
- Romanian (170,000)
- Polish (111,000)
- Italian (59,000)
- Spanish (50,000)
- Bulgarian (39,000)
For non-EU citizens, the number of NINo registrations in YE December 2015 was 197,000, an increase of 21,000 (12%) on the previous year. The top 5 non-EU nationalities for new NINo registrations in YE December 2015 were:
- Indian (35,000)
- Australian (14,000)
- Chinese (13,000)
- Pakistani (13,000)
- Nigerian (11,000)
Labour market statistics
The latest labour market statistics from the Labour Force Survey (LFS) show that the number of non-UK nationals in employment increased by 254,000 (9%) to 3.2 million in October to December 2015 compared with the same quarter in the previous year. Employment of EU nationals increased by 215,000 (12%) to 2.0 million and employment of non-EU nationals increased by 38,000 (3.4%) to 1.2 million. The total number of British nationals in employment increased by 278,000 to 28.3 million.
The growth in overall employment over the last year was 532,000 and of this, 52% can be accounted for by a growth in employment for UK nationals and 48% by the growth in employment amongst foreign nationals (where nationality is known). (These estimates relate to the number of people in employment rather than the number of jobs and therefore show NET changes in the number of people in employment, not the proportion of new jobs that have been filled by UK and non-UK workers.)
Labour market statistics show an estimated 202,000 EU2 citizens were employed in the UK in October to December 2015, an increase of 31% from the same quarter in the previous year. This follows the lifting of labour market restrictions for EU2 citizens in January 2014.
There was also an increase of 12% to 853,000 for EU15 (excluding British) citizens and an increase of 8% to 968,000 for EU8 citizens. Labour market statistics are a measure of the stock of people working in the UK and are not designed to provide a measure of migration flows. As a result changes in the labour market stock cannot be directly compared to long-term net migration changes.
Work-related visas (Non-EEA nationals)
Trends in visa numbers reflect both changes to the immigration rules and the prevalent economic environment. There were falls in numbers of work-related visas granted following the introduction of the points-based system and the onset of the recession in 2008. More recently, the closure of the Tier 1 general and Tier 1 post-study categories to new applicants has led to further reductions in work visas (see Home Office Immigration Statistics release – Work topic). Recently the numbers of skilled work visas (Tier 2) have started to rise, which is likely to reflect the growth in the UK economy and resultant demand for skilled migrant workers.
In 2015, the number of work visas granted increased by 2% to 122,426 (for main applicants only). This increase was largely accounted for by skilled work visas granted which rose 1,920 (+4%) to 54,383.
Including dependants, there were 92,062 Tier 2 skilled work visas granted in the calendar year 2015, up 2% (+1,365), and 44,948 Tier 5 youth mobility and temporary visas granted, also up 2% (+945). These were offset by fewer grants in the Tier 1 Investor category, down 76% (-2,287) following changes introduced in November 2014 to address concerns over misuse of that visa category, and fewer grants to dependants in routes now closed to new applicants (Tier 1 General -1,506; Tier 1 Post Study -346).
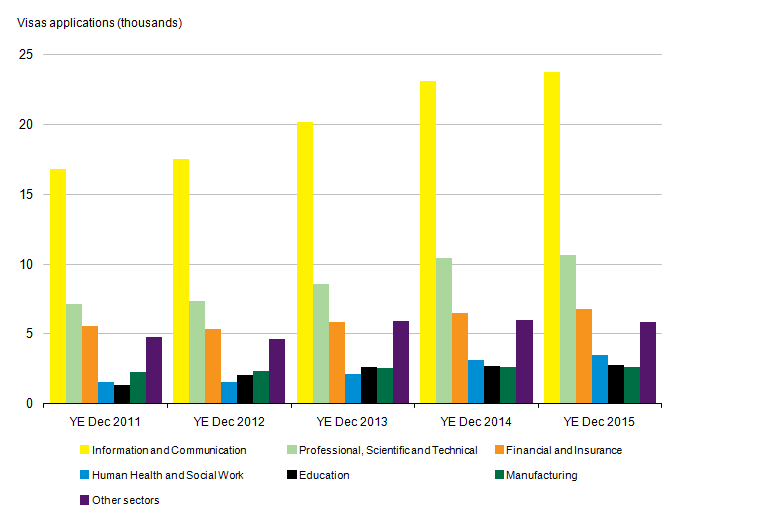
There was a 3% increase in sponsored visa applications for skilled work to 56,012 in 2015 (main applicants). Most of the increase in skilled work was accounted for by the 4 largest sponsorship sectors: Information and Communication (23,741; +3%), Professional, Scientific and Technical Activities (10,642; +2%), Financial and Insurance Activities (6,810; +4%) and Human Health and Social Work Activities (3,513; +13%). The Information and Communication sector accounted for 42% of applications by skilled work sponsors (Figure 10).
Indian nationals accounted for 57% of total skilled work visas granted (52,360 of 92,062), with USA nationals the next largest nationality group (10,130 or 11%).
Figure 10: Skilled work visa applications by industry sector
UK, YE December 2011 to YE December 2015
Source: Home Office
Notes:
- As part of the application process for visas, individuals must obtain a certificate of sponsorship from an employer. The data shown relate to the numbers of sponsoring documents used by main applicants applying for tier 2 (Skilled work) visas.
- European Economic Area (EEA) nationals do not require a visa to enter the UK.
Download this image Figure 10: Skilled work visa applications by industry sector
.png (20.7 kB) .xls (27.1 kB)
Immigration for study
Immigration to the UK to study was estimated to be 174,000 in YE September 2015, compared with 190,000 in YE September 2014. IPS estimates show 23% were EU citizens arriving to study and 71% were non-EU citizens. Over the same period, visa applications to study fell by 5% to 239,564 and non-EU applications to study at a UK university (non-EU, main applicants) fell slightly (down 2%) to 168,221.
Of the 71% (117,000) of non-EU citizens migrating to the UK for study, over two-thirds are Asian citizens. Immigration of Asian citizens for study rose from 78,000 in YE June 2008 to a peak of 166,000 in YE September 2011. This number has since decreased and is currently at 82,000 in YE September 2015.
There are a range of reasons why LTIM and IPS figures for long-term migrants for study may be different from Home Office figures for study visas granted. For example, the Home Office visa statistics include short-term students migrating to the UK for less than 1 year, but only record students from outside the EU.
Home Office statistics show that in 2015 there were 210,348 visas granted for the purposes of study, excluding the short-term student category (formerly known as “student visitors”), a fall of 4% compared with 2014. The top 5 nationalities (Chinese, American, Indian, Malaysian and Nigerian) accounted for 55% of the 210,348 study visas granted in 2015, with the largest number going to Chinese nationals (70,754; 34% of the total).
The largest absolute increases in the number of study visas granted were to:
Chinese (+6,153; +10%)
Egyptian (+336; +26%) nationals
and the largest absolute decreases in the number of study visas granted were to:
Libyan (-2,442; -66%)
Iraqi (-2,384; -68%)
Brazilian (-1,925; -45%) nationals
The total number of study-related sponsored visa applications (for main applicants) fell 3% in 2015 (201,763) compared with 2014 (208,423), Statistics on sponsored applications for visas by education sector show that the falls over recent years in visas granted for study to non-EEA nationals have been almost wholly in the non-university sector (Figure 11).
In 2015, visa applications to study at a UK university (main applicants) fell by 1% to 166,366 but there was a 7% increase for Russell Group1 universities to 75,634. There were also falls in 2015 for:
the further education sector (to 15,982, -17%)
English language schools (to 2,930, -13%)
the independent schools’ sector (to 13,675, -3%)
Figure 11: Study-related sponsored visa applications by sector
UK, YE December 2010 to YE December 2015
Source: Home Office
Notes:
- The numbers show the use of a Certificate of Acceptance for Study (CAS) in a study visa application.
- Universities are “recognised bodies” (meaning that they have their own UK degree-awarding powers), or bodies in receipt of public funding as a Higher Education Institute (HEI). Institutions (including further education colleges) which receive some public funding to deliver higher education courses do not fall within this definition of an HEI. They are UK-based. Further education contains the remainder of sponsors who described themselves as “University and tertiary”, plus those who described themselves as “Private Institution of Further or Higher Education” or whose self-description included “further education” or ”higher education”. Includes a small number of foreign-based universities, but these account for very small numbers of CAS used.
- The chart excludes sponsored visa applications from a small number of other sponsors.
Download this chart Figure 11: Study-related sponsored visa applications by sector
Image .csv .xls“Short-term students” (formerly “student visitors”) cannot normally stay for longer than 11 months (most are for the shorter 6 month visa) and are therefore not covered in detail in this report. There were 279,000 “short-term student” admissions in the calendar year 2014, a higher number than the number of “short-term student” visas granted over the same period (73,607) because not all nationalities require a visa to visit the UK for short periods of study. For example, the USA, Brazil and Japan accounted for 121,000, 19,100 and 17,200 respectively of the “short-term student” admissions to the UK in 2014, none of whom will feature in the short-term student visa numbers.
For more information on immigration to the UK for study, see the Home Office topic report on Study and the Home Office research report on Student Visitors.
Immigration for other reasons
Reasons for migrating other than work or study include accompanying or joining family or friends, seeking asylum and returning home to live. Figure 7 shows these other reasons in brief.
The third most common reason for migrating to the UK is to accompany or join others. In YE September 2015, 77,000 long-term migrants arrived in the UK to accompany or join others (Figure 7), a decrease of 11,000 (not statistically significant).
The long-term migration accompany/join category can include people who are arriving to marry a UK resident as well as people coming as a family member of another migrant coming for other reasons, such as to work2.
Family visas (Non-EEA nationals)
There are a number of ways that people can come to the UK for family reasons. The traditional “family route” is made up of those coming to join or accompany family members who are already British citizens or settled in the UK. This includes fiancé(e)s, proposed civil partners, spouses, civil partners, unmarried or same-sex partners, children and adult dependant relatives. Home Office entry clearance visa statistics show that 37,859 family route visas were granted in 2015, an increase of 9% compared with 2014 (34,876), although nearly half the level of the peak in YE March 2007 (72,894).
Further information on visas granted for family reasons has been published by the Home Office.
Asylum applications
There were 38,878 asylum applications (including dependants) in YE December 2015, an increase of 20% compared with the previous year (32,344). This is the fifth successive year in which asylum applications have risen, although the number of applications is low relative to the peak in 2002 (103,081).
In 2015, the largest number of applications for asylum to the UK, including dependants, came from nationals of Eritrea (3,756; +465), followed by Iran (3,694; +1,195), Pakistan (3,254; -722), Sudan (3,014; +1,399) and Syria (2,846; +493).
A total of 13,902 people were granted asylum or an alternative form of protection in 2015. Grant rates for asylum, humanitarian protection, discretionary leave or other grants of stay vary considerably between nationalities. For example, 86% of the total initial decisions made for those giving Syrian as their nationality were grants of asylum or another form of protection, compared with 20% for Pakistani nationals.
In addition, a total of 1,864 people in need of protection, including dependants, were resettled in the UK in 2015. Of these, 1,194 were granted humanitarian protection under the Syrian Vulnerable Persons Resettlement Scheme (1,337 since the scheme began). On 7 September 2015 the Prime Minister announced an expansion to the existing Syrian Vulnerable Persons Relocation Scheme. It is expected that 20,000 Syrians in need of protection will be resettled in the UK by 2020.
Further information on asylum has been published by the Home Office.
Settlement in the UK
The number of people granted permission to stay permanently in the UK fell by 14% to 89,932 in YE December 2015. The number of grants is low relative to the peak number of grants in the year ending September 2010 (241,586), and similar to levels seen in 1999 (97,117). The decrease in the latest year was driven by falls in family-related grants (-16,236). This may partly reflect changes to the rules in July 2012 on how quickly partners qualify for settlement and the number of visas and extensions granted in previous years.
In February 2016 the Home Office published its “Migrant journey: sixth report”, which shows how non-EEA migrants change their immigration status, and the immigration routes used prior to achieving settlement in the UK.
Main points include:
25% (20,437) of those issued skilled work visas in 2009 (with a potential path to settlement) had been granted settlement 5 years after their initial visa had been granted and a further 10% (7,906) still had valid leave to remain.
Indian nationals were issued the largest proportion (41% of the total) of skilled work visas in the 2009 cohort and, of these skilled Indian nationals, 24% had received settlement after 5 years . A further 8% still had valid leave to remain, slightly lower than the average rates for all skilled workers
Other findings in the Migrant Journey statistical report relate to family migrants, students and temporary workers and visitors
In May 2015, the Home Office published an update to the article “Extensions of stay by previous category”. Looking at extensions data by individuals’ previous category, 7,043 former students were granted extensions for work in 2014 (main applicants). The comparable figure for 2013 was 6,238 and for 2012 was 38,505. The large fall from 2012 to 2013 reflected the closure of the Tier 1 post-study category to new entrants in 2012.
Notes for immigration to the UK
The Russell Group is a self-selected association of 24 public research universities, with a shared reputation for academic prestige, situated in the United Kingdom.
Much more detail can be found in the Home Office Immigration Statistics User Guide.
5. Emigration from the UK
- The latest emigration estimate for the year ending (YE) September 2015 was 294,000 with a confidence interval of +/-19,000, a decrease from 323,000 (+/-23,000) in YE September 2014 (not statistically significant).
(From here on, any reference to change, such as increase or decrease, refers to YE September 2015 compared with YE September 2014. All estimates quoted within this section are Long-Term International Migration (LTIM) based estimates and comparisons are not statistically significant, unless otherwise stated.)
Recent levels of emigration had remained stable and well below the high of 427,000 in 2008. The latest data show a reduction in emigration from the previous year of 29,000, although this is not statistically significant.
Figure 12: Emigration from the UK by citizenship
2005 to 2015 (YE September 2015)

Source: International Passenger Survey (IPS), Long-term International Migration - Office for National Statistics
Notes:
- Figures for 2015 are provisional. In this chart provisional estimates are represented by a cross.
- This chart is not consistent with the total revised net migration estimates as shown in Figures 1 and 2. Please see guidance note for further information.
Download this image Figure 12: Emigration from the UK by citizenship
.png (22.4 kB) .xls (27.1 kB)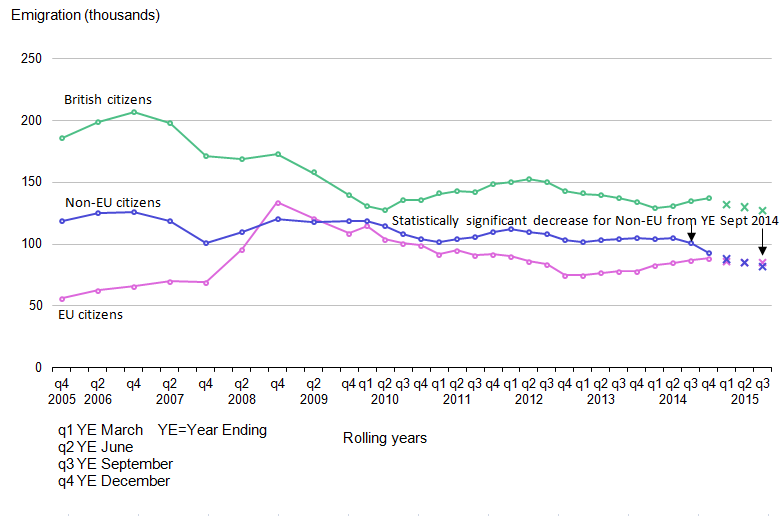
British citizens
British citizens accounted for 43% of emigrants in YE September 2015 (127,000). Emigration of British citizens has remained at around the same level since 2009, having fallen from the peak of 207,000 in 2006 (Figure 12).
EU citizens
The estimated number of EU citizens emigrating from the UK was 85,000 in YE September 2015, similar to the estimated number of EU citizens who emigrated in YE September 2014 (87,000). The latest estimates show that emigration among the various EU citizenship groups has remained stable over the last few years.
Half of non-British emigration was accounted for by EU citizens, with 54% of EU emigrants leaving for work-related reasons.
Non-EU citizens
The latest estimates show the number of non-EU citizens emigrating from the UK in YE September 2015 was 82,000, a statistically significant decrease from 101,000, driven by a statistically significant decrease in emigration by citizens of Asia (from 62,000 to 50,000).
Of the non-EU emigrants, 61% were of Asian citizenship and accounted for around a third of all non-British emigration; 72% of non-EU emigrants were emigrating for work-related reasons.
Reasons for emigration
In YE September 2015, work-related reasons remain the main reason given for emigration, accounting for 166,000 (56%) of emigrants, a reduction from 180,000 the previous year (not statistically significant). All reasons remained relatively stable for all citizenships (as a whole).
Non-EU emigration for work-related reasons was 56,000 in YE September 2015 compared with 62,000 the previous year. Almost all of the non-EU decrease was for emigrants looking for work (a statistically significant decrease from 37,000 to 29,000), driven by a statistically significant decrease from 25,000 to 19,000 in Asian citizens looking for work.
Of the 25,000 emigrants who, in the International Passenger Survey (IPS), stated their main reason for migration as “going home to live”, 18,000 were EU citizens. An estimated 7,000 were citizens of non-EU countries (a statistically significant decrease from 15,000). The peak of people leaving the UK to return home was in 2008 when 62,000 emigrated for this reason. This peak coincides with the start of the “economic downturn”.
For more detail on emigration, previous Home Office Research Report 68, published in November 2012, presents information from academic research and surveys drawn together to present the main aspects of long-term emigration from the UK. This includes recent outward migration and some trends over the last 20 years, separately for British, EU and non-EU citizens.
People emigrating from the UK by previous main reason for immigration
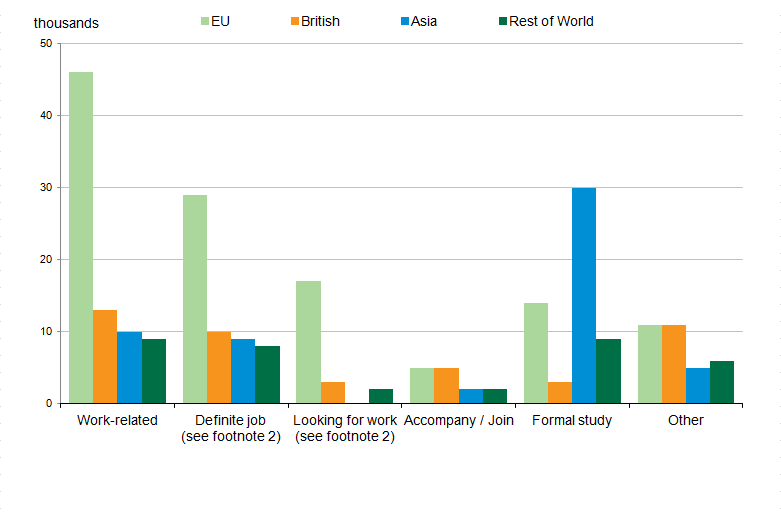
In 2012, a new question was added to the IPS asking current emigrants who had previously immigrated to the UK about their main reason for migration at the time that they arrived. Of the 274,000 individuals shown in IPS data to be emigrating from the UK, 88,000 were “new” long-term emigrants (individuals who had not previously lived away from the UK for 12 months or more) and 186,000 were long-term emigrants who had formerly immigrated to the UK.
Figure 13: Outflow of migrants, who are former immigrants to the UK, by citizenship and previous main reason for immigration (YE September 2015)
Source: International Passenger Survey (IPS), Long-term International Migration - Office for National Statistics
Notes:
- Estimates are provisional.
- “Work-related reasons” is the sum of “definite job” and “looking for work”.
Download this image Figure 13: Outflow of migrants, who are former immigrants to the UK, by citizenship and previous main reason for immigration (YE September 2015)
.png (16.0 kB) .xls (18.9 kB)
Work was the most common main reason for immigrating to the UK reported by former immigrants who emigrated in YE September 2015 (80,000, similar to the previous year 84,000). Of these 80,000, 46,000 were EU citizens and 21,000 were non-EU citizens (the remaining 13,000 were British) while 73% reported having arrived for a definite job when they migrated to the UK and 28% arrived looking for work. The estimated number of emigrants who had previously immigrated to the UK for formal study was estimated to be 57,000 compared with 70,000 the previous year. Of these 57,000 former student emigrants, 40,000 (70%) were non-EU citizens and 14,000 (25%) were EU citizens. Of the 40,000 non-EU citizens, 30,000 were citizens of Asian countries.
For further estimates related to this IPS question, please see Table 4a or Table 4b in the accompanying provisional tables for this MSQR release.
Back to table of contents6. Accuracy of migration estimates
Surveys gather information from a sample of people from a population. In the case of the IPS, the population is passengers travelling through the main entry and exit points from the UK including airports, seaports and the Channel Tunnel. The estimates produced are based on only one of a number of possible samples that could have been drawn at a given point in time. Each of these possible samples would produce an estimated number of migrants. These may be different to the true value that would have been obtained if it were possible to ask everyone passing through about their migration intentions. This is known as sampling variability.
The published estimate is based upon the single sample that was taken and is the best estimate of the true value based on the data collected. However, to account for sampling variability, the estimates are published alongside a 95% confidence interval.
The confidence interval is a measure of the uncertainty around the estimate. Confidence intervals become larger for more detailed estimates (such as citizenship by reason for migrating). This is because the number of people in the sample who have these specific characteristics (for example, EU8 citizens arriving to study in the UK) is smaller than the number of people sampled within a category at a higher level (such as the total number of EU citizens arriving to study in the UK). The larger the confidence interval is, the less precise the estimate. Therefore users of migration statistics are advised to use the highest level breakdown of data where possible.
A 95% confidence interval is used, which is a widely accepted level, meaning that over many repeats of the sample under the same conditions, we would expect the confidence interval to contain the true value 95 times out of 100. Equivalently, we can say that there would be a 1 in 20 chance that the true value would lie outside of the range of the 95% confidence interval.
Estimates from the IPS may change from one period to the next simply due to sampling variability. In other words, the change may be due to which individuals were selected to answer the survey, and may not represent any real-world change in migration patterns.
Statistical tests can be used to determine whether any increases or decreases that we see in the estimates from the IPS could be due to chance, or whether they are likely to represent a real change in migration patterns. If the tests show that the changes are unlikely to have occurred through chance alone, and are likely to reflect a real change, then the change is described as being statistically significant. The usual standard is to carry out these tests at the 5% level of statistical significance. This means that in 1 out of 20 differences identified as statistically significant, it is not possible to assert that the difference is the result of a real change.
For information on the accuracy of these statistics, the difference between provisional and final figures and guidance on comparing different data sources, please see the “MSQR Information for Users”.
Revisions to net migration estimates in light of the 2011 Census
In April 2014, we published a report examining the quality of international migration statistics between 2001 and 2011, using the results of the 2011 Census. A main finding of the report was that, over the 10 year period, annual net migration estimates were a total of 346,000 lower than total net migration implied by the 2011 Census. However, the report also showed that the quality of international migration estimates improved following changes made to the IPS in 2009.
Within the report, we published a revised series of net migration estimates for the UK. Published tables have been updated on our website to include the revised estimates. The report, a summary and guidance on how to use these revised figures are available on our website.
Users should be aware that no revisions were made to separate immigration and emigration estimates at the time the net migration estimates were revised – ONS analysis of the differences between the Census and population estimates suggest immigration figures could have been higher in the mid-2000s as a result of migration from Eastern Europe.
Revisions to migration statistics for population by country of birth and nationality
In July 2015, we published a revised back-series of estimates on the population of the UK by country of birth and nationality. The revisions, covering calendar year data from 2004 to 2013, are based on the Annual Population Survey (APS). The APS has recently been re-weighted in light of the 2011 Census results.
Back to table of contents7. List of products
The following are URL links to the products underlying this report, or otherwise associated with the co-ordinated migration release of 25 February 2016. The department releasing each product is indicated.
Annual releases:
Final Long-Term International Migration (2014) (ONS)
Short-term international migration annual report (ONS) – A report and tables detailing estimates of short-term migration to and from the UK for England and Wales for the year ending mid-2013. The product is published annually in May.
Local area migration indicators suite (ONS) – This is an interactive product bringing together different migration-related data sources to allow users to compare indicators of migration at local authority level. This product is newly updated as of 27 August 2015.
Population by country of birth and nationality (ONS) – This short report focuses on changes in the UK resident population by country of birth and nationality for the year ending December 2014. This product is newly updated as of 27 August 2015.
Methodology of migration statistics:
Overview of population statistics (ONS) – This describes different aspects of population we measure and why. Information on how these are measured, and the statistics themselves, can be found via the links provided within the document.
The MSQR user information (ONS) – guidance on interpreting confidence intervals, the difference between provisional and final estimates, and the comparability and quality of input data sources.
International migration statistics first time user guide (ONS) – an introduction to the main concepts underpinning migration statistics including basic information on definitions, methodology, use of confidence intervals and information on the range of available statistics related to migration.
Long-term international migration – Frequently asked questions and background notes (ONS) – information on recent trends in migration, methods and coverage, comparisons with international migration estimates, a complete list of definitions and terms and a guide to the published tables.
Quality and methodology information for international migration (ONS) – information on the usability and fitness for purpose of long-term international migration estimates.
Long-term international migration estimates methodology (ONS) – a detailed methodology document for LTIM estimates, including information on current methodology and assumptions, data sources including the International Passenger Survey and changes to the methodology since 1991.
International Passenger Survey: Quality information in relation to migration flows (ONS) – an overview of the quality and reliability of the International Passenger Survey (IPS) in relation to producing Long-Term International Migration estimates.
Revised estimates (2001 to 2011):
Quality of Long-Term International Migration Estimates from 2001 to 2011 (ONS)
Guidance on revised net migration statistics (ONS) – information for users on how to interpret the revised net migration estimates for 2001 to 2011 alongside published LTIM estimates.
Interactive products:
Migration theme page (ONS) – This provides the most up to date figures and highlights the latest summaries, publications and infographics for internal and international migration.
Population theme page (ONS) – This provides the most up to date figures and highlights the latest summaries, publications and infographics for different components that contribute to population change, including migration.
International Migration Timeline (ONS)
Research papers:
A Comparison of International Estimates of Long-Term Migration (ONS)
Population by country of birth and nationality, reweighted data for calendar year 2004 to 2013 (ONS) – Publication of revised datasets following the reweighting of the Annual Population Survey in light of results of the 2011 Census. The product was published in July 2015 as a one-off publication.
Seasonal patterns of Long-Term International Migration
Quarterly releases on 25 February 2016:
- Provisional Long-Term International Migration, Year Ending September 2015 (ONS)
- Immigration Statistics October to December 2015 (Home Office)
- National Insurance number (NINo) Allocations to Adult Overseas Nationals to December 2015 (DWP)
Annual releases on 26 November 2015:
Useful links to other departments:
Labour Market Statistics - February 2016 (ONS). This includes estimates of the number of people in employment in the UK by country of birth and nationality.
Migrant Journey Sixth Report (Home Office)
Immigration Statistics User Guide (Home Office)
Back to table of contents8. Future releases
The next MSQR release will be Thursday 26 May 2016.
Given the recent interest in different migration sources and what each one tells us with regards to international migration, alongside the MSQR we will be publishing a background note on the comparison of sources in migration statistics on 26 May 2016.
Back to table of contents