1. Main points
Males spend a higher proportion (80%) of their lives in “Good” health compared with females (77%)
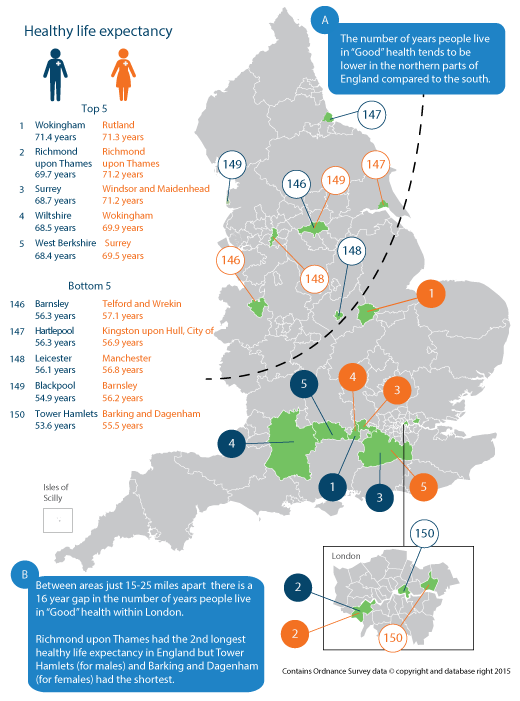
The number of years people live in “Good” health tended to be lower in the northern parts of England compared to the south
Females in the North East had a lower healthy life expectancy (HLE) than males in any other part of the country
Males in Wokingham could expect to live 17.8 years longer in “Good” health than males in Tower Hamlets (71.4 years compared with 53.6 years)
Females in Rutland could expect to live 15.8 years longer in “Good” health than females in Barking and Dagenham (71.3 years compared with 55.5 years)
Between areas just 15-25 miles apart there is around a 16 year gap in the number of years people live in "Good" health within London
HLE was higher than the state pension age of 65 in a quarter of areas for males and a third of areas for females
The largest difference in HLE between the sexes was in Camden, where females could expect to live 6.7 years longer in “Good” general health compared with males
2. What are health expectancies?
Health expectancies add a quality of life dimension to estimates of life expectancy (LE) by dividing expected lifespan into time spent in different states of health. We routinely publish 2 types of health expectancies. The first is healthy life expectancy (HLE), which estimates lifetime spent in “Very good” or “Good” health based on how individuals perceive their general health. The second is disability-free life expectancy (DFLE), which estimates lifetime free from a limiting persistent illness or disability. This is based upon a self-rated assessment of how health limits an individual’s ability to carry out day-to-day activities. Both health expectancies are summary measures of population health and important indicators of the well-being of society.
The importance of HLE as a summary measure of population health is reflected in its inclusion in the 2 high level outcomes for the public health outcomes framework (PHOF). The first outcome is increased HLE, taking account of the quality as well as the length of life. The second is to reduce differences in LE and HLE between communities, through greater improvements in more disadvantaged communities.
The HLE figures reported in this statistical bulletin are a snapshot of the health status of the population(s) in England during 2011 to 2013. The health status and mortality rates of a population change year on year due to exposure to different risks and treatments affecting health, and also through inward and outward migration. Therefore, the estimates reported in this bulletin should not be interpreted as the actual number of years a person will live in “Good” health. HLE figures are a likely estimate should the health status and mortality rates remain fairly stable over the life course.
HLE estimates are, in part, subjective and based upon the following survey question:
“How is your health in general; would you say it was...”
very good
good
fair
bad
very bad
If a respondent answered “Very good” or “Good” they were classified as having “Good” health. Those who answered “Fair”, “Bad”, or “Very bad” were classified as having “Not Good” health.
Changes in health expectancies over time are assessed by comparing non-overlapping time periods. Therefore estimates for 2011 to 2013 should not be compared with estimates for 2010 to 2012 or 2009 to 2011, as they will contain some of the same survey respondents.
Back to table of contents3. Interactive content
Explore healthy life expectancy (HLE) for your area using our animated map.
Back to table of contents4. England
Males spend a higher proportion (80%) of their lives in “Good” health compared with females (77%).
Based on current mortality and health status rates, a boy born in England in 2011 to 2013 could expect to live on average for 79.4 years, while for a girl life expectancy was 83.1 years, a gap of 3.7 years.
The gap between the number of years males and females could expect to spend in “Good” health was lower, with males expected to live 63.3 years of their 79.4 years of life, or 79.7% in “Good” health. Females could expect to live 63.9 years of their 83.1 years of life, or 76.9% in “Good” health.
Therefore males may live shorter lives on average than females but they spend a higher proportion of their lives in “Good” health.
Figure 1: Life expectancy (LE), healthy life expectancy (HLE) and proportion of life in "Good" health for males and females at birth in England, 2011 to 2013

Notes:
- Excludes residents of communal establishments except NHS housing and students in halls of residence where inclusion takes place at their parents' address.
Download this image Figure 1: Life expectancy (LE), healthy life expectancy (HLE) and proportion of life in "Good" health for males and females at birth in England, 2011 to 2013
.png (11.2 kB) .xls (49.7 kB)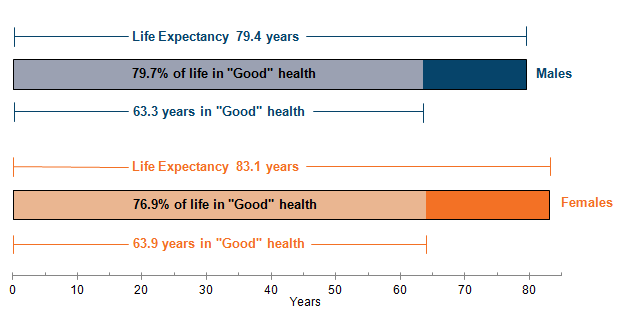
5. English regions
A north-south divide was observed in life expectancy, healthy life expectancy and the proportion of life spent in “Good” health.
Across regions, a north-south divide was observed, with the South East, South West and the East of England all having a significantly higher healthy life expectancy (HLE) than the England average. The North East, North West, Yorkshire and The Humber, and the West Midlands all had a significantly lower HLE than the England average (Table 1).
Table 1: Life expectancy (LE) and healthy life expectancy (HLE) for males and females at birth by region, 2011 to 2013
| England | |||||
| Years, percentage | |||||
| LE | HLE | Lower 95% confidence interval | Upper 95% confidence interval | Proportion of life spent in "Good" health (%) | |
| Males | |||||
| South East | 80.4 | 65.6 | 65.1 | 66 | 81.5 |
| South West | 80.1 | 65.3 | 64.8 | 65.8 | 81.6 |
| East | 80.3 | 64.6 | 64.1 | 65.1 | 80.4 |
| London | 80.0 | 63.4 | 62.9 | 63.9 | 79.2 |
| East Midlands | 79.3 | 62.7 | 62.1 | 63.3 | 79.1 |
| West Midlands | 78.8 | 62.4 | 61.9 | 62.9 | 79.2 |
| North West | 78.0 | 61.2 | 60.8 | 61.7 | 78.5 |
| Yorkshire and The Humber | 78.5 | 61.1 | 60.6 | 61.6 | 77.8 |
| North East | 78.0 | 59.3 | 58.7 | 59.9 | 76 |
| England | 79.4 | 63.3 | 63.1 | 63.4 | 79.7 |
| Females | |||||
| South East | 83.9 | 66.7 | 66.2 | 67.2 | 79.5 |
| South West | 83.8 | 65.5 | 65 | 66.1 | 78.2 |
| East | 83.8 | 65.4 | 64.8 | 65.9 | 78 |
| London | 84.1 | 63.8 | 63.3 | 64.3 | 75.9 |
| East Midlands | 83.0 | 63.5 | 62.9 | 64.2 | 76.5 |
| West Midlands | 82.8 | 62.8 | 62.3 | 63.4 | 75.9 |
| North West | 81.8 | 61.9 | 61.4 | 62.3 | 75.6 |
| Yorkshire and The Humber | 82.2 | 61.8 | 61.3 | 62.4 | 75.2 |
| North East | 81.7 | 60.1 | 59.5 | 60.7 | 73.6 |
| England | 83.1 | 63.9 | 63.8 | 64.1 | 76.9 |
| Source: Office for National Statistics | |||||
| Notes: | |||||
| 1. Excludes residents of communal establishments except NHS housing and students in halls of residence where inclusion takes place at their parents' address. | |||||
| 2. Regions are presented by gender sorted by HLE. | |||||
Download this table Table 1: Life expectancy (LE) and healthy life expectancy (HLE) for males and females at birth by region, 2011 to 2013
.xls (31.2 kB)HLE at birth was highest in the South East for both males and females (65.6 years and 66.7 years respectively) and lowest in the North East (59.3 years and 60.1 years respectively). Therefore, the inequality in HLE between regions was 6.3 years for males and 6.6 years for females. When looking at the inequality in life expectancy (LE) between regions, this was much smaller, at 2.4 years for males and 2.3 years for females.
As well as a longer life expectancy, males and females living in the southern regions can also expect to spend a greater proportion of their longer lives in a favourable health state compared with those living in the north. Males in the South West could expect to live 81.6% of their remaining lives in “Good” general health, compared with 76.0% for those in the North East. Males in the South West could therefore expect to live 5.6 percentage points more of their remaining lives in “Good” health compared with males in the North East.
The same north-south divide was evident amongst females, with females in the South East expecting to spend 5.9 percentage points more of their remaining lives in “Good” general health, compared with females in the North East (79.5% and 73.6% respectively).
When looking at HLE in terms of the state pension age, using 65 for both males and females, at which it will be by 2018, only the South East had a significantly higher HLE than the state pension age. For both males and females, London, East Midlands, West Midlands, North West, Yorkshire and The Humber, and the North East all had a significantly lower HLE than the state pension age of 65.
Females in the North East had a lower healthy life expectancy than males in any other part of the country.
Across all regions, life expectancy (LE) for females is greater than LE for males. That is, the lowest LE for females (81.7 years in the North East) is still greater than the highest LE for males (80.4 years in the South East). However, this pattern is not observed in healthy life expectancy (HLE). In fact, females in the North East had a lower HLE, 60.1 years, than males in any other part of England (except males in the North East) where HLE ranged from 61.1 years to 65.6 years.
In 2014, the North East had the highest percentage of workless households (where no-one over the age of 16 is in employment) in the UK (ONS, 2014a). The North East also had the highest proportion of people who smoked (ONS, 2014d) as well as the highest percentage of “binge drinkers1” (ONS, 2015) compared with all other regions in the UK. This could partly explain why the health of females in the North East is worse than males in every other region.
Notes for English regions
- The Government's Alcohol Strategy defines binge drinkers as men who report exceeding 8 units of alcohol on their heaviest drinking day in the week before interview, and women who report exceeding 6 units.
6. Upper tier local authorities
Differences of up to 18 years in healthy life expectancy between local authorities.
Each upper tier local authority (UTLA) was ranked from highest (1) to lowest (150) based on their healthy life expectancy (HLE) estimate.
HLE at birth was highest for males in Wokingham, where they could expect to spend 71.4 years in “Good” health. For females, HLE was highest in Rutland at 71.3 years. Tower Hamlets had the lowest HLE for males at 53.6 years and for females, Barking and Dagenham had the lowest HLE at 55.5 years. The inequality in HLE between UTLAs, using the range, was larger for males (17.8 years) than for females (15.8 years). It was also larger for HLE than for life expectancy (LE) (8.2 years for males and 6.2 years for females).
Males in Wokingham and females in Windsor and Maidenhead could expect to live the largest proportion of their remaining lives in “Good” health compared with all other UTLAs (87.4% and 84.1% respectively). The UTLAs with the shortest proportion of life spent in “Good” health were Tower Hamlets for males and Barking and Dagenham for females (69.1% and 67.4% respectively). Males in Wokingham could therefore expect to spend 18.2 percentage points more of their remaining lives in “Good” health compared with males in Tower Hamlets. A similar inequality was found for females, with a difference of 16.7 percentage points in the proportion of remaining life spent in “Good” health between Windsor and Maidenhead and Barking and Dagenham.
Figure 2: Number of years of life in "Good" health across England, 2011 to 2013
Notes:
- Excludes residents of communal establishments except NHS housing and students in halls of residence where inclusion takes place at their parents' address.
- Upper tier local authorities have been ranked at the England level, based on HLE to more than one decimal place.
Download this image Figure 2: Number of years of life in "Good" health across England, 2011 to 2013
.png (115.7 kB) .xls (392.7 kB)
For male HLE at birth, 4 of the top 5 ranked UTLAs were located in the south of England and 1 in London. A similar pattern was observed for females, with 3 of the top 5 ranked UTLAs being in the south, 1 in London and 1 in the East Midlands. For both males and females, no UTLAs in the north featured in the top 5 (Figure 2).
Looking at the bottom 5 ranked UTLAs, there was a greater geographical spread than with the top 5. For males, 3 UTLAs were located in the north of England, 1 in London and 1 in the East Midlands. While for females, 3 UTLAs were located in the north, 1 in London and 1 in the West Midlands.
Within each region, London had the largest inequality between UTLAs for both males and females, with a difference of 16.1 years and 15.7 years respectively. The greater population diversity in London, both in terms of deprivation and ethnic composition, is likely to be a contributing factor to the wider inequality found in the capital. The smallest inequality within regions was in the North East, with a difference of 7.1 years and 5.6 years for males and females respectively. It is the low HLE of all UTLAs in the North East which contributes to the small inequality experienced.
The interactive maps published alongside this bulletin show the north-south divide for both sexes. A darker shade on the maps represents lower HLE, and the lighter shades represent higher HLE.
Healthy life expectancy was higher than the state pension age of 65 in a quarter of areas for males and a third of areas for females.
Figures 3 and 4 highlight the linear relationship between living longer (LE) and living longer in a “Good” health state (HLE) for both males and females. On average, males in around a quarter of the 150 English upper tier local authorities (UTLAs) had a HLE higher than the current state pension age of 65. Of these, when assessed with 95% confidence intervals, 17 UTLAS were significantly higher. For females, HLE in around a third of the UTLAs was higher than their future state pension age of 65 (where it will be by 2018). Of these 21 were significantly higher.
The figures also further demonstrate the north-south divide: specifically, only 1 UTLA for males and 2 UTLAs for females, which had a significantly longer HLE than the state pension age were located in the north.
Figure 3: Life expectancy (LE) and healthy life expectancy (HLE) for males at birth: England 2011 to 2013
Source: Office for National Statistics
Notes:
- Excludes residents of communal establishments except NHS housing and students in halls of residence where inclusion takes place at their parents' address.
- Significance was assigned on the basis of non-overlapping 95% confidence intervals.
- Only 17 UTLAs had a significantly higher HLE than the current state pension age (65).
- Cheshire East was the only UTLA in the North with a significantly higher HLE than the state pension age (65).
- HLE was significantly lower than the state pension age (65) in 78 UTLAs.
- State Pension Age = 65.
Download this chart Figure 3: Life expectancy (LE) and healthy life expectancy (HLE) for males at birth: England 2011 to 2013
Image .csv .xls
Figure 4: Life expectancy (LE) and healthy life expectancy (HLE) for females at birth: England 2011 to 2013
Source: Office for National Statistics
Notes:
- * Age 65 has been used as the State Pension Age for females, at which it will be by 2018.
- Excludes residents of communal establishments except NHS housing and students in halls of residence where inclusion takes place at their parents' address.
- Significance was assigned on the basis of non-overlapping 95% confidence intervals.
- Only 21 UTLAs had a significantly higher HLE than the state pension age of 65.
- Cheshire East and York were the only UTLAs in the North with a significantly higher HLE than the state pension age of 65.
- HLE was significantly lower than the state pension pension age of 65 in 68 UTLAs.
- State Pension Age = 65.
Download this chart Figure 4: Life expectancy (LE) and healthy life expectancy (HLE) for females at birth: England 2011 to 2013
Image .csv .xls7. Differences between sexes
Gaps of up to 7 years in healthy life expectancy between sexes within local authorities
Within all 150 upper tier local authorities (UTLAs), life expectancy (LE) was longer for females compared with males. The largest difference between sexes was in Blackpool, where females could expect to live 5.8 years longer than males (80.1 years compared with 74.3 years).
The difference in healthy life expectancy (HLE) between males and females was more varied, with males having a longer HLE than females in just over a third of UTLAs. The largest difference between sexes in HLE in favour of males was in Barking and Dagenham, with males expected to live 5.6 years longer in “Good” general health compared with females (61.1 years compared with 55.5 years). It is the lower HLE for females in Barking and Dagenham which drives this sex inequality.
In two-thirds of upper tier local authorities (UTLAs), HLE was longer for females compared with males. The largest difference was in Camden, where females could expect to live 6.7 years longer in “Good” general health compared with males (66.7 years and 60.0 years respectively).
Although females could expect to live a longer life, males generally expect to spend a larger proportion of their lives in “Good” general health compared with females. The largest difference was in Barking and Dagenham, where males could expect to live 11.3 percentage points more of their lives in “Good” general health compared with females (78.6% compared with 67.4%). In fact there were only 9 UTLAs where females could expect to live a larger proportion of their lives in “Good” general health compared with males.
Back to table of contents8. Methods
Calculating healthy life expectancy
The data used in calculating the prevalence of “Good” general health was obtained from the annual population survey (APS). It was aggregated over a 3-year period to achieve sufficiently large sample sizes to enable meaningful statistical comparison.
However, as the size of each upper tier local authority (UTLA) varies, the number of respondents sampled in some UTLAs was a lot smaller than for others. For these authorities with relatively small sample sizes, such as the London borough of Tower Hamlets, the estimates are more susceptible to large fluctuations because of the impact of random variation.
The prevalence of “Good” general health among males and females resident in private households in England was compared across regions and UTLAs, which include unitary authorities, London boroughs and metropolitan districts in England, but excludes the City of London and the Isles of Scilly. HLE was then calculated using the Sullivan method, which combines prevalence data with mortality and mid-year population estimates (MYPE) over the same period and geographical coverage to calculate estimates of LE and HLE at birth by sex (ONS Life Table Template (192.5 Kb Excel sheet, Jagger et al, 2007). The MYPEs used to estimate HLE for this statistical bulletin are the revised backdated estimates based on the 2011 Census (ONS 2013c).
The APS provides prevalence information for those aged 16 years and over. We are able to estimate HLE at birth by directly imputing health prevalence at age 16 to 19 for those under 16 (ONS, 2013a).
The age band structure used for calculating HLE is not that outlined in the update to methodology to calculate health expectancies (ONS, 2013a) but the traditional age band structure of <1, 1 to 4, 5 to 9, 10 to 14, 15 to 19……85 and over.
Results are presented with 95% confidence intervals in reference tables to help interpretation. Confidence intervals in this statistical bulletin indicate the uncertainty surrounding HLE estimates and allow more meaningful comparisons between areas. When comparing the estimates of 2 areas, non-overlapping confidence intervals are indicative of statistical significance but to confirm this, a test of significance should be carried out. When the statistical significance is noted in the text, this is based on a statistical test of the differences (Jagger et al., 2007). All differences noted in this text have been calculated to more than 1 decimal place.
Quality information about ONS health expectancies (185.7 Kb Pdf) is available on our website.
Back to table of contents9. Uses and users
Life expectancy (LE) has increased considerably since the 1980s and is expected to increase further (ONS 2014c). However, it is important that the number of years lived in “Good” health rises faster or at the same rate. If not, then these additional years of life are being spent in poor health and greater dependency, putting additional strain on health and social care resources. Health expectancies (HEs) are therefore used to monitor whether the “extra” years gained are spent in favourable health.
The questions used to calculate HLE are in part subjective, with responses being influenced by an individual’s expectations and clear differences observed across socio-demographic factors such as age, sex, socio-economic position (749 Kb Pdf) and area deprivation.
However, self-assessed general health and limiting persistent illness (ONS, 2014b , Manor et al., 2001) are linked to more objective measures of health and have been shown to have value in predicting health care need or usage and subsequent mortality. Research evidence indicates people with poor self-assessed health (both general health and limiting persistent illness) die sooner than those who report their health more positively (Mossey and Shapiro, 1982; Idler and Benyamini, 1997; Miilunpalo et al., 1997; DeSalvo et al., 2006; Bopp et al., 2012; Ng et al., 2012).
Studies have also shown that self-assessed health, measured in terms of general health or limiting illness has some predictive value in the subsequent use of health and social care services. This is shown in increased GP visits (Miilunpalo et al., 1997), hospital admission and nursing home placement (Weinberger et al., 1986). Studies have also shown that poor self-assessed health correlates well with retirement due to disability or poor health (Pietilainen et al., 2011; Dwyer and Mitchell, 1999) and poor health outcomes (Lee, 2000).
Survey measurements of general health and limiting persistent illness are used globally to identify health inequality between administrative areas, inform health and social care service needs, indicate unmet care needs, and target and monitor the allocation of health care resources amongst population groups (Marmot, 2010). International organisations and networks such as the World Health Organisation, Eurostat and the Reves Network on Health Expectancy use this information to compare morbidity across countries, and to monitor trends over time.
Back to table of contents10. Feedback
If you have any comments or suggestions, we’d like to hear them. Please email us at hle@ons.gov.uk.
Back to table of contents