Table of contents
- Main points
- Overview
- What are health expectancies?
- What did we ask people to measure health in the UK?
- Healthy Life Expectancy (HLE) at birth
- Healthy Life Expectancy (HLE) at age 65
- Disability-Free Life Expectancy (DFLE) at birth
- Disability-Free Life Expectancy (DFLE) at age 65
- Changes in health expectancies over the decade
- What are the changes in Healthy-Life Expectancy (HLE) at birth over a decade?
- What are the changes in Disability-Free Life Expectancy (DFLE) at birth over a decade?
- What are the changes in health expectancies over a decade, at age 65 in the UK?
- Method
- Comparability
- References
- Background notes
- Methodology
1. Main points
In the UK, females born in 2009–11 are estimated to live 66.1 years in ‘Good’ health (80.2% of their life), and males 64.2 years (81.9% of their life).
At birth, females and males in Northern Ireland have the lowest health expectancy estimates in the UK, whereas those living in England have the highest estimates.
A newborn male in the UK is expected to live 1.9 years fewer in ‘Good’ health than a female in 2009–11.
At age 65, men and women in the UK are expected to live over half of their remaining lives free from disability (53.2% and 58.5% for women and men, respectively).
Scotland is the only country within the UK where women live significantly more years free from disability at age 65 than men; the gender gap is 2.5 years.
Health status in terms of disability at age 65 has worsened for women but improved for men in the UK (between 2000–02 and 2009–11).
2. Overview
With life expectancy increasing in the UK, health expectancies are a way to monitor whether the ‘extra’ years gained are spent in ‘Good’ health or free from a limiting illness or disability. This bulletin updates national estimates of disability-free and healthy life expectancy estimates for 2009– 11, both at birth and age 65 for the UK and constituent countries. This bulletin also looks at changes, between 2000–02 and 2009–11, in disability-free and healthy life expectancy at birth in the four constituent UK countries, as well as looking at changes in health expectancies at age 65 in the UK.
If you have any comments or suggestions regarding this bulletin, we’d like to hear them. Please email us at hle@ons.gov.uk or fill in this survey.
Back to table of contents3. What are health expectancies?
With life expectancy increasing in the UK, health expectancies are a way to monitor whether the ‘extra’ years gained are spent in ‘Good’ health or free from a limiting illness or disability. Health expectancies estimate the average number of years in a lifetime that a person could expect to live in a particular state of health. They are used as summary measures to assess population health status over time, and to highlight health inequalities in the UK. They also help to inform policy makers and the relevant authorities working on the planning and provision of health and social care services.
The two health expectancies reported in this bulletin are Disability-Free Life Expectancy (DFLE) and Healthy Life Expectancy (HLE). DFLE is the average number of years that an individual can expect to live free from a limiting persistent illness or disability in their lifetime. HLE is the average number of years a person might expect to live in ‘Good’ health in their lifetime.
DFLE and HLE estimates reported in this bulletin are a snapshot of the health status of the population(s) in the UK during 2009–11. The health status and mortality rates of a population change year on year due to exposure to different risks and treatments affecting, and also through inward and outward migration. Therefore, the health expectancies reported in this bulletin should not be interpreted as the actual number of years a person will live in ‘Good’ health or free from a limiting illness or disability. These health expectancies are a likely estimate should health status and mortality rates remain fairly stable over the life course.
Back to table of contents4. What did we ask people to measure health in the UK?
In each UK country a sample of residents were asked to answer questions about their health status. The health data collected to calculate HLE were gathered by asking people:
“How is your health in general? Is it...”
- Very good
- Good
- Fair
- Bad
- Very bad
If a respondent answered ‘very good’ or ‘good’ they were classified as having ‘Good’ health. Those who answered ‘fair’, ‘bad’, or ‘very bad’ were classified as having ‘Not Good’ health.
The health data collected to calculate DFLE was gathered by asking people1:
“Do you have any long-standing illness, disability or infirmity – by long-standing illness, I mean anything that has troubled you over a period of time or that is likely to affect you over a period of time?” (Yes/No)
If the answer was ‘Yes’ then the respondent was asked:
“Does this illness or disability (do any of these illnesses or disabilities) limit your activities in any way?” (Yes/No)
If the respondent answered ‘Yes’ to both questions they were classified as having a limiting persistent illness or disability. If the respondent answered ‘No’, they were classified as being free from (limiting illness or) disability2.
More information about the methodology and data sources used to calculate national health expectancies are in the ‘Method’ section.
Notes for what did we ask people to measure health in the UK?
- Harmonised standards (196.8 Kb Pdf) have replaced these questions and will be used in future estimation of national estimates of DFLE. ONS will conduct a review of data sources for health expectancy estimation in 2015 before publishing further updates.
- If the respondent indicated that they had a long-standing illness or disability but their daily activities were not limited they would be classified as being free from limiting illness or disability.
5. Healthy Life Expectancy (HLE) at birth
Figure 1 shows HLE at birth and the proportion of life spent in ‘Good’ health in the UK and its constituent countries.
Figure 1: Healthy Life Expectancy (HLE) at birth, 2009–11

Source: Office for National Statistics
Notes:
- General Lifestyle Survey used in Great Britain. Integrated Household Survey (2009) and Continuous Household Survey (2010 and 2011) for Northern Ireland.
Download this image Figure 1: Healthy Life Expectancy (HLE) at birth, 2009–11
.png (48.6 kB) .xls (585.7 kB)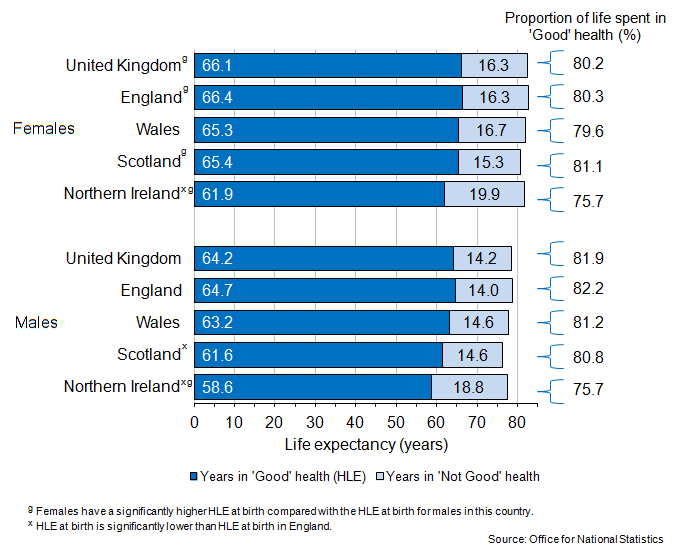
In the UK, females born in 2009–11 are estimated to live 66.1 years in ‘Good’ health (80.2% of their life), for males it is 64.2 years (81.9% of their life). The gender gap in HLE at birth is 1.9 years, with males living fewer years in ‘Good’ health compared with females.
In 2009–11, HLE at birth for females ranged from 61.9 years in Northern Ireland to 66.4 years in England, while for males it ranged from 58.6 years in Northern Ireland to 64.7 years in England. Females at birth in England are estimated to spend 4.5 years more in ‘Good’ health than females in Northern Ireland. Males living in England are estimated to spend 6.1 more years in ‘Good’ health at birth than males in Northern Ireland, and 3.2 years more than males in Scotland1.
Gender differences in the number of years spent in ‘Good’ health are found in England, Scotland, and Northern Ireland, in 2009–11. Males at birth live fewer years in ‘Good’ health compared with females at birth, with a difference2 of:
1.7 years in England
3.8 years in Scotland
3.3 years in Northern Ireland
Notes for Healthy Life Expectancy (HLE) at birth
Only significant differences between HLE estimates in England and the comparison country are mentioned. 95% confidence intervals were used to assess the differences.
Only significant differences between the HLE estimates of females and males are mentioned. 95% confidence intervals were used to assess the differences.
6. Healthy Life Expectancy (HLE) at age 65
Figure 2 shows HLE at age 65 and the proportion of life spent in ‘Good’ health in the UK and its constituent countries.
Figure 2: Healthy Life Expectancy (HLE) at age 65, in 2009–11

Source: Office for National Statistics
Notes:
- General Lifestyle Survey used in Great Britain. Integrated Household Survey (2009) and Continuous Household Survey (2010 and 2011) for Northern Ireland.
Download this image Figure 2: Healthy Life Expectancy (HLE) at age 65, in 2009–11
.png (40.4 kB) .xls (152.1 kB)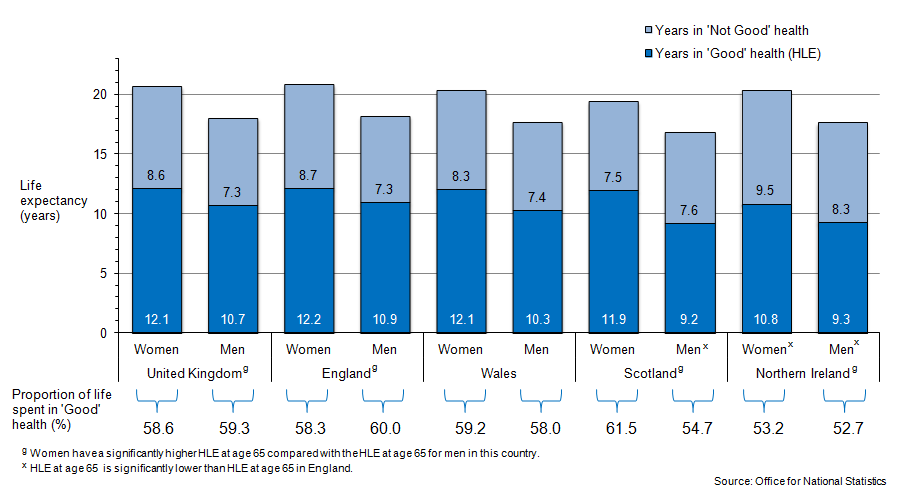
In the UK, in 2009–11 women at age of 65 are expected to live 12.1 years in ‘Good’ health, and 8.6 years in ‘Not Good’ health. Men at age 65 are estimated to live 10.7 years in ‘Good’ health, and 7.3 years in ‘Not Good’ health. Women and men in the UK in 2009–11 are therefore expected to live over half of their remaining lives at age 65 in ‘Good’ health (58.6% for women and 59.3% for men).
In 2009–11, a 65-year-old living in England is expected to live more years1 in ‘Good’ health compared with women and men in Northern Ireland, and men in Scotland. Women at age 65 living in England in 2009–11 are expected to spend 1.3 years more in ‘Good’ health than in Northern Ireland. At age 65, men in England in 2009–11 are expected to live in ‘Good’ health 1.7 years more than in Scotland, and 1.6 years more than in Northern Ireland.
The gap in HLE at age 65 between women and men in the UK is 1.4 years, with women living longer in ‘Good’ health compared with men in 2009–11. At the same age, women also live more years in ‘Good’ health2 than men in Scotland (2.7 years difference), Northern Ireland (1.5 years difference), and England (1.2 years difference). Men spend fewer years in ‘Good’ health compared with women, but because they have a shorter life expectancy at age 65 (as well as at birth), men generally spend a smaller proportion of their lives in ‘Not Good’ health compared with women in the UK. However, this pattern was not found in Scotland.
Notes for Healthy Life Expectancy (HLE) at age 65
- Only significant differences between HLE estimates in England and the comparison country are mentioned. 95% confidence intervals were used to assess the differences.
- Only significant differences between the HLE estimates of females and males are mentioned. 95% confidence intervals were used to assess the differences.
7. Disability-Free Life Expectancy (DFLE) at birth
Figure 3: Disability-Free Life Expectancy (DFLE) at birth, 2009–11

Source: Office for National Statistics
Notes:
- General Lifestyle Survey used in Great Britain. Integrated Household Survey (2009) and Continuous Household Survey (2010 and 2011) for Northern Ireland.
Download this image Figure 3: Disability-Free Life Expectancy (DFLE) at birth, 2009–11
.png (42.2 kB) .xls (192.0 kB)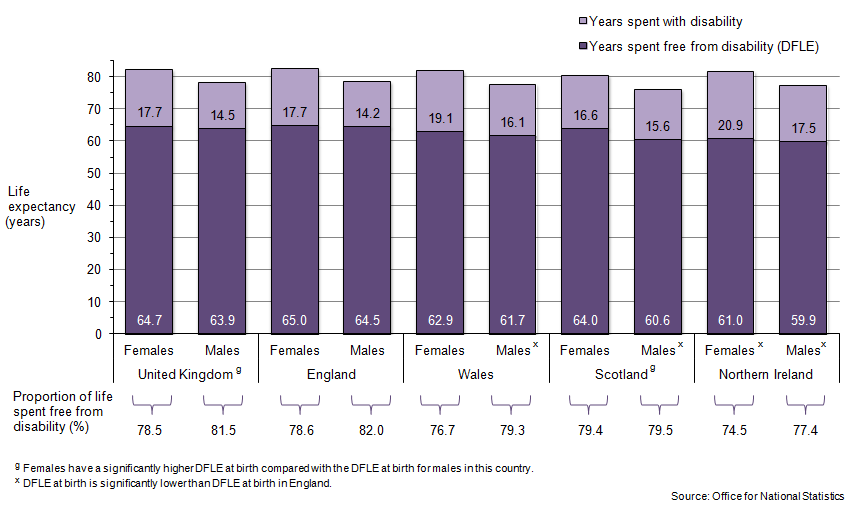
In the UK, females born in 2009–11 are estimated to live 64.7 years free from disability (78.5% of their life), and males are estimated to live 63.9 years free from disability (81.5% of their life). Figure 3 shows DFLE at birth and the proportion of life spent free from disability in the UK and its constituent countries.
DFLE at birth for females ranged from 61.0 years in Northern Ireland to 65.0 years in England, for males it ranged from 59.9 years in Northern Ireland to 64.5 years in England. Females at birth in England are estimated to spend 4.0 years more free from disability than in Northern Ireland. At birth, males in England are estimated to spend 4.6 years more free from disability than in Northern Ireland, 3.9 years more than in Scotland, and 2.8 years more than in Wales1.
In 2009–11, a newborn female in Scotland is estimated to live an extra 3.5 years free from disability compared with a newborn male. This gender difference in DFLE at birth is not only the largest but also the only significant gender difference within UK countries. The size of the gender inequality in Scotland contributes to the significant difference in DFLE at birth between females and males in the UK as a whole (despite it being relatively small at 0.8 years in the UK)2.
Notes for Disability-Free Life Expectancy (DFLE) at birth
Only significant differences between DFLE estimates in England and the comparison country are mentioned. 95% confidence intervals were used to assess the differences.
Only significant differences between the DFLE estimates of females and males are mentioned. 95% confidence intervals were used to assess the differences.
8. Disability-Free Life Expectancy (DFLE) at age 65
Figure 4 shows DFLE at age 65 and the proportion of life spent in ‘Good’ health in the UK and its constituent countries.
Figure 4: Disability-Free Life Expectancy (DFLE) at age 65, in 2009–11

Source: Office for National Statistics
Notes:
- General Lifestyle Survey used in Great Britain. Integrated Household Survey (2009) and Continuous Household Survey (2010 and 2011) for Northern Ireland.
Download this image Figure 4: Disability-Free Life Expectancy (DFLE) at age 65, in 2009–11
.png (45.1 kB) .xls (377.9 kB)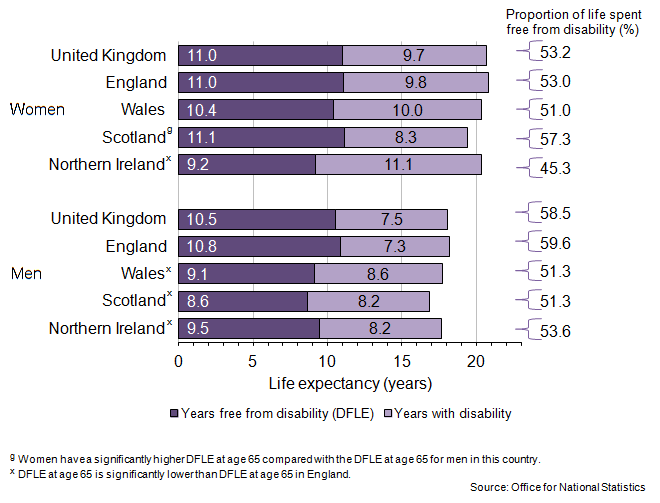
In the UK in 2009–11, women at age 65 are expected to live 11.0 years free from disability, and 9.7 years with a disability. Men at age 65 are estimated to live 10.5 years free from disability, and 7.5 years with a disability. Women and men in the UK are therefore expected to live over half their remaining lives at age 65 free from disability in 2009–11 (53.2% for women and 58.5% for men).
There were no significant differences in the number of years spent free from disability between men and women living in the UK as a whole. However, with a shorter life expectancy, men are spending fewer years and a smaller proportion of their lives with a disability than women in the UK (a 5.3 percentage point difference).
A 65 year old woman living in England in 2009–11 is expected to spend 1.8 years more free from disability than in Northern Ireland. However, this difference is not the largest; women at age 65 in Scotland live 1.9 years more free from disability than women in Northern Ireland1. At the same age, men in England are expected to live 1.4 years more free from disability than in Northern Ireland, 2.2 years more than in Scotland, and 1.8 years more than men in Wales2.
Scotland is the only country in the UK where a significant gender difference in DFLE at age 65 is found in 2009–2011. Women are estimated to live 2.5 years more free from disability compared with men. Scotland is also the only country where a man aged 65 is estimated to live less of his life (as a proportion) free from disability compared with a woman (with a difference of 6.0 percentage points). A possible reason for this is that, in Scotland at age 65, women are estimated to have the highest estimated DFLE and men the lowest DFLE in the UK3.
Notes for Disability-Free Life Expectancy (DFLE) at age 65
- It is noted that the DFLE at age 65 in Scotland is not significantly higher than the DFLE at age 65 in England.
- Only significant differences between DFLE estimates in England and the comparison country are mentioned. 95% confidence intervals were used to assess the differences.
- Significant differences between the DFLE estimates of men and women are mentioned only. 95% confidence intervals were used to assess the differences.
9. Changes in health expectancies over the decade
By comparing the health expectancy estimates in 2000–02 and 2009–11 changes in the health status of the population can be examined. Change in health expectancies over time might relate to the population living more, less, or an equal amount of years in an unfavourable health state. By looking at these changes conclusions can be made on whether the population’s health status over time has worsened (expansion in an unfavourable health state), has stayed relatively stable, or has improved (compression of an unfavourable health state).
The expansion or compression of an unfavourable health state can be assessed in absolute or relative terms. An expansion in absolute terms can be seen when life expectancy grows more quickly that the health expectancy, increasing the number of years in an unfavourable health state, while the converse is true for absolute compression. An expansion in relative terms can be seen when the proportion of life spent in a favourable health state decreases, whilst relative compression occurs when the proportion grows.
Back to table of contents10. What are the changes in Healthy-Life Expectancy (HLE) at birth over a decade?
Table 1 shows the change in HLE at birth for females and males in the four UK constituent countries between 2000–02 and 2009–11.
Table 1: Change in Healthy Life Expectancy (HLE) at birth between 2000-02 and 2009-11
| Change in HLE (years) | Change in life expectancy (years) | Change in the proportion of life spent in 'Good' health (%) | Change in the number of years spent in 'Not Good' health | |
| Females | ||||
| England* | 3.9 | 2.1 | 2.8 | -1.9 |
| Wales* | 3.7 | 1.9 | 2.8 | -1.8 |
| Scotland* | 3.2 | 1.8 | 2.2 | -1.4 |
| Northern Ireland | 0.8 | 1.7 | -0.6 | 0.9 |
| Males | ||||
| England* | 4.1 | 2.7 | 2.5 | -1.4 |
| Wales* | 8.1 | 2.4 | 8.1 | -5.7 |
| Scotland | 1.8 | 2.9 | -0.7 | 1.1 |
| Northern Ireland | -0.5 | 2.2 | -2.8 | 2.7 |
| Source: Office for National Statistics | ||||
| Notes: | ||||
| 1. * There is a significant difference in HLE at birth between 2000–2002 and 2009–2011. | ||||
| 2. General Lifestyle Survey used in Great Britain. Integrated Household Survey (2009) and Continuous Household Survey (2010 and 2011) for Northern Ireland. | ||||
Download this table Table 1: Change in Healthy Life Expectancy (HLE) at birth between 2000-02 and 2009-11
.xls (27.1 kB)England
In England, a newborn baby in 2009–11 is expected to live more years in ‘Good’ health than a baby born in 2000–02 (an increase of 3.9 years for females and 4.1 years for males). For every year gained in life expectancy between 2000–02 and 2009–11, HLE at birth has increased by 1.9 years for females, and 1.5 years for males. With the gains in HLE at birth between the two time periods being greater than the gains in life expectancy, there has been a decrease in the number of years spent in ‘Not Good’ health (1.9 years for females and 1.4 years for males). Furthermore, the proportion of life spent in ‘Good’ health at birth has increased, between 2000–02 and 2009–11, by 2.8 and 2.5 percentage points for females and males, respectively. Therefore these figures indicate that between 2000–02 and 2009–11 the general health in England has improved for females and males at birth, both in absolute and relative terms.
Wales
In Wales, females and males born in 2009–11 are also living more of their longer lives in ‘Good’ health compared with those born in 2000–02 (2.8 and 8.1 percentage points more). Within the decade, there were also decreases in the number of years spent in ‘Not Good’ health by 1.8 and 5.7 years for females and males, respectively. Like in England, it is indicated that the general health of the population in Wales has improved for both females and males at birth between 2000–02 and 2009–11, in absolute and relative terms.
It is also interesting to note that for males the increase between 2000–02 and 2009–11 is almost twice the size in Wales than in England. In 2000–02 there was a 5.4 year gap in HLE for males at birth living in England and Wales, but this gap has now closed and a newborn in Wales in 2009–11 is estimated to live a similar amount of years in ‘Good’ health as a newborn in England.
Scotland
In Scotland, the ten year change in health status at birth is different for females and males. For females at birth, general health status seems to have improved over the decade, with the proportion of life spent in ‘Good’ health increasing by 2.2 percentage points, and the number of years spent in ‘Not Good’ health decreasing by 1.4 years. These figures indicate both absolute and relative health improvements between 2000–02 and 2009–11 for females at birth in Scotland.
Over the decade the general health status has worsened for males living in Scotland; those born in 2009–11 are living 1.1 years more in ‘Not Good’ health than in 2000–02, and also live less of their life as a proportion in ‘Good’ health than in 2000–02. The improvement in general health for females and the worsening in general health for males has widened the gender gap in HLE from 2.4 years in 2000–02 to 3.8 years in 2009–11.
Northern Ireland
In Northern Ireland it is indicated that the general health of the population has worsened between 2000–02 and 2009–11. The number of years in ‘Not Good’ health increased by 0.9 years for females and 2.7 years for males at birth within the decade. Furthermore, the proportion of life spent in ‘Good’ health has decreased within the decade, indicating that females and males at birth in Northern Ireland are living less of their longer lives in a favourable health state in 2009–11 than in 2000–02. The figures in Northern Ireland are consistent with both absolute and relative health decline.
Back to table of contents11. What are the changes in Disability-Free Life Expectancy (DFLE) at birth over a decade?
Table 2 shows the changes in DFLE at birth between 2000–02 and 2009–11 for females and males in the four UK constituent countries.
Table 2: Change in Disability-Free life Expectancy (DFLE) at birth between 2000–02 and 2009–11
| Change in DFLE (years) | Change in Life expectancy (years) | Change in the proportion of life spent disability free (%) | Change in the number of years spent with a disability | |
| Females | ||||
| England* | 2.0 | 2.1 | 0.5 | 0.0 |
| Wales | 1.8 | 1.9 | 0.4 | 0.1 |
| Scotland | 1.4 | 1.8 | -0.1 | 0.4 |
| Northern Ireland | 1.3 | 1.7 | -0.0 | 0.4 |
| Males | ||||
| England* | 3.8 | 2.7 | 2.1 | -1.1 |
| Wales* | 4.0 | 2.4 | 2.8 | -1.6 |
| Scotland | 1.8 | 2.9 | -0.7 | 1.1 |
| Northern Ireland* | 2.0 | 2.2 | 0.4 | 0.2 |
| Source: Office for National Statistics | ||||
| Notes: | ||||
| 1. * There is a significant difference in DFLE at birth between 2000–2002 and 2009–2011. | ||||
| 2. General Lifestyle Survey used in Great Britain. Integrated Household Survey (2009) and Continuous Household Survey (2010 and 2011) for Northern Ireland. | ||||
Download this table Table 2: Change in Disability-Free life Expectancy (DFLE) at birth between 2000–02 and 2009–11
.xls (55.8 kB)England
Females in England born in 2009–11 are expected to live a similar number of years with a disability compared with those born in 2000–02. Yet females in 2009–11 are also estimated to live a slightly larger proportion of their lives free from disability than in 2000-02. The positive change in the proportion of life spent free from disability indicates a relative improvement in health status, despite the absolute number of years spent with a disability staying relatively stable between 2000–02 and 2009–11.
Males at birth in England are also living a greater proportion of their lives free from disability in 2009–11 than in 2000–02 (2.1 percentage points more). For each year gained in life expectancy between 2000–02 and 2009–11, there has been an increase of 1.4 years in DFLE at birth. With the gains in DFLE at birth being greater than the gains in life expectancy, there has been a decrease in the number of years spent with a disability for males (1.1 years in England). It is therefore indicated that the health status (in terms of disability) has improved for males at birth in England between 2000–02 and 2009–11 in absolute and relative terms.
Wales
Females in Wales born in 2009–11 are also expected to live a similar number of years with a disability compared with those born in 2000–02. Like in England, females at birth are estimated to live a slightly larger proportion of their life free from disability in 2009-11 compared with 2000–02. Relative improvements in health status are indicated with the gain in proportion of life spent free from disability, despite the absolute number of years spent with a disability staying relatively stable between 2000–02 and 2009–11.
Males in Wales are also living a greater proportion of their life free from a disability in 2009–11 than in 2000–02 (2.8 percentage points more). For each year gained in life expectancy between 2000–02 and 2009–11, there has been an increase of 1.7 years in DFLE at birth. With the gains in DFLE at birth between the two time periods being greater than the gains in life expectancy, the number of years spent with a disability has increased by 1.6 years. Therefore, in terms of years spent with a disability and the proportion of life spent free from disability, the health status has improved for males at birth between 2000–02 and 2009–11 in both absolute and relative terms.
Scotland
In Scotland the health status in terms of disability has worsened for males and females between 2000–02 and 2009–11. The number of years spent with a disability slightly increased by 0.4 years for females and 1.1 years for males within the decade. Furthermore, females and males in Scotland born in 2009–11 are expected to live slightly less of their life free from disability (as a proportion) compared with those born in 2000–02. For residents in Scotland, the figures are consistent with both an absolute and relative health decline between 2000–02 and 2009–11.
Northern Ireland
In Northern Ireland, between 2000–02 and 2009–11, the increase in DFLE at birth is slower than the increase in life expectancy; therefore there is a slight increase in years spent with a disability. Within the decade the proportion of life spent free from disability at birth has stayed relatively stable for females and has increased slightly for males. This suggests the health status in terms of disability in the Northern Ireland population in 2009–11 is stable in relative terms since 2000–02, but has worsened in absolute terms.
Back to table of contents12. What are the changes in health expectancies over a decade, at age 65 in the UK?
Table 3 shows the change in Healthy Life Expectancy (HLE) at age 65 between 2000–02 and 2009–11 in the UK, and Table 4 shows the change in Disability-Free Life Expectancy (DFLE) at age 65. Similar tables for all UK countries at age 65 are available in the reference tables provided.
Table 3: Changes in Healthy Life Expectancy (HLE) at age 65 between 2000–02 and 2009–11, in the UK
| HLE2 (years) | Lower confidence interval | Upper confidence interval | Life expectancy (years) | Proportion of life spent in 'Good' health (%) | Years spent in 'Not Good' health | |||
| Women | 2000-021 | 10.8 | 10.6 | 11.0 | 19.0 | 56.8 | 8.2 | |
| 2009-11 | 12.1 | * | 11.8 | 12.3 | 20.7 | 58.6 | 8.6 | |
| Change in estimate | 1.3 | -- | -- | 1.6 | 1.8 | 0.3 | ||
| Men | 2000-021 | 9.5 | 9.3 | 9.7 | 15.9 | 59.6 | 6.4 | |
| 2009-11 | 10.7 | * | 10.5 | 10.9 | 18.0 | 59.3 | 7.3 | |
| Change in estimate | 1.2 | -- | -- | 2.1 | -0.2 | 0.9 | ||
| Source: Office for National Statistics | ||||||||
| Notes: | ||||||||
| 1. Estimates for 2000–02 are simulations based on original survey data. | ||||||||
| 2. HLE based on five-point response general health question introduced in 2005–07. | ||||||||
| 3. *HLE is significantly higher in 2000–02 and 2009–11. Significance is based on the 95% confidence intervals provided. | ||||||||
| 4. General Lifestyle Survey used in Great Britain. Integrated Household Survey (2009) and Continuous Household Survey (2010 and 2011) for Northern Ireland. | ||||||||
Download this table Table 3: Changes in Healthy Life Expectancy (HLE) at age 65 between 2000–02 and 2009–11, in the UK
.xls (55.8 kB)In the UK, women at age 65 are living 1.3 years more in ‘Good’ health and 0.3 years more in ‘Not Good’ health in 2009–11 than in 2000–02. Men at age 65 are living 1.2 years more in ‘Good’ health and 0.9 years more in ‘Not Good’ health in 2009–11 than in 2000–02. The increase at age 65 in ‘Good’ health compared with the increase in ‘Not Good’ health is 4.3 times greater for women but only 1.3 times greater for men. Furthermore, between 2009–11 and 2000–02, the proportion of life spent in ‘Good’ health for women increased but decreased for men. Therefore, in the UK the general health at age 65 of women seems to have improved in relative terms but declined in absolute terms over the decade, but for men it has declined both in absolute and relative terms.
Table 4: Changes in Disability-Free Life Expectancy (DFLE) at age 65 between 2000–02 and 2009–11, in the UK
| DFLE (years) | Lower confidence interval | Upper confidence interval | Life expectancy (years) | Proportion of life spent disability free (%) | Years spent with a disability | |||
| Women | 2000-02 | 10.2 | 10.0 | 10.4 | 19.0 | 53.8 | 8.8 | |
| 2009-11 | 11.0 | * | 10.7 | 11.2 | 20.7 | 53.2 | 9.7 | |
| Change in estimate | 0.8 | -- | -- | 1.6 | -0.6 | 0.9 | ||
| Men | 2000-02 | 8.8 | 8.6 | 9.0 | 15.9 | 55.2 | 7.1 | |
| 2009-11 | 10.5 | * | 10.3 | 10.8 | 18.0 | 58.5 | 7.5 | |
| Change in estimate | 1.7 | -- | -- | 2.1 | 3.3 | 0.3 | ||
| Source: Office for National Statistics | ||||||||
| Notes: | ||||||||
| 1. * DFLE is significantly higher in 2000–02 and 2009–11. Significance is based on the 95% confidence intervals provided. | ||||||||
Download this table Table 4: Changes in Disability-Free Life Expectancy (DFLE) at age 65 between 2000–02 and 2009–11, in the UK
.xls (27.6 kB)In the UK, women at age 65 are living 0.8 years more free from disability and 0.9 years more with a disability in 2009–11 than in 2000–02. The increase in the number of years spent free from disability is less than the years spent with a disability for women, and the proportion of women’s lives spent disability-free has decreased. It is therefore suggested that the health status in terms of disability, for women at age 65, has worsened between 2000–02 and 2009–11 in both absolute and relative terms.
Men at age 65 are living 1.7 years more disability-free and 0.3 years more with a disability in 2009–11 than in 2000–02 in the UK. Men between 2000–02 and 2009–11 have experienced a small increase in the number of years spent with a disability, but the proportion of their lives spent disability-free has increased by 3.3 percentage points. This suggests that there have been improvements in health status (in terms of disability) in relative terms, but declines in health status in absolute terms for men at age 65 in the UK.
Back to table of contents13. Method
ONS produces two measures of health expectancy: Healthy Life Expectancy (HLE), defined as estimated years of life in ‘very good’ or ‘good’ general health; and Disability-Free Life Expectancy (DFLE), defined as estimated years of life free from a limiting persistent illness or disability.
UK health expectancies are calculated using the Sullivan method incorporating national period life expectancies (Jagger et al., 2007) . The prevalence rates of self-reported ‘Good’/‘Not Good’ general health or with/without a limiting persistent illness or disability are calculated by country, sex and five-year age band. The health prevalence data is collected by the General Lifestyle Survey (GLF) for England, Wales, and Scotland, and for Northern Ireland the Continuous Household Survey (CHS) is used for 2009 data and the Health Survey Northern Ireland (HSNI) for 2010–11 data.
The health prevalence data are combined with mortality data from interim life tables, national mid-year population estimates and an estimate of the health status of residents of medical and care communal establishments based on Census 2001 data. All figures are based on three-year rolling datasets that have been aggregated to ensure sufficiently large sample sizes for country comparisons.
More information about the methodology used to calculate UK health expectancies is available (ONS 2013).
Back to table of contents14. Comparability
Health expectancies are indicators of health status that take into account differences in the age structures of populations. Results are comparable by age, sex and between specified populations. Figures are published along with 95 per cent confidence intervals to allow the user to identify significant differences between populations. Statistical significance is assigned on the basis of non-overlapping confidence intervals.
Estimates of DFLE for Great Britain and England since 1981 and for the UK since 2000–02 are broadly comparable. Estimates of HLE for Great Britain and England between 1981 and 2005–07 and for the UK between 2000–02 and 2005–07 are also broadly comparable. From 2005–07, HLE was calculated using a European Union (EU) harmonised general health question to improve comparability across EU member states. A time series of synthetic HLE estimates for the UK between 2000–02 and 2004–06 based on the EU harmonised general health question is included in the reference tables.
It is important to remember that health expectancies for Wales, Scotland and Northern Ireland produced by the public health observatories in the specific countries are not directly comparable with ONS figures. This is due to differences in survey sources and the exclusion of the communal establishment population.
Back to table of contents