Table of contents
- Main points
- Stages of redistribution
- Summary of results for all households
- Longer-term trends in household income
- Retired households
- Non-retired households
- Longer-term trends in income inequality
- Policy context: Changes to taxes and benefits in 2013/14
- Economic context for 2013/14
- Background notes
- Methodology
1. Main points
Before taxes and benefits the richest fifth of households had an average income of £80,800 in 2013/14, 15 times greater than the poorest fifth who had an average income of £5,500
Overall, taxes and benefits lead to income being shared more equally between households. After all taxes and benefits are taken into account the ratio between the average incomes of the top and the bottom fifth of households (£60,000 and £15,500 per year respectively) is reduced to four-to-one
Cash benefits made up 57.2% of the gross income of the poorest fifth of households (£7,400), compared with 3.5% (£2,900) of the income of the richest fifth
The richest fifth of households paid £29,200 in taxes (direct and indirect) compared with £4,900 for the poorest fifth, though both groups paid a broadly similar proportion of their gross income (34.8% and 37.8% respectively)
Overall, 51.5% of households received more in benefits (including in-kind benefits such as education) than they paid in taxes in 2013/14. This is equivalent to 13.7 million households. This continues the downward trend seen since 2010/11 (53.5%) but remains above the proportions seen before the economic downturn
Overall levels of income inequality in 2013/14 were broadly unchanged on other recent years. However, inequality among retired households has increased, with the Gini coefficient for disposable income rising to 27.2%, up from 24.3% in 2009/10
The median disposable income of retired households was 7.3% (£1,400) higher in 2013/14 than in 2007/08, after accounting for inflation and household composition, compared with 5.5% (£1,600) lower for non-retired households
Overall median disposable income in 2013/14 was £24,500 – higher than in 2012/13, after accounting for inflation and household composition, but still below the level seen in 2007/08
2. Stages of redistribution
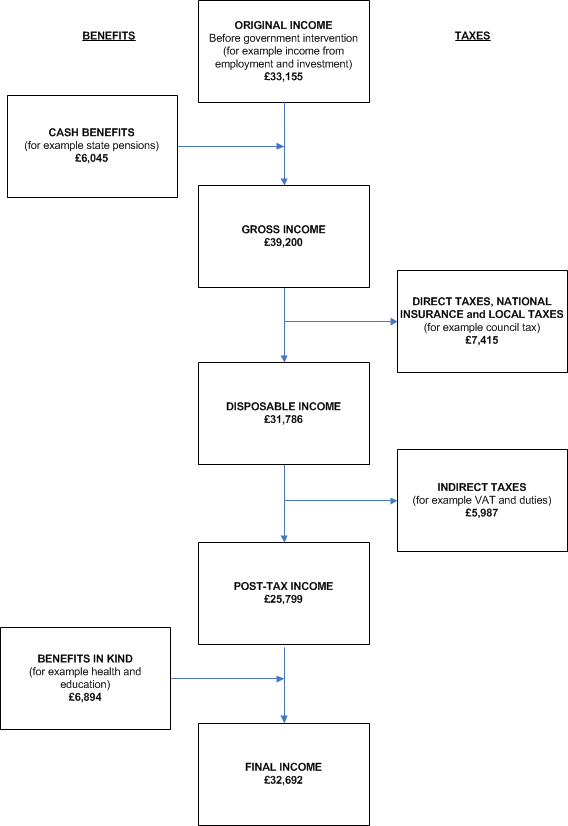
This release looks at how taxes and benefits affect the distribution of income and breaks this process into five stages. These are summarised below and in Diagram A:
Household members begin with income from employment, private pensions, investments and from other non-government sources. This is referred to as ‘original income’
Households then receive income from cash benefits. The sum of cash benefits and original income is referred to as ‘gross income’
Households then pay direct taxes. Direct taxes, when subtracted from gross income is referred to as ‘disposable income’
Indirect taxes are then paid via expenditure. Disposable income minus indirect taxes is referred to as ‘post-tax income’
Households finally receive a benefit from services (benefits in kind). Benefits in kind plus post-tax income is referred to as ‘final income’
Diagram A: Average household income, cash benefits and taxes, financial year ending 2014, UK

Download this image Diagram A: Average household income, cash benefits and taxes, financial year ending 2014, UK
.png (41.7 kB)3. Summary of results for all households
The overall impact of taxes and benefits are that they lead to income being shared more equally between households. In 2013/141, before taxes and benefits, the richest fifth (those in the top income quintile group) had an average original income of £80,800 per year, compared with an estimate of £5,500 for the poorest fifth – a ratio of 15 to 1. This ratio is broadly unchanged from 2012/13, indicating that inequality of original income has not changed substantially between the two years, according to this measure. Original income includes earnings, private pensions2 and investments.
Figure 1: Original income and final income by quintile groups for ALL households, financial year ending 2014
Source: Office for National Statistics
Notes:
- Households are ranked by their equivalised disposable incomes, using the modified-OECD scale
Download this chart Figure 1: Original income and final income by quintile groups for ALL households, financial year ending 2014
Image .csv .xlsImpact of cash benefits
In contrast to original income, the amount received from cash benefits such as tax credits, Housing Benefit and Employment & Support Allowance tends to be higher for poorer households than for richer households. The highest amount of cash benefits was received by households in the second quintile group, £8,400 per year compared with £7,400 for households in the bottom group. This is largely because more retired households are located in the second quintile group, compared with the bottom group, and in this analysis the state pension is classified as a cash benefit.
The distribution of cash benefits between richer and poorer households has the effect of reducing inequality of income. After cash benefits were taken into account, the richest fifth had an average income that was roughly six and a half times the poorest fifth (gross incomes of £83,800 per year compared with £12,900, respectively), a ratio that is unchanged on the previous year.
Changes to individual cash benefits between 2012/13 and 2013/14 and their impact on household incomes are discussed in the Changes to Taxes & Benefits section of this report.
Figure 2: Summary of the effects of taxes and benefits on ALL households by quintile groups, financial year ending 2014

Source: Office for National Statistics
Notes:
- Households are ranked by their equivalised disposable incomes, using the modified OECD scale
Impact of direct taxes
On average, households paid £7,400 per year in direct taxes, equivalent to 19% of their gross income. Richer households pay both higher amounts of direct tax and higher proportions of their income in direct taxes (Income Tax, National Insurance, and Council Tax and Northern Ireland rates). As a result, direct taxes also reduce inequality of income.
The richest fifth of households paid on average £19,700 per year in direct taxes, the vast majority of which was Income Tax. This corresponds to 24% of their gross income, broadly unchanged from other recent years.
The average direct tax bill for the poorest fifth was £1,300 per year, of which the largest component was Council Tax/rates. This was equivalent to 10% of gross household income for this group, unchanged from last year. The percentage of gross household income that the bottom quintile paid in Income Tax reduced slightly from 2.9% in 2012/13 to 2.5% in 2013/14, which may in part be due to an increase in the personal allowance from £8,105 to £9,440. However, the overall impact of this change will have been greater in the second quintile and above, reflecting the larger proportion of households with one or more people with taxable incomes above the previous personal allowance (see the Changes to Taxes and Benefits section of this report for further details).
The richest fifth of households had disposable incomes that were five and a half times that of the poorest fifth (£64,100 per year and £11,700, respectively), unchanged on 2012/13.
Impact of indirect taxes
The amount of indirect tax (such as Value Added Tax (VAT), and duties on alcohol and fuel) each household pays is determined by their expenditure rather than their income. The richest fifth of households paid just over two and a half times as much indirect tax as the poorest fifth (£9,500 and £3,600 per year, respectively). This reflects greater expenditure on goods and services subject to these taxes by higher income households. However, although richer households pay more in indirect taxes than poorer ones, they pay less as a proportion of their income. This means that indirect taxes increase inequality of income. In 2013/14, the richest fifth of households paid 15% of their disposable income in indirect taxes, while the bottom fifth of households paid the equivalent of 31% of their disposable income.
When expressed as a percentage of expenditure, the proportion paid in indirect tax declines less sharply as income rises compared with the level of indirect taxes paid as a proportion of household disposable income. The bottom fifth of households paid 21% of their expenditure in indirect taxes compared with 17% for the top fifth. The figure for the poorest fifth is an increase on last year, when the proportion was 19%, while the figure for the richest fifth is broadly unchanged.
When looking at the total proportion of income paid in taxes (both direct and indirect) there is less variation across the income distribution. Overall, 38% of the gross income of the poorest fifth of households was accounted for by direct and indirect taxes, while the richest fifth paid 35% of their income in taxes. Both are broadly unchanged from 2012/13. The lowest effective total tax rate was for the second poorest fifth of households, who paid 30% of their gross income in tax. After indirect taxes, the richest fifth had post-tax household incomes that were nearly seven times those of the poorest fifth (£54,600 compared with £8,000 per year, respectively). This ratio is unchanged on 2012/13.
Table 1: Taxes as a percentage of gross income, disposable income and expenditure for ALL households by quintile groups, financial year ending 2014
| Quintile groups of all households1 | All households | |||||
| Bottom | 2nd | 3rd | 4th | Top | ||
| (a) Percentages of gross income | ||||||
| Direct taxes | 10 | 11 | 16 | 19 | 24 | 19 |
| Indirect taxes | 28 | 19 | 18 | 15 | 11 | 15 |
| All taxes | 38 | 30 | 33 | 35 | 35 | 34 |
| (b) Percentages of disposable income | ||||||
| Indirect taxes | 31 | 22 | 21 | 19 | 15 | 19 |
| (c) Percentages of expenditure2 | ||||||
| Indirect taxes | 21 | 21 | 20 | 20 | 17 | 19 |
| Source: Office for National Statistics | ||||||
| Notes: | ||||||
| 1. Households are ranked by equivalised disposable income, using the modified-OECD scale. | ||||||
| 2. Calculated to be consistent with disposable income. See Methodology & Coherence section for the definition of expenditure. | ||||||
Download this table Table 1: Taxes as a percentage of gross income, disposable income and expenditure for ALL households by quintile groups, financial year ending 2014
.xls (55.8 kB)Impact of benefits in kind
This publication also considers the effect on household income of certain benefits received in kind. Benefits in kind are goods and services provided by the Government to households that are either free at the time of use or at subsidised prices, such as education and health services. These goods and services can be assigned a monetary value based on the cost to the Government which is then allocated as a benefit to individual households. The poorest fifth of households received the equivalent of £7,500 per year from all benefits in kind, compared with £5,500 received by the top fifth. This is partly due to households towards the bottom of the income distribution having, on average, a larger number of children in state education. After the impact of benefits in kind is taken into account, the ratio of the richest fifth of households’ final income to the poorest fifth’s is reduced to less than four-to-one (£60,000 per year and £15,500, respectively), a ratio that is unchanged on 2012/13.
Overall, 52% of households received more in benefits (including in-kind benefits such as education) than they paid in taxes (direct and indirect) in 2013/14, equivalent to 13.7 million households. This continues the downward trend seen since 2010/11 (53.5%) but remains above the proportions seen before the economic downturn.
Table 2: Summary of the effects of taxes and benefits on ALL households by quintile groups, financial year ending 2014
| Quintile group of ALL households1 | All households | Ratio top/bottom quintile | |||||
| Bottom | 2nd | 3rd | 4th | Top | |||
| Income, taxes and benefits per household (£ per year) | |||||||
| Original income | 5,521 | 13,731 | 24,842 | 40,880 | 80,803 | 33,155 | 14.6 |
| plus cash benefits | 7,394 | 8,413 | 6,775 | 4,695 | 2,947 | 6,045 | 0.4 |
| Gross income | 12,916 | 22,144 | 31,617 | 45,575 | 83,750 | 39,200 | 6.5 |
| less direct taxes2 and employees' NIC | 1,253 | 2,446 | 4,931 | 8,747 | 19,696 | 7,415 | 15.7 |
| Disposable income | 11,663 | 19,698 | 26,685 | 36,827 | 64,054 | 31,786 | 5.5 |
| less indirect taxes | 3,633 | 4,237 | 5,612 | 6,971 | 9,481 | 5,987 | 2.6 |
| Post-tax income | 8,030 | 15,461 | 21,073 | 29,856 | 54,573 | 25,799 | 6.8 |
| plus benefits in kind | 7,474 | 7,712 | 7,285 | 6,545 | 5,453 | 6,894 | 0.7 |
| Final income | 15,504 | 23,173 | 28,358 | 36,401 | 60,027 | 32,692 | 3.9 |
| Household type (%) | |||||||
| Retired | 36 | 37 | 30 | 19 | 11 | 27 | |
| Non-retired | 64 | 62 | 70 | 81 | 89 | 73 | |
| Source: Office for National Statistics | |||||||
| Notes: | |||||||
| 1 Households are ranked by equivalised disposable income, using the modified-OECD scale. | |||||||
| 2 These are: income tax (after deducting tax credits) and Council Tax/Northern Ireland rates (after deducting discounts, Council Tax reduction and rates rebates). | |||||||
Download this table Table 2: Summary of the effects of taxes and benefits on ALL households by quintile groups, financial year ending 2014
.xls (34.8 kB)Notes for Summary of results for all households
Throughout this release, 2013/14 refers to the financial year ending 2014. Similarly for other split years, e.g. 2012/13 refers to the financial year ending 2013, etc..
Private pensions include all non-state pensions whether occupational or personal
4. Longer-term trends in household income
The median household disposable income was £24,500 in 2013/14. After taking account of inflation1 and changes in household structures over time, the average disposable income was slightly over twice (2.02 times) as high in 2013/14 as in 1977, growing from £12,200 at an average rate of 2.0% per year over this period. Most of this growth in average incomes occurred during the late 1980s and late 1990s.
Over this same period, mean household income increased marginally more quickly than the median measure, growing at an average annual rate of 2.1% from £13,700 to £29,500. The faster growth of the mean measure was primarily due to incomes of high-income households growing at a faster rate than for households in the middle and lower parts of the income distribution between 1977 and 1990.
Figure 3 shows the growth of Gross Domestic Product (GDP) per person over the same timeframe. Growth in median household income closely mirrors growth in GDP per head for much of this time, rising during periods of economic growth and falling during or immediately after recessions.
Figure 3: Growth of median (and mean) household income and Gross Domestic Product (GDP) per person, 1977 to financial year ending 2014
 household income and Gross Domestic Product (GDP) per person, 1977 to financial year ending 2014")
Source: Office for National Statistics
Notes:
- On this figure, 1994/95 represents the financial year ending 1995, and similarly through to 2013/14, which represents the financial year ending 2014.
There has been a slight divergence between these two measures since the mid 1990s. Between 1995/96 and 2004/05, UK median household income grew at an average rate of 3.6% per year, faster than GDP per person, which grew at 2.6% per year. However, while GDP per person continued to grow at similar rates between 2004/05 and 2007/08, growth of median household income slowed to a fifth of its previous rate in the years immediately before the start of the economic downturn.
Both UK median household income and GDP per person have declined since the start of the economic downturn. In 2013/14, median disposable income was £500 (or 2.0%) lower than in 2007/08, while GDP per person in 2013/14 was 3.1% below its 2007/08 level. Most of the decrease in the value of the median disposable income occurred between 2009/10 and 2012/13, with median incomes in 2012/13 £1,200 (or 4.9%) lower in real terms than in 2009/10.
Incomes have not grown evenly across the income distribution since 1977. The average (mean) disposable income for the richest fifth of households in 2013/14 was over twice (2.39 times) as high as in 1977, after accounting for inflation and household composition. The average income of the poorest fifth of households has also grown over this time, but the rate of growth has been slower (1.77 times higher in 2013/14 than 1977).
Figure 4: Growth in mean equivalised household disposable income by quintile, 1977 to financial year ending 2014
Source: Office for National Statistics
Notes:
- On this figure, 1994/95 represents the financial year ending 1995, and similarly through to 2013/14, which represents the financial year ending 2014
Download this chart Figure 4: Growth in mean equivalised household disposable income by quintile, 1977 to financial year ending 2014
Image .csv .xlsThe level of change since 2007/08 has varied considerably across the income distribution. The largest fall in income over this period has been for the richest fifth of households, whose disposable income has fallen by £3,900 (or 6.2%) in real terms. This has been largely driven by a fall in average income from employment (including self-employment). The average income of the middle fifth of households in 2013/14 was £400 (or 1.6%) lower than in 2007/08, after adjustments for inflation and household composition.
By contrast, the average disposable income for the poorest fifth of households rose by 3.1% over the same period, equivalent to £350 per household. This is mainly due to an increase in the average income from employment for this group, along with an increase in the average amount received in certain cash benefits such as tax credits and Jobseekers’ Allowance.
The increase in average income from employment is associated with the changing make-up of this group since 2007/08. While the proportion of households in the bottom fifth whose ‘chief economic supporter’ is either in employment or unemployed has increased, the proportion whose ‘chief economic supporter’ is retired has fallen. This reflects an ongoing pattern of retired households moving up the overall income distribution, due to their incomes growing at a faster rate than those of non-retired households (see Incomes of Retired Households, 1977-2010/11 for further details and analysis).
Notes for Longer-term trends in household income
- Prices have been deflated using an implied expenditure deflator for the household sector
5. Retired households
Retired households are those where the income of retired household members accounts for the majority of the total household gross income (see the background note for the definition of a retired person). Retired households have different income and expenditure patterns to their non-retired counterparts.
Retired households are much more likely to be towards the bottom of the income distribution than at the top of the distribution. Whereas retired households made up 36% and 37% of the bottom and second quintile groups respectively, they only made up 11% of the richest fifth in 2013/14. However, the relative position of retired households has improved over time. For example, ten years previously (2003/04), retired households made up 40% of the bottom fifth and 8% of the top fifth of the income distribution.
Among retired households, there is a higher degree of income inequality before taxes and benefits than for non-retired households. One way of looking at income inequality is to see what proportion of the income of all retired households is received by the richest fifth. In 2013/14, the richest fifth of retired households received 56% of total original income for all retired households. In comparison, the richest fifth of non-retired households received 46% of total income for that group.
Another widely used measure of inequality in the distribution of household income is the Gini coefficient. Gini coefficients can vary between 0 and 100 and the lower the value, the more equally household income is distributed. In 2013/14, the Gini coefficient for original income was 59% for retired households, compared with 44% for non-retired households.
In 2013/14, retired households received an average of £9,500 from private pensions/annuities, a real terms increase of 9% from 2012/13 when the average was £8,800 and an increase of 26% since 2007/08 (£7,500). The increases in income from private pensions/annuities were largest in the top three fifths of the income distribution. The increases were driven by rises in both the amounts received and the number of households reporting receipts from private pensions/annuities. As a result of this rise, on average, 42% of the gross income of retired households now comes from private pensions/annuities, up from 36% in 2007/08.
Taxes and benefits have a particularly significant redistributive effect on the income of retired households, meaning that disposable income inequality is much lower for retired households than for non-retired households. Cash benefits play by far the largest part in bringing about this reduction, due principally to the state retirement pension. Retired households’ Gini coefficient for disposable income was 27% in 2013/14, compared with 33% for non-retired households. The corresponding coefficients for 2012/13 were 27% and 34%, respectively.
As highlighted in the section on Changes to Taxes and Benefits in 2013/14, the State Pension rose by 2.5% in April 2013, above the rate of Consumer Prices Index (CPI) inflation. Along with increases in income from private pensions/annuities, this rise contributed to the average equivalised disposable income for retired households rising by £300 between 2012/13 and 2013/14 after accounting for inflation.
Compared with 2007/08, in 2013/14 the median disposable income for retired households was 7.3% (£1,400) higher in real terms, compared with 5.5% (£1,600) lower for non-retired households.
On average, the poorest fifth of retired households received £7,700 per year from cash benefits in 2013/14. Those in the other quintile groups received, on average, between £10,600 and £12,200 per year. Cash benefits represent half (48%) of retired households’ total gross income on average, a proportion which is higher for poorer households and lower for richer households (78% for the poorest fifth of retired households and 26% for the richest fifth). Of the total value of retired households’ cash benefits, just over four-fifths (81%) was due to the State Pension, on average.
Retired households derive significantly higher benefits from the National Health Service (NHS) than non-retired households, on average. The benefit in kind from the NHS is spread fairly evenly across the income range of retired households and in 2013/14 it was worth an average of £5,900 per year, per household. The benefit derived from the NHS makes up 96% of the total benefit in kind received by retired households, on average. This is in comparison to £3,500 (50%) for non-retired households.
Table 3: Summary of the effects of taxes and benefits on RETIRED households by quintile groups, financial year ending 2014
| Quintile group of RETIRED households1 | All retired households | Ratio top/bottom quintile | |||||
| Bottom | 2nd | 3rd | 4th | Top | |||
| Original income | 2,149 | 3,697 | 6,541 | 13,194 | 33,031 | 11,722 | 15 |
| plus cash benefits | 7,668 | 10,644 | 12,212 | 12,127 | 11,504 | 10,831 | 2 |
| Gross income | 9,818 | 14,340 | 18,752 | 25,321 | 44,535 | 22,553 | 5 |
| less direct taxes2 and employees' NIC | 1,074 | 1,114 | 1,649 | 2,916 | 6,734 | 2,698 | 6 |
| Disposable income | 8,744 | 13,226 | 17,103 | 22,405 | 37,801 | 19,856 | 4 |
| less indirect taxes | 2,581 | 3,143 | 3,336 | 4,669 | 6,702 | 4,086 | 3 |
| Post-tax income | 6,162 | 10,083 | 13,767 | 17,736 | 31,099 | 15,770 | 5 |
| plus benefits in kind | 5,690 | 5,751 | 6,276 | 6,596 | 6,477 | 6,158 | 1 |
| Final income | 11,852 | 15,834 | 20,043 | 24,332 | 37,576 | 21,928 | 3 |
| Cash benefits as a percentage of gross income | 78 | 74 | 65 | 48 | 26 | 48 | |
| State Pension as a percentage of cash benefits | 83 | 78 | 76 | 80 | 87 | 81 | |
| Source: Office for National Statistics | |||||||
| Notes: | |||||||
| 1. Households are ranked by equivalised disposable income, using the modified-OECD scale. | |||||||
| 2. These are: income tax (after deducting tax credits) and Council Tax/Northern Ireland rates (after deducting discounts, Council Tax reduction and rates rebates). | |||||||
Download this table Table 3: Summary of the effects of taxes and benefits on RETIRED households by quintile groups, financial year ending 2014
.xls (71.7 kB)The extent to which retired households are major beneficiaries from redistribution through the tax and benefit system can be further seen by comparing average incomes of the top and bottom fifths of retired households. Before taxes and benefits, the richest fifth of retired households had an average total original income of £33,000 per year. This is over 15 times that of the poorest fifth (£2,100 per year). The richest fifth of retired households had an average disposable income of £37,800 per year in 2013/14, over four times that of the poorest fifth (£8,700 per year). After all taxes and benefits, the ratio between the top and bottom fifths was further reduced to around three-to-one (final incomes of £37,600 and £11,900 per year, respectively), unchanged on the ratio for the two previous years.
Back to table of contents6. Non-retired households
Taxes and benefits also lead to income being shared more equally between non-retired households, though the effect is smaller than for retired households. Before taxes and benefits, there is less inequality of non-retired households’ income than for retired households. After the process of redistribution, however, inequality of post-tax income (as measured, for example, by the Gini coefficient) is greater than that for retired households. In 2013/14 the Gini coefficient for post-tax income was 37% for non-retired households compared with 31% for retired households. The equivalent Gini for non-retired households was 38% in 2012/13. This means that, according to post-tax income, inequality has decreased slightly since 2012/13 for non-retired households, though it remains around the same level seen the previous year (2011/12).
In 2013/14, the average original income for non-retired households was £41,000 per year. As might be expected, the original income of non-retired households showed a relatively strong relationship to the number of people in employment they contained. Additionally, the increase in employment between 2012/13 and 2013/14 of approximately 420,000 (according to Labour Force Survey estimates), means that average earnings per household has increased at a faster rate than individual earnings over this period. This has contributed to a 0.8% increase in average original income between 2012/13 and 2013/14 after accounting for inflation.
Despite this, the average original income for non-retired households was £4,000 (or 9.7%) lower in 2013/14 than before the economic downturn (2007/08), largely reflecting a fall in income from employment (including self-employment). The poorest fifth of households is the only group for which average original income was not below 2007/08 levels, after accounting for inflation.
Cash benefits provided 46% of gross income for non-retired households in the bottom fifth, falling to 2% for non-retired households in the top fifth. Their payment results in a reduction in income inequality. The patterns for direct and indirect taxes are similar to those described for all households.
Table 4: Summary of the effects of taxes and benefits on NON-RETIRED households by quintile groups, financial year ending 2014
| Quintile group of non-retired households1 | All non-retired households | Ratio top/bottom quintile | ||||||
| Bottom | 2nd | 3rd | 4th | Top | ||||
| Original income | 8,258 | 21,456 | 34,383 | 50,700 | 90,016 | 40,962 | 11 | |
| plus cash benefits | 6,938 | 6,113 | 3,785 | 2,776 | 1,895 | 4,302 | 0 | |
| Gross income | 15,196 | 27,570 | 38,167 | 53,476 | 91,911 | 45,264 | 6 | |
| less direct taxes2 and employees' NIC | 1,488 | 3,671 | 6,950 | 11,127 | 22,427 | 9,133 | 15 | |
| Disposable income | 13,708 | 23,899 | 31,217 | 42,349 | 69,484 | 36,131 | 5 | |
| less indirect taxes | 4,205 | 5,071 | 6,445 | 7,933 | 9,741 | 6,679 | 2 | |
| Post-tax income | 9,502 | 18,828 | 24,771 | 34,416 | 59,742 | 29,452 | 6 | |
| plus benefits in kind | 8,609 | 8,662 | 6,772 | 6,561 | 5,204 | 7,162 | 1 | |
| Final income | 18,111 | 27,491 | 31,543 | 40,977 | 64,946 | 36,614 | 4 | |
| Average number of individuals per household | ||||||||
| Children3 | 1 | 1 | 1 | 1 | 0 | 1 | ||
| Adults | 2 | 2 | 2 | 2 | 2 | 2 | ||
| Men | 1 | 1 | 1 | 1 | 1 | 1 | ||
| Women | 1 | 1 | 1 | 1 | 1 | 1 | ||
| People | 3 | 3 | 3 | 3 | 2 | 3 | ||
| People in full-time education | 1 | 1 | 1 | 1 | 0 | 1 | ||
| Economically active people | 1 | 2 | 2 | 2 | 2 | 2 | ||
| Retired people | 0 | 0 | 0 | 0 | 0 | 0 | ||
| Source: Office for National Statistics | ||||||||
| Notes: | ||||||||
| 1. Households are ranked by equivalised disposable income, using the modified-OECD scale. | ||||||||
| 2. These are: income tax (after deducting tax credits) and Council Tax/Northern Ireland rates (after deducting discounts, Council Tax reduction and rates rebates). | ||||||||
| 3. Children are defined as people aged under 16 or aged between 16 and 19, not married nor in a Civil Partnership, nor living with a partner; and living with parent(s)/guardian(s); and receiving non-advanced further education or in unwaged-government training. | ||||||||
Download this table Table 4: Summary of the effects of taxes and benefits on NON-RETIRED households by quintile groups, financial year ending 2014
.xls (73.7 kB)Of those benefits in kind for which a value can be assigned to households, the largest two categories for non-retired households are education and health. The poorest fifth of non-retired households received one of the highest values from benefits in kind, on average £8,600 per year in 2013/14, though this is lower than that received by the next poorest fifth which received almost £8,700 per year. This reflects the highest average number of children per household in the second quintile group of the income distribution.
Back to table of contents7. Longer-term trends in income inequality
Analysis of these data over time shows that, overall, income inequality, as measured by the Gini coefficient, increased considerably during the 1980s, but since then the changes have been smaller in scale.
As described above, the Gini coefficient is a measure of income inequality. Gini coefficients can vary between 0 and 100 and the lower the value, the more equally household income is distributed.
Looking at the results for all households, the 1980s were characterised by a large increase in inequality of disposable income, particularly during the second half of that decade. Following that rise, inequality of disposable income reduced slowly from 1990 until the mid-1990s, although it did not fully reverse the rise seen in the previous decade. In the late 1990s, income inequality rose slightly before falling once again in the early 2000s.
In recent years the trend has been broadly flat. The Gini coefficient for disposable income in 2013/14 was 32.4%, a slight decrease from its 2012/13 value of 33.3%, but in line with the longer term trend.
Figure 5: Gini coefficients, 1977 to financial year ending 2014
Source: Office for National Statistics
Notes:
- On this figure, 1994/95 represents the financial year ending 1995, and similarly through to 2013/14, which represents the financial year ending 2014
Download this chart Figure 5: Gini coefficients, 1977 to financial year ending 2014
Image .csv .xlsInequality of disposable income for retired households has followed a similar trend, increasing significantly during the 1980s and peaking at 30.3% in 1991. Since then the broad trend has been downwards, though income inequality levels remain above those seen in the late 1970s and early 1980s. In recent years, there is evidence of a slight increase in inequality for retired households. In 2013/14, the Gini coefficient for disposable income amongst retired households was 27.2%, up from 24.3% in 2009/10.
Another commonly used measure of income inequality is the income quintile share ratio or the S80/S20 ratio. This is the ratio of the mean equivalised disposable income of the top fifth of the population to that of the bottom fifth of the population. The higher the ratio, the higher the level of income inequality. As expected, the pattern of change over time is similar to that seen with the Gini coefficient.
Figure 6: S80/S20 ratio 1977 to financial year ending 2014
Source: Office for National Statistics
Notes:
- On this figure, 1994/95 represents the financial year ending 1995, and similarly through to 2013/14, which represents the financial year ending 2014
Download this chart Figure 6: S80/S20 ratio 1977 to financial year ending 2014
Image .csv .xls8. Policy context: Changes to taxes and benefits in 2013/14
This section provides information and analysis on some of the main changes to taxes and benefits in 2013/14.
Child and working tax credits
The basic element of working tax credit was frozen for the third year running at £1,920 a year. The family element of child tax credit was also frozen at £545 a year, while the child element rose by £30 (around 1%) to £2,690.
Another change is that the disregard for in-year rises in income was reduced to £5,000 from £10,000. This is the threshold at which an increase in income will alter the amount of tax credits someone is awarded at the beginning of each tax year. The reduction in the income rise disregard means that someone whose income has increased on the previous year is more likely to experience a fall in their tax credits.
Personal Independence Payment
Disability Living Allowance (DLA) was replaced with a new benefit called Personal Independence Payment (PIP) for adults aged under 65 in England, Wales & Scotland.
Eligibility for PIP is assessed using different criteria than for DLA. This assessment will include a review of an individual’s ability to participate fully in society rather than the severity of impairment. PIP also involves continuing assessment of claimants’ needs.
New claimants were assessed for PIP in a small number of areas from April 2013 and from June 2013 elsewhere. From October 2013, existing DLA claimants started to be assessed for PIP and the roll out is expected to be completed in 2017.
Between 2012/13 and 2013/14 there has been a real 7% decrease in the average amount of DLA/PIP received by households, driven by a fall in the number of people receiving these benefits.
The majority of households where someone is receiving DLA or PIP are towards the middle of the income distribution, particularly the middle fifth. This is often because disability related benefits make an important contribution to the incomes of those households. However, this should be treated with some caution as existing equivalisation scales do not take into account the additional needs of those receiving such benefits.
Housing benefit
From April 2013, households in England, Scotland and Wales deemed to be under-occupying socially rented accommodation had their Housing Benefit reduced.
This change involved a 14% reduction in the eligible rent used to calculate Housing Benefit if the accommodation is under occupied by one bedroom and a 25% reduction for under occupation by two or more bedrooms. This brought the social rented sector in line with the private sector, for which size criteria were already applied.
There were also changes relating to Local Housing Allowance (LHA), which is used to work out Housing Benefit for tenants who rent privately. Previously (since April 2011) LHA rates have been set to the 30th percentile (50th percentile from April 2008) of non-LHA rents in the relevant Broad Rental Market Area (and the number of bedrooms that the family is deemed to need). In April 2013 LHA rates were increased in line with either the September 2012 Consumer Price Index (CPI) or the 30th percentile of local rents, whichever was lower. This means that in 2013/14, in many areas, the value of LHA fell relative to local rents.
Child benefit
The freeze on the rates of Child Benefit, which started on 6 April 2011, continued into 2013/14.
In April 2013 a cap was introduced to the total amount of benefits people aged 16 to 64 can receive in England, Scotland and Wales. This cap was gradually introduced across Local Authorities, until nationally implemented by August 2013.
The cap is set at:
£500 a week for couples (with or without children living with them)
£500 a week for single parents whose children live with them
£350 a week for single adults who do not have children, or whose children do not live with them
The cap applies to the total amount that the people in a household receive from a range of benefits including Housing Benefit, Income Support, Incapacity Benefit, Child Benefit, Child Tax Credit and Carers Allowance.
Households that qualify for Working Tax Credit, or received any of a number of benefits including Disability Living Allowance of Personal Independence Payment are not affected by the cap.
Universal credit
The roll out of Universal Credit began in 2013/14 in certain areas of Manchester and Cheshire, as well as Hammersmsith and Inverness.
When fully rolled out, Universal Credit will replace the following six means tested benefits and Tax Credits with a single integrated benefit for working age people:
Income Support
Income-based Jobseeker's Allowance (JSA)
Income-based Employment and Support Allowance (ESA)
Housing Benefit
Working Tax Credit
Child Tax Credit
In the pilot areas, eligibility was limited to single jobseekers. The relatively limited scope of the pilot in 2013/14 means that the impact of Universal Credit on the ETB data was negligible. As Universal Credit is rolled out more widely it is anticipated that its impact on ETB data will be more evident.
Income tax
Age related personal allowances started to be phased out in 2013/14, with personal allowances based on people’s date of birth rather than age. This meant that age-related allowances were restricted to existing beneficiaries.
The personal allowance for those born after 5 April 1948 (under 65 at beginning of tax year) increased from £8,105 to £9,440. By contrast, the personal allowances for those aged 65-74 and 75+ at the start of 2013/14 remained at £10,500 and £10,660 respectively.
In addition, there was a real terms reduction in the starting level for the higher rate band, from £34,371 to £32,011. Combined with the personal allowance, this meant that people paid the higher rate of 40% on any taxable income above £41,450, down from £42,475 in 2012/13.
The increase in the personal allowance for under 65s had a relatively small impact on the bottom fifth of households due to the smaller proportion of people with taxable incomes over the previous personal allowance of £8,105, in that group. Also, in higher quintiles, there are more households with two or more people with taxable incomes meaning that more than one person in the house will potentially be affected by the increased allowance. The decrease in the threshold for higher rate Income Tax contributed to higher income individuals receiving a smaller benefit from this change, relative to the size of their income.
The additional rate of income tax, paid on taxable incomes above £150,000 was reduced from 50% to 45%.
Council Tax
In 2013/14, 61% of eligible local authorities in England made use of a Council Tax freeze grant. This meant that the average Council Tax bill for a band D dwelling increased by just 0.8% on 2012/13 rates.
Council Tax levels were frozen in all local authorities in Scotland. However, in Wales, the average band D Council Tax increased by 3.2% compared with 2012/13. There was also a 2.7% increase in domestic rates in Northern Ireland.
As Council Tax is regressive, with the bottom quintile paying the largest amount as a proportion of their gross income, it will be households in this group that have benefitted most in relative terms from any freeze. However, the absolute savings will be higher at the top of the income distribution.
Council Tax reduction
Council Tax Benefit was abolished in April 2013 across England, Wales and Scotland, and replaced with a localised system of support for working age people on low incomes. Local authorities are now responsible for running their own Council Tax reduction schemes, also known as Council Tax Support. In addition, the funding made available by the Government for this purpose was reduced by 10%.
The Welsh Government and Scottish Government agreed with their local authorities that people receiving support with their Council Tax would not receive less than they would have done if claiming Council Tax Benefit. However, in England the level of support provided to households may vary across different parts of the country.
It is households in the bottom fifth of the income distribution who receive the most in Council Tax Reduction (and rates rebates in Northern Ireland). The average amount received by this group fell from £343 in 2012/13 to £304 in 2013/14 (both figures in 2013/14 prices).
Alcohol and tobacco duties
The 2013 Budget saw the end of the beer duty escalator. Beer duty was instead cut by 2%, a reduction in duty of 1p per pint. Duties for other forms of alcoholic drink continued to rise by RPI inflation plus 2%, equating to a 5.3% increase. This added approximately 10p to a bottle of wine and 39p to a bottle of whisky.
The duty rate on tobacco products also increased by RPI plus 2%. This increased the price of 20 cigarettes by approximately 26p and a packet of 5 small cigars by 9 pence.
Machine Games Duty
Machine Games Duty (MGD) is a tax on some games machines and, from February 2013, replaced Amusement Machine License Duty (AMLD) as well as the VAT charged on the income from these machines. The criteria for whether a games machine is liable for MGD is different from that for AMLD, as are the rates at which duty is paid.
MGD is an intermediate tax, which means that we assume a proportion of the duty paid by the business is passed on to the consumer, or in this case, the person who gambles on these machines, in the form of reduced odds.
Back to table of contents9. Economic context for 2013/14
Over the 12 months from April 2013 to March 2014, the UK economy saw an increase in real output of 2.7%. By the end of the period, the UK had recorded five quarters of consecutive economic growth, confirming a return towards the long-run trend. Aggregate GDP surpassed its largely symbolic pre-downturn peak in Q3 2013, and while GDP per capita remained below its pre-downturn level, it increased by 1.5% over the year.
The strength of the UK economy over this period was reflected in developments in the labour market, as the demand for labour responded to the robust growth of output. In the three months to March 2014, the headline employment rate increased to 72.5%, its highest level since 2008, with the number of people in employment at a record high. Over the same period, the inactivity rate – the proportion of the population who are neither in work nor looking for work – fell to its lowest level on record. The unemployment rate, which fell by just 0.4 percentage points in the financial year ending 2013, fell by a further 1.0 percentage points in the year to Q1 2014 to reach 6.8%.
While the labour market experienced significant tightening, wage growth during this period remained relatively weak. In the three months ending March 2014, regular earnings were just 1.3% higher than in the same period a year earlier. Weak growth in the services sector (1.0%), and business and finance (-0.6%) in particular, dragged this average rate down. While this rate remained well below the pre-downturn trend, it marked a 0.5 percentage point increase in nominal pay growth from the same period in 2013.


