Table of contents
1. Main points
- In 2014, 38 million adults (76%) in Great Britain accessed the Internet every day, 21 million more than in 2006, when directly comparable records began
- Access to the Internet using a mobile phone more than doubled between 2010 and 2014, from 24% to 58%
- In 2014, 74% of all adults bought goods or services online, up from 53% in 2008. Clothes (49%) were the most popular online purchase in 2014
- Of all adults in Great Britain, 67% are aware of Internet storage space services, but the take up of these services to store data is much lower at 35%
- In Great Britain, 22 million households (84%) had Internet access in 2014, up from 57% in 2006
- Fixed broadband Internet connections were used by 91% of households
2. Summary
The Internet has changed the way people go about their daily lives. Over three quarters of adults in Great Britain used the Internet every day (76%) in 2014, with almost 7 out of every 10 adults (68%) using a mobile phone, portable computer and/or handheld device to access the Internet 'on the go'.
Young adults lead the way across all categories of Internet use. Those aged 16 to 24 used the Internet more than other age groups for recreational activities such as social networking (91%) and playing or downloading games (68%). Adults aged 25 to 34 used the Internet more than other age groups to carry out a wide range of established ‘every day’ activities, such as purchasing goods or services online (90%), Internet banking (71%) and selling goods or services online (36%).
The results are derived from the Opinions and Lifestyle Survey. ONS first collected statistics on Internet access in 1998. Since then, a number of changes have been made to the Internet access survey, as well as the publication of annual results since 2006. Where possible, comparisons over time are made in this release. However, the available coverage for time series comparisons varies, as survey questions vary each year.
Back to table of contents3. Your views matter
We are constantly aiming to improve this release and its associated commentary. We would welcome any feedback you might have and would be particularly interested in knowing how you make use of these data to inform your work. Please contact us via email: esociety@ons.gov.uk or telephone Cecil Prescott on +44 (0)1633 456767.
The ONS has also launched a public consultation on the future publication of statistics to measure the digital economy to ensure these statistics continue to meet user needs. The consultation will close on 30 October. As part of this consultation ONS are seeking user views on the future of the Internet Access Quarterly Update statistical bulletin. Until recently this was a quarterly bulletin, which is now due to become an annual release. The full consultation document can be found on the ONS Consultation pages.
To respond to this consultation please complete the online questionnaire or send the questionnaire in Annex A of the consultation document to: esociety@ons.gov.uk
Back to table of contents4. Computer and Internet use
On 14 May 2014, as part of the Internet Access Quarterly Update, ONS reported that 43.5 million people in Great Britain had ever used the Internet, representing approximately 87% of the adult population.
Use of a computer is inextricably linked to the ability of an individual to use the Internet. Both computer and Internet use have increased over time as shown in Figures 1 and 2. In 2014, 73% of adults in Great Britain used a computer every day, up from 45% in 2006 (see Figure 1). Increases in daily computer usage between 2006 and 2014 were seen for all age groups, with the largest relative increase being for those aged 65 and over. In 2006, of those aged 65 and over, just 9% reported that they used a computer every day, compared with 42% in 2014.
Figure 1: Daily computer use by age group, 2006 and 2014
Source: Office for National Statistics
Download this chart Figure 1: Daily computer use by age group, 2006 and 2014
Image .csv .xls5. Frequency of Internet use
In 2014, 38 million adults in Great Britain used the Internet every day, or almost every day. This represented 76% of those aged 16 and over and was more than double the number of adults (16 million; 35% of adults) that used the Internet daily in 2006 when directly comparable records began (see Figure 2). Daily Internet use has increased by 2 million since 2013.
Figure 2: Daily Internet use, 2006 to 2014
Source: Office for National Statistics
Download this chart Figure 2: Daily Internet use, 2006 to 2014
Image .csv .xls6. Internet activities
Email is an immediate and often free way to stay in contact, supported by the ability to access email accounts on mobile Internet devices “on the go”. The use of email remains the most common activity undertaken on the Internet by adults in Great Britain in 2014, with 75% of adults having used the Internet for this purpose, up from 57% in 2007.
Finding information about goods and services was the second most common Internet activity in 2014, undertaken by almost three quarters of all adults (73%), up from 58% in 2007.
Less than one in ten adults (6%) participated in more technical activities of creating websites or blogs on the Internet; remaining unchanged from 2012. The fact that websites are constantly being created and bloggers are regularly updating their blog.com or wordpress.com accounts (amongst others) shows that while usage is low, those that do undertake this type of activity tend to use the facility on a regular basis.
All activities surveyed between 2007 and 2014 have seen an increase in usage, with Internet use for reading or downloading newspapers and magazines showing the largest rise. Over half of all adults (55%) used the Internet to read or download the news, newspapers or magazines in 2014, compared with only 20% of adults in 2007 (see Figure 3). With reports of decreased physical newspaper readership, there has been media interest in how people will access the news in the future.
Figure 3: Internet activities, 2007 and 2014
Source: Source: Office for National Statistics
Download this chart Figure 3: Internet activities, 2007 and 2014
Image .csv .xlsThe level of several of the Internet activities surveyed between 2013 and 2014 has stabilised. However, some categories have shown a small rise such as finding information about goods and services at 66% in 2013, compared with 73% in 2014 and Internet banking, which was 50% in 2013 increasing to 53% in 2014.
There are distinct differences in how individuals make use of the Internet when analysed by age. As ‘early-adopters’, it is of little surprise that those adults in the two youngest age groups (16 to 24 and 25 to 34) are proportionately the largest users of many of the Internet activities surveyed.
In 2014, adults aged 16 to 24 were most likely to engage in online activities that focused on leisure or recreation, especially newer activities such as social networking (91%) (see Figure 4) and playing or downloading games (68%).
Adults aged 25 to 34 reported the highest level of use in some of the activities surveyed, in particular day-to-day activities such as sending emails (86%, along with the 35 to 44 age group) and reading or downloading online news, newspapers or magazines (73%). This trend is particularly evident when considering online banking where almost three quarters (71%) of those aged 25 to 34 accessed their bank accounts over the Internet. This compares to just over half of all adults (53%) who used Internet banking.
The use of the Internet to carry out certain activities has been developing significantly amongst older age groups. The proportion of adults aged 45 to 54 using the Internet for finding information about goods and services, increased from 74% in 2013 to 84% in 2014. Internet banking activity in the same age group rose from 50% to 62% over the same period. For adults aged 55 to 64 the use of social networking rose from 29% in 2013 to 37% in 2014.
Social networking has been one of the major success stories of the Internet age. In 2014, over half (54%) of all adults participated in social networking, up from 45% in 2011. Almost all adults aged 16 to 24 (91%) used social networks in 2014, but it is important to note that its use is not solely confined to the youngest age groups. Around 37% of adults aged 55 to 64 and 13% of those aged 65 and over participated in social networking in 2014.
The Internet is a resource for new services such as Google Play, iTunes, and streaming services such as Netflix and Lovefilm. It has never been easier to watch a film online, listen to the latest album releases or download games to mobiles, tablets, desktops or consoles. There has been significant growth, in the last seven years, in adults playing or downloading films, music, games or images online. In 2007, only 24% of adults carried out such activities; this had almost doubled by 2014, with 44% of adults playing or downloading films, music, games or images online. While participation in this activity was most popular for adults aged 16 to 24 (with 68% of this age group participating in this activity), those in the 25-34 (61%) and 35-44 (58%) age groups also reported high rates of this activity.
Making an appointment with a doctor or other health practitioner is the only activity where participation increases across the age groups (with the exception of those aged 65 and over). Around 8% of those in the 16 to 24 and 25 to 34 age groups made an appointment with a doctor or other health practitioner through the Internet in 2014 compared with 15% of those in the 55-64 age group. This is likely to be a result of those in the older age groups being more likely to need to seek medical advice or visit surgeries more frequently.
Figure 4: Internet activities by age, 2014
Source: Office for National Statistics
Download this chart Figure 4: Internet activities by age, 2014
Image .csv .xls7. Internet shopping
In 2014, one in seven shops currently stand vacant on the high street according to the BBC. As regular stories appear in the media reporting the decline of the high street, it is interesting to note that almost three quarters (74%) of all adults reported buying goods or services online. This has risen from 53% in 2008. While younger age groups have traditionally embraced Internet shopping (90% of 25 to 34 year olds), there has been significant growth in the rate of online purchasing by those aged over 65. Two in every five adults (40%) aged 65 and over bought online in 2014; more than double the 2008 estimate of 16%.
‘Clothes’ were the most popular online purchase in 2014, bought by 49% of all adults. Those aged 25 to 34 were most likely to buy these items (64%) (see Figure 5). In 2014, over half of all women (52%) bought clothes online, compared with 46% of men. ‘Household goods (for example, furniture, toys etc)’ were the next most popular items purchased online across all adults at 42% in 2014. The 25-34 age group were most likely to buy these items (59%). For ‘travel arrangements’ 37% of all adults purchased online instead of purchasing via high street travel agents and the like. Those aged 35 to 44 purchased this type of product the most out of all age groups (47%).
There is a noticeable difference in the type of goods bought online, when analysed by age. In 2014, only 18% of those aged 16 to 24 bought food and groceries online, compared with 38% of those aged 25 to 34 (see Figure 5). Only 28% of those aged 16 to 24 bought households goods (for example, furniture, toys etc) compared with 59% of those aged 25 to 34.
The main payment method for purchases over the Internet was via credit or debit card at 87%, followed by prepay card or prepay account details over the Internet (40%).
Figure 5: Purchases made over the Internet by age group, 2014

Source: Office for National Statistics
Download this image Figure 5: Purchases made over the Internet by age group, 2014
.png (146.4 kB) .xls (20.0 kB)
8. Mobile Internet
In October 2012, the UK’s first 4G network was launched, offering faster mobile broadband than the existing 2G and 3G networks previously provided. In 2014, the areas covered by 4G services are expanding steadily. Recent developments have not been limited to mobile broadband, with the availability of wireless (wi-fi) hotspots increasing at a rapid rate. Leading companies provide thousands of hotspots across the country. These are now regularly available at locations such as pubs, cafes and hotels. The availability of both mobile broadband and wi-fi networks means that mobile Internet is now used by more people than ever before.
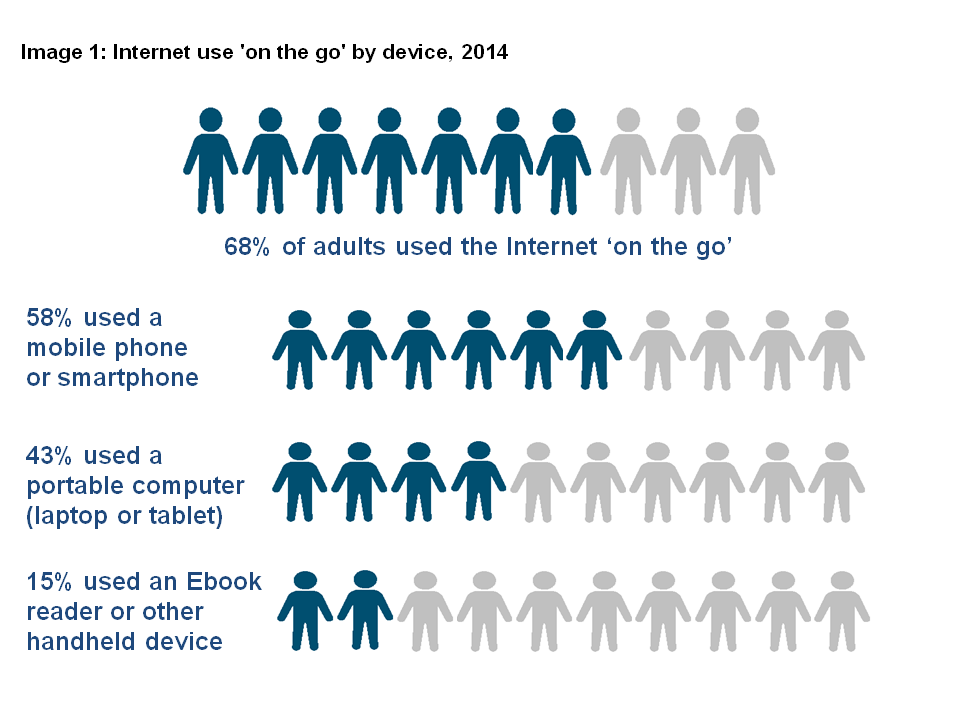
In 2014, almost 7 in 10 adults (68%) had used devices such as mobile phones, portable computers (tablet or laptop) or other hand held devices to access the mobile Internet, away from home or work in the last 3 months (see Image 1). Almost all those aged 16 to 24 (96%) had used a mobile phone or portable device to access the Internet “on the go”, compared with only 23% of those aged 65 and over.
The most popular device used to access the Internet ‘on the go’ was a mobile phone, with over half of all adults (58%) accessing the Internet this way. This has more than doubled since the 2010 estimate of 24%.
Almost 9 in 10 (87%) adults aged 16 to 24 used their mobile phone to access the Internet. However, this type of access is not solely limited to the early-adopting younger age groups, with 6 in 10 (62%) of those aged 45 to 54 accessing the mobile Internet on their mobile phone.
Image 1: Internet use 'on the go' by device, 2014
Download this image Image 1: Internet use 'on the go' by device, 2014
.png (54.2 kB)
“On the go” usage of portable computers (laptop or tablet) has shown an increased uptake from 32% of all adults in 2013 to 43% in 2014. Increased usage of portable computers was seen across all age groups, however, the level of usage remains highest for those adults aged 16 to 24 with 59% of adults in this age group having used a portable computer in 2014, compared with 17% of those aged 65 and over. Affordable prices of tablets, convenience and user friendly interfaces are likely to have contributed to their success and the rise in year on year estimates of this activity.
Over one fifth (22%) of both 16 to 24 and 35 to 44 year olds reported using a device such as a games console or eBook reader to access the Internet away from home or work. Increases in this type of access were seen across all age groups between 2013 and 2014, however, increases were largest for those aged 35 to 44 (8 percentage points) and in the 25-34 and 55-64 age groups (5 percentage points), showing that other handheld Internet devices are being used by more than just the younger generation.
Back to table of contents10. Internet storage space
Internet storage space, known as cloud computing, has grown and become more common place on the Internet landscape in the last few years with services such as iCloud, Dropbox and Google Drive available for free. Of all adults in 2014, 67% were aware of cloud services to store or share information and data. The two youngest age groups (16-24 and 25-34) had the highest proportion of awareness at 81% for both.
Only 35% of all adults had used cloud storage space over the Internet to save files, comparatively lower than those aware of the service (see Image 2). Adults aged 16 to 44 were most likely to have used storage space service over the Internet to save files.
Image 2: Awareness of Internet storage services and use of storage and file sharing services, 2014

Download this image Image 2: Awareness of Internet storage services and use of storage and file sharing services, 2014
.png (56.6 kB)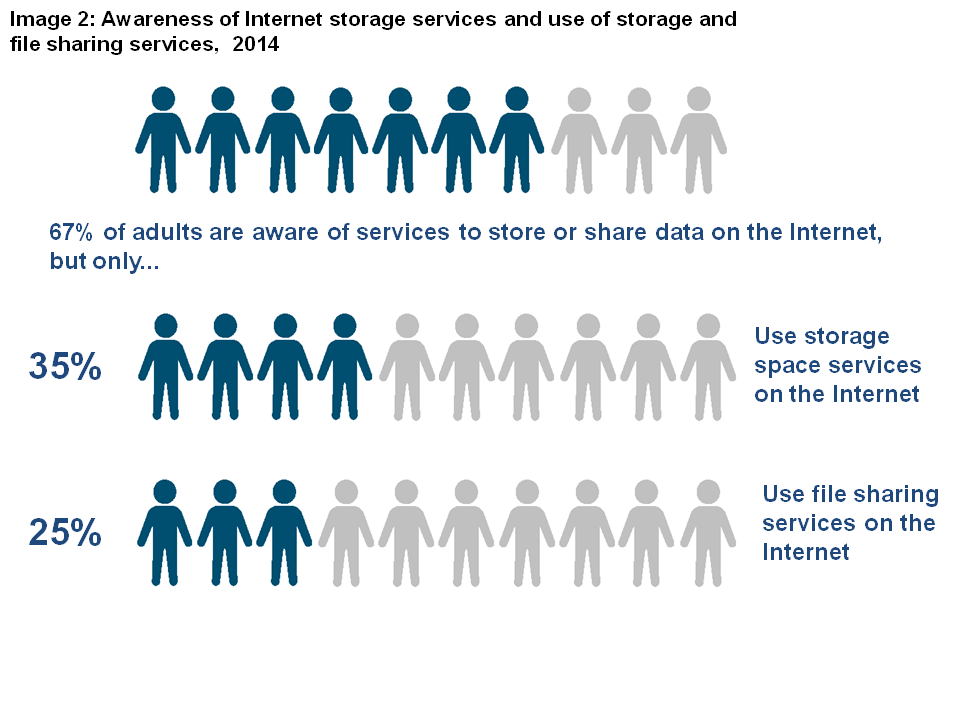
The main method of file sharing in 2014, used by 52% of all adults, was email with attached files. Of all adults, those who used email to share files the most were the two youngest age groups, aged 16 to 24 (71%) and 25 to 34 (70%); they were also the age groups most likely to share files via personal websites or social networking sites with 65% and 57% respectively, compared with 35% for all adults.
According to the data in this release the most valuable types of files worth saving or storing on Internet storage space (for those who used Internet storage services) were photographs (84%), texts, spreadsheets or electronic presentations (50%) and music (43%).
For all users of Internet storage space, the main reasons for saving or storing their data were to protect against data loss (55%), accessibility of files from several devices or locations (51%) and for an easy way to share files with others (51%).
Back to table of contents11. Household Internet access
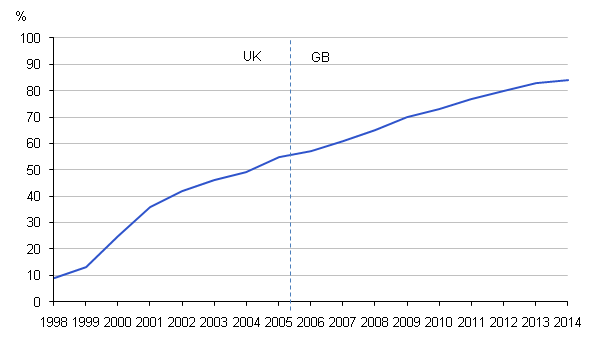
In 2014, 22 million households in Great Britain had an Internet connection. This represented 84% of households, up from 83% in 2013 and 57% in 2006 (see Figure 8).
There were 4 million households in Great Britain without Internet access in 2014, compared with 10 million in 2006. Figure 6 clearly shows that Internet access by households has increased dramatically since ONS first began collecting these statistics in 1998.
There were changes in the survey source, periodicity and coverage over the period 1998 to 2005; consequently these estimates (from 1998 to 2005) are not directly comparable with the annual estimates from 2006 onwards, but have been provided as our best indication of growth over this period.
Figure 6: Households with Internet access, 1998 to 2014
Source: Office for National Statistics
Notes:
- UK estimates from 1998 to 2004, Great Britain estimates from 2005 to 2014..
Download this image Figure 6: Households with Internet access, 1998 to 2014
.png (11.6 kB) .xls (20.0 kB)
Internet access varies depending on household composition. The majority of households with children have an Internet connection (96%). This is the same figure as households made up of two or more adults (including homes of multiple occupancies such as student accommodation).
Access to the Internet by single adult households varies considerably depending on age. For households with one adult aged 65 or over, only 41% of households had an Internet connection. In contrast, almost double the proportion (80%) of households had an Internet connection where there was only one adult aged 16 to 64 years.
The way households connect to the Internet has changed considerably in recent years. In 2006, 31% of household Internet connections were dial-up connections over a standard telephone line. Seven years on and dial-up Internet has almost entirely disappeared from the Great Britain Internet map, with 1% of households still connecting this way. Therefore, for the vast majority of households (91%) with an Internet connection had a fixed broadband connection in 2014.
Back to table of contents12. Reasons for no household Internet access
Of the 4 million households without Internet access, the majority (53%) said that they didn’t have a connection because they 'did not need it'. This is compared with 34% in 2006. While this may suggest that many households without the Internet are actively choosing not to subscribe, there is still a large and important minority who state that barriers prevent them from connecting to the Internet. Of households with no Internet access, 32% indicated that this was due to a lack of skills. Further barriers included equipment costs and access costs being high at 12% and 11% of households without Internet access respectively.
Back to table of contents