Table of contents
- Main points
- Background
- Quality of care
- Dignity and respect
- Relief of pain
- Preferences and choice at the end of life
- Support for relatives, friends or carers at the end of life
- Response rates and NHS Area Team samples
- Guidance on interpreting results
- Clinical Commissioning Group analysis
- Uses and users of end of life care statistics
- Next publication
- Further information
- Acknowledgements
- References
- Background notes
- Methodology
1. Main points
There are no significant changes between results presented in the 2011 to 2012 NHS Area Team bulletin and the 2012 to 2013 NHS Area Team bulletin
For overall quality of care, there were 4 NHS Area Teams significantly higher than the national average and 4 significantly lower
Of people dying in their preferred place, the proportions vary significantly by cause of death. In Essex, 12% of people who died in their preferred place died of cardiovascular disease compared to other causes. In Durham, Darlington and Tees, 64% of people who died in their preferred place died of cancer, compared to other causes
On average, women are significantly more likely to die in their preferred place than men
Quality of care rated as “excellent” is highest for hospices (77%) and lowest for out of hours services (26%)
2. Background
The National Survey of Bereaved People (VOICES) collects information on bereaved peoples’ views on the quality of care provided to a friend or relative in the last 3 months of life, in England. The survey has now been run for 3 years and was commissioned by the Department of Health in 2011 and 2012 and by NHS England from 2013. It has been administered by the Office for National Statistics (ONS) each year.
The End of Life Care Strategy published by the Department of Health in July 2008 set out a commitment to promote high quality care for all adults at the end of life and stated that outcomes of end of life care would be monitored through surveys of bereaved relatives (Department of Health, 2008). Following criticisms of the Liverpool Care Pathway, research into patient and carer experience at the end of life remains high on the policy agenda (NHS England, 2013a).
This statistical bulletin reports on the combined results of the second and third National Surveys of Bereaved People, to facilitate the presentation of results for individual NHS Area Teams. These are the middle layer of health geography for England, with 4 NHS Regions being the highest, and 211 Clinical Commissioning Groups (CCGs) being the lowest.
The aim of this bulletin is not to identify “best” or “worst” NHS Area Teams, but to provide an overview of the geographical spread of care quality. For example, some aspects of care may vary widely geographically and others may show little geographic variability. To help interpretation, mean results are presented alongside the percentage point difference between the highest and lowest scoring areas. The percentage point difference can show where there is little geographic variability between NHS Area Teams (where the percentage point difference is small) and where there is wide variability (where the percentage point difference is great). This will help to inform where local or national policies are having an impact, or could be targeted. Further information on interpreting the results is available in the “Guidance on interpreting results” section.
National findings by individual year can be seen in the bulletins “National Bereavement Survey, 2011, “National Bereavement Survey, 2012 ” and “National Survey of Bereaved People, 2013”.
Back to table of contents3. Quality of care
Overall quality of care
Overall quality of care provided in the last 3 months is a question answered by the majority of respondents. The overall quality of care question, which reflects on all services received, is rated on a 5 point scale, from “outstanding” to “poor”. The majority of people responded that the care provided to the deceased was “excellent”. To aid interpretation, “outstanding” and “excellent” were combined at the top of the scale, and “fair” and “poor” at the bottom. Figure 1 presents results for each NHS Area Team for ratings of “outstanding or excellent” and “fair or poor”. Responses for “good” are not presented.
For England, 43% of people rated care as “outstanding or excellent”, compared to 23% who rated it as “fair or poor”. Across all NHS Area Teams there were greater proportions of “outstanding or excellent” scores than “fair or poor”, with less than one third of respondents rating care as “fair or poor” within any area.
Figure 1 shows the areas receiving the highest to lowest proportion of “outstanding or excellent” ratings and was also represented in the 2011 to 2012 NHS Area Team bulletin. The order of areas in the figure has changed slightly, but there are no significant changes in the performance of individual areas within this time period, that is, no area is performing significantly better or worse in 2012 to 2013 than they were in 2011 to 2012. This is influenced by each dataset containing the same 2012 data and a lack of measurable changes in practice during each annual period.
In comparison to the national average, “Devon, Cornwall and the Isles of Scilly” NHS Area Team has achieved the highest “outstanding or excellent” rating at 52%. “Cumbria, Northumberland, Tyne and Wear” and “Wessex” NHS Area Teams are also significantly higher, with “outstanding or excellent” ratings of 49% and 48% respectively. “Bath, Gloucestershire, Swindon and Wiltshire” have also risen above the national average, with a 1.6% (non-significant) increase to 49% “outstanding or excellent” rating (this represents a 0.1% significant difference to the national average).
“London” and “Essex” NHS Area Teams remain significantly lower than average on ratings of “outstanding or excellent” (36% and 38% respectively), and have the highest proportions of “fair or poor” results (31% and 26% respectively). Most notably “London” displays a small (1%) decrease in the proportion of “outstanding or excellent” ratings in the 2012 to 2013 data, compared to 2011 to 2012 data. “London” also shows a small (1%) increase in “fair or poor” ratings in this period. While this change over time is not significant, the 2012 to 2013 difference between those rating care as “outstanding or excellent” (36%) and those rating care as fair or poor (31%) is now similar and only just significantly different.
Figure 1: Overall quality of care rated as “Outstanding or Excellent” or “Fair or Poor”, by NHS Area Team: England, 2012 to 2013
NHS Area Team, England

Source: Office for National Statistics
Notes:
- Question 51 asks 'Overall, taking all services into account, how would you rate the quality of care in the last three months?' The five response options, "Outstanding", "Excellent"," Good", "Fair" and "Poor"'. "Outstanding and Excellent" and "Fair and Poor" have been combined due to the majority of responses being given as "Excellent". "Good" is not presented.
- NHS Area Teams are ordered with the highest average 'Outstanding or Excellent' score at the top of the figure.
- Whisker plots indicate confidence intervals.
Download this image Figure 1: Overall quality of care rated as “Outstanding or Excellent” or “Fair or Poor”, by NHS Area Team: England, 2012 to 2013
.png (45.4 kB) .xls (56.3 kB)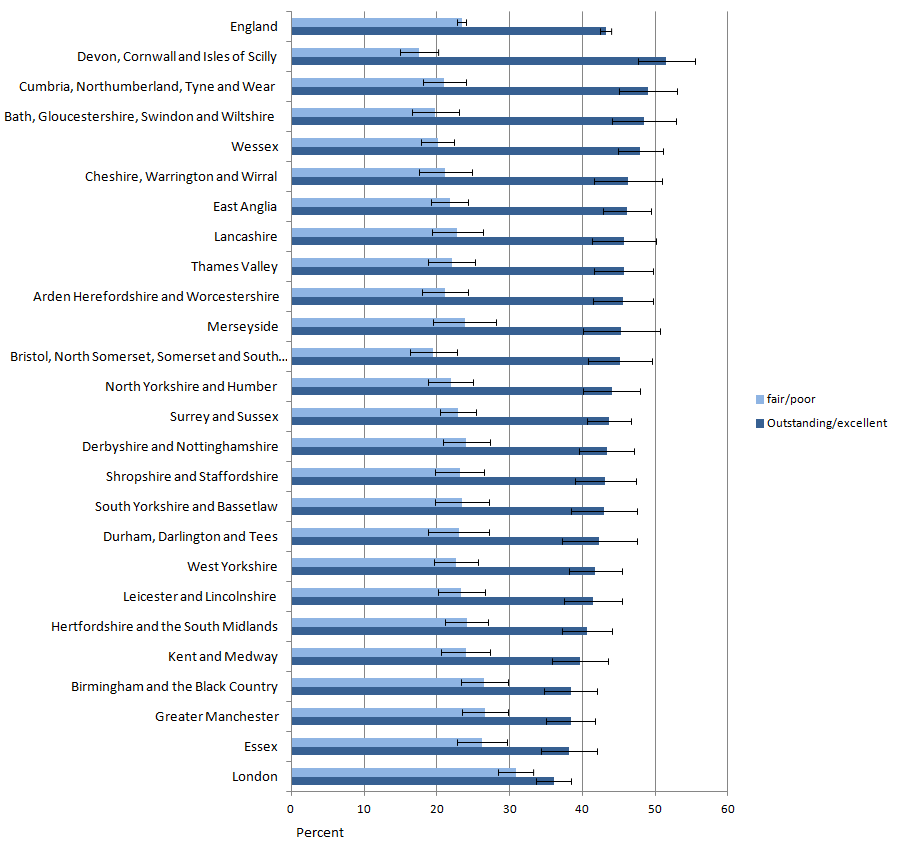
In addition to “London” and “Essex”, 2 more NHS Area Teams, “Greater Manchester” and “Birmingham and the Black Country” have also fallen significantly below the national average in 2012 to 2013. While the majority of NHS Area Teams do not differ significantly, the areas significantly above average fall in the south west and north of the country, while the areas significantly below average commonly correspond to areas of high population density, like London, Manchester and Birmingham. Previous research on VOICES data has shown a link between deprivation and overall quality of care (ONS, 2013) and further research could usefully investigate a link between urban and rural areas and quality of care.
Quality of care in different settings
In addition to an overall measure of quality of care, quality of care was also assessed across 7 different settings. These are: out of hours, district and community nurses, general practitioners (GPs), care homes, hospital doctors, hospital nurses and hospices. Quality of care by setting is measured as “excellent”, “good”, “fair” or “poor”. Table 1 shows the proportion of responses of “excellent” across each setting, with the lowest and highest proportion of “excellent” scores for each area. Geographic variability between NHS Area Teams is illustrated by the number of percentage points difference between the highest and lowest scoring areas; a low figure shows little variability, while a high figure shows quality of care varies widely in that setting.
Table 1: Quality of care across all settings rated as "excellent"
| NHS Area Teams, England, 2012-2013 | |||||
| Weighted % | |||||
| Setting | Number of question responses | Mean % | Lowest % | Highest % | Variability between Area Teams (% point difference) |
| Care homes | 15,224 | 46.2 | 40.2 | 52.8 | 12.6 |
| District and community nurses | 20,221 | 44.8 | 31.2 | 53.5 | 22.2 |
| GPs | 33,799 | 33.6 | 25.1 | 41.3 | 16.3 |
| Hospices | 4,765 | 77.4 | 71.6 | 85.1 | 13.4 |
| Hospital doctors | 26,622 | 39.5 | 35.5 | 47.4 | 11.9 |
| Hospital nurses | 28,633 | 38.1 | 33.4 | 46.0 | 12.6 |
| Out of hours | 20,245 | 25.8 | 19.9 | 32.0 | 12.1 |
| Source: Office for National Statistics | |||||
| Notes: | |||||
| 1. The sample size for hospices is significantly smaller than for other settings due to fewer people experiencing hospice care. | |||||
Download this table Table 1: Quality of care across all settings rated as "excellent"
.xls (28.2 kB)Table 1 shows that in out of hours services, at least 1 in 4 people rate the care provided to the deceased as “excellent”, although this is lower than any other setting. The quality of care is rated as “excellent” significantly more in hospices than in any other care setting (77%). Comparing 2012 to 2013 results with 2011 to 2012 shows a narrowing of variability between Area Teams for hospices from 18 percentage points to 13. In 2011 to 2012 the lowest percentage of “excellent” ratings in any area was 68%, rising to 72% in 2012 to 2013, while the highest proportion of “excellent” ratings remained stable at 85% in both time points. Despite this, there were no significant changes in the performance of hospices in any area between years. This is partly due to the smaller number of respondents who rated care provided by hospices, leading to wider confidence intervals.
Almost half (45%) of respondents rated the care that district and community nurses provide as “excellent” in 2012 to 2013, although this varies across NHS Area Teams by 22 percentage points with 11 areas differing significantly from the national average. The disparities between areas has widened from 19 percentage points in 2011 to 2012 to 22 percentage points in 2012 to 2013. There is a reduction from 34% to 31% in the lowest performing area, although no areas differed significantly in performance between each time point. Care homes are also rated as providing “excellent” care by almost half of respondents (46%), but there is less variability across NHS Area Teams than for district and community nurses.
Care provided by out of hours services has the lowest proportion of people rating it as “excellent” quality (26%), while care provided within hospitals is relatively consistent between doctors and nurses (12 and 13 percentage points difference respectively). However, quality of care from hospital doctors has 7 NHS Area Teams differing significantly from the national average, while for hospital nurses, only 4 areas are significantly different.
The results show that different care settings vary in terms of their quality of care. Table 1 suggests that high care provision, high duration settings such as in hospices and care homes provide better quality of care than the low care provision, low duration services offered by out of hours services. Despite this, evidence shows that the link between health care quality and cost is inconsistent (that is, more expensive care is not necessarily better quality), with little known about what types of spending improves quality (Hussey et al., 2013).
Back to table of contents4. Dignity and respect
Another aspect of care was whether the respondent thought staff treated the patient with dignity and respect. This was assessed across 7 different care settings: district and community nurses, GPs, care homes, hospital doctors and hospital nurses and hospice doctors and hospice nurses.
Table 2 shows that reports of the patient “always” being treated with dignity and respect vary across all settings with only half of hospital nurses (51%) “always” treating patients with dignity and respect. In contrast, most hospice doctors (86%) and nurses (84%) “always” treat patients with dignity and respect.
Dignity and respect from nurses in hospital is significantly lower than from doctors in hospitals (51% and 59% respectively). In 2011 to 2012 this disparity was also found between hospice nurses and hospice doctors. However in 2012 to 2013, a 3% increase in the dignity and respect “always” shown by hospice nurses has led to the difference between doctors and nurses in hospitals no longer being significant. This echoes the finding that dignity and respect shown by nurses nationally is improving (ONS, 2014b). The variability between areas has also fallen for hospice nurses, from 17 percentage points in 2011 to 2012 to 15 percentage points in 2012 to 2013. This is driven by small non-significant changes across areas, rather than large improvements within any particular area.
Dignity and respect from district and community nurses varies across NHS Area Teams more than in any other setting (17 percentage points). Hospital doctors and nurses show a similar level of consistency across NHS Area Teams (both 11 percentage points). There are 4 NHS Area Teams that differ significantly from the national average for respect shown from hospital nurses, and 5 that differ significantly for respect shown by hospital doctors.
Respect from district and community nurses and GPs is rated more highly than in hospitals with 78% of district and community nurses and 72% of GPs “always” showing dignity and respect. There is 1 NHS Area Team significantly below the national average in dignity and respect provided by community nurses and 4 above average. There are 6 NHS Area Teams above average in the dignity and respect provided by GPs, while 5 areas are below the national average.
Care homes show the lowest proportion of variability between NHS Area Teams for dignity and respect (12 percentage points) compared with other settings. There are 3 NHS Area Teams that differ significantly from the national average.
There have been no significant changes proportions of areas always treating patients with dignity and respect between 2011 to 2012 and 2012 to 2013.
Table 2: Responses of "Always" treated with dignity and respect, by setting
| NHS Area Teams, England, 2012-2013 | |||||
| Weighted % | |||||
| Setting | Number of question responses | Mean % always | Lowest % always | Highest % always | Variability between Area Teams (% point difference) |
| Care homes | 15,097 | 62.8 | 57.4 | 68.9 | 11.6 |
| District and community nurses | 20,092 | 78.3 | 65.8 | 82.8 | 16.9 |
| GP | 32,995 | 71.7 | 63.1 | 78.5 | 15.5 |
| Hospice doctors | 4,176 | 85.8 | 77.5 | 91.6 | 14.1 |
| Hospice nurses | 4,458 | 83.8 | 76.1 | 90.8 | 14.7 |
| Hospital doctors | 25,752 | 58.6 | 54.3 | 65.7 | 11.4 |
| Hospital nurses | 28,208 | 51.2 | 46.3 | 57.2 | 10.8 |
| Source: Office for National Statistics | |||||
| Notes: | |||||
| 1. The sample size for hospices is significantly smaller than for other settings due to fewer people experiencing hospice care. | |||||
Download this table Table 2: Responses of "Always" treated with dignity and respect, by setting
.xls (28.2 kB)5. Relief of pain
How well the patient’s pain was managed during the last 3 months of life was assessed in 4 settings: at home, in care homes, in hospitals and in hospices. Table 3 shows that pain was reported to be controlled “completely, all of the time” most commonly in hospices (63%) and least for patients at home (18%). This significantly lower level of pain control for people at home is consistent across NHS Area Teams, with only a 6 percentage point difference between the highest and lowest scoring areas and only 2 areas differing significantly from the national average. Pain that is managed “completely, all of the time” at home is between 16% and 22% of cases in each NHS Area Team, compared to effective pain control in more than half (49% to 70%) of cases in hospices. Despite the broader variability in pain relief provided by hospices, only 1 NHS Area Team differs significantly from the national average, this is likely to be due to the smaller sample size.
The data shows that relief of pain is managed more effectively in care homes than in hospitals. In almost half of cases (46%) pain is managed “completely, all of the time” in care homes compared to 39% in hospitals. This may seem surprising given the onsite support available in hospitals, but is consistent across all NHS Area Teams, with only a 9 percentage point variation between the highest and lowest. It is possible that this difference in pain control between settings reflects the ethos of different care providers; hospitals being primarily for treatment and rehabilitation, while hospices and care homes provide long term and palliative care. Different training and professional focus may affect the care provided in different settings.
There were no significant changes in the relief of pain when comparing results from 2011 to 2012, and 2012 to 2013.
Table 3: Responses of pain managed "Completely, all the time" by setting
| NHS Area Teams, England, 2012-2013 | |||||
| Weighted % | |||||
| Setting | Number of question responses | Mean % completely | Lowest % completely | Highest % completely | Variability between Area Teams (% point difference) |
| Home | 19,676 | 18.1 | 15.8 | 22.0 | 6.2 |
| Care home | 10,494 | 45.8 | 38.2 | 51.6 | 13.3 |
| Hospice | 3,743 | 62.7 | 49.3 | 69.6 | 20.3 |
| Hospital | 21,966 | 38.6 | 34.3 | 42.8 | 8.6 |
| Source: Office for National Statistics | |||||
| Notes: | |||||
| 1. The sample size for hospices is significantly smaller than for other settings due to fewer people experiencing hospice care. | |||||
Download this table Table 3: Responses of pain managed "Completely, all the time" by setting
.xls (27.6 kB)6. Preferences and choice at the end of life
Respondents were asked if they knew where the deceased wanted to die. National data shows that 32% of family members reported that their relative had expressed a preference of where they would like to die and gave further details (ONS, 2014b). At NHS Area Team level, over one third (36%) of responders reported knowing where the deceased would like to die and of these, an average of 54% died in their preferred place of death (Table 4). This varied by 10 percentage points across NHS Area Teams, with the lowest proportion of people dying in their preferred place of death being 49% and the highest 59%. There are no significant changes in the proportion dying in their preferred place within areas when comparing 2011 to 2012 and 2012 to 2013 data.
As reflected in previous VOICES publications, the majority of people want to die at home. When looking only at those who died in their preferred place, almost three quarters (74%), died at home. This figure varied fairly widely across NHS Area Teams by 14 percentage points. Only 4% of people dying in their preferred place died in hospital, highlighting that this is not where people choose to die.
There is disparity between the cause of death and the proportions of people dying in their preferred place. Over half of the people dying in their preferred place die of cancer (56%), over one quarter (26%) die of other causes and less than one fifth (19%) die of cardiovascular disease. Variability between these proportions in each NHS Area Team is quite wide, ranging between 12 and 15 percentage points, indicating variability in the likelihood of dying in your preferred place by cause of death across NHS Area Teams. As few as 12% of cardiovascular patients and as many as 64% of cancer patients die in their preferred place and this is indicative of the different specialist care available for different diseases at the end of life.
The mean results also show that people who die in their preferred place of death are significantly more likely to be female. Across NHS Area Teams, women are significantly more likely to die in their preferred place than men in 5 NHS Area Teams, although there is no significant gender difference in the remaining 20 areas. The wide variability (15 percentage points) further displays that this finding does vary geographically.
Age significantly affects the likelihood of dying in your preferred place. Almost half (48%) of those aged over 80 died in their preferred place, which contrasts starkly to 17% of those aged under 65. While the variability of the proportion of people of different age groups dying in their preferred place is wide, (between 12 and 18 percentage points) the greater likelihood of older people dying in their preferred place is clear among all NHS Area Teams.
Table 4: People who died in their preferred place of death, by place of death, cause of death, age group and sex
| NHS Area Teams, England, 2012-2013 | |||||
| Weighted % | |||||
| Mean % | Lowest % | Highest % | Variability between Area Teams (% point difference) | ||
| People who died in their preferred place | 54.2 | 48.7 | 58.8 | 10.1 | |
| Place of death | |||||
| Hospital | 4.1 | 1.7 | 8.1 | 6.4 | |
| Care home | 11.7 | 6.3 | 18.5 | 12.2 | |
| Home | 74.2 | 65.8 | 79.9 | 14.2 | |
| Hospice | 9.9 | 5.3 | 15.0 | 9.7 | |
| Cause of death | |||||
| Cancer | 55.9 | 48.7 | 63.8 | 15.0 | |
| Cardio | 18.6 | 12.2 | 23.7 | 11.5 | |
| Other | 25.5 | 19.4 | 34.6 | 15.2 | |
| Age group | |||||
| <65 | 16.9 | 8.2 | 23.5 | 15.3 | |
| 65 -79 | 35.0 | 29.0 | 41.4 | 12.4 | |
| 80+ | 48.1 | 38.6 | 56.9 | 18.3 | |
| Sex | |||||
| Male | 47.3 | 39.1 | 54.3 | 15.2 | |
| Female | 52.7 | 45.7 | 60.9 | 15.2 | |
| Source: Office for National Statistics | |||||
| Notes: | |||||
| 1. There were 7,976 people who died in their preferred place of death. | |||||
| 2. The sample size for Hospices is significantly smaller than for other settings due to fewer people experiencing Hospice care. | |||||
Download this table Table 4: People who died in their preferred place of death, by place of death, cause of death, age group and sex
.xls (28.7 kB)7. Support for relatives, friends or carers at the end of life
The VOICES questionnaire asks about the support the respondent and family of the deceased received after the death. This suite of questions relates to support for the carer and family, but the questions cannot be directly compared as they use different response options. For the “yes” or “no” response question, almost all (94%) of respondents said they or the deceased’s family were dealt with sensitively following the death and there is little variability across NHS Area Teams (6 percentage points difference, Table 5). Less than two thirds (60%, Table 6) felt that they were “definitely” given support at the time of death (26% said “to some extent” and 14% “not at all”, Reference table 1 (392 Kb Excel sheet)). Over three quarters (78%, Table 7) were involved in decisions relating to care as much as they wanted to be, with 22% wanting to be more involved and less than 1% wanting to be less involved (see Reference Table 1 (392 Kb Excel sheet)).
The support given at the time of death varied more widely across NHS Area Teams with a 13 percentage point difference between areas. There are 9 areas that differed significantly from the national average. Variability of people feeling they were dealt with sensitively and involved in decisions as much they wanted were both relatively low at 6% and 8% respectively. There are 6 areas that differed significantly from the national average for staff dealing sensitively with family members and 7 areas differed significantly in relation to people being involved in care as much as they wanted.
There were no significant changes between years.
Table 5: Staff dealt with the respondent in a sensitive manner
| NHS Area Teams, England, 2012-2013 | |||||
| Weighted % | |||||
| Response | Number of question responses | Mean % | Lowest % | Highest % | Variability between Area Teams (% point difference) |
| Yes | 40,919 | 93.7 | 90.0 | 96.0 | 6.0 |
| Source: Office for National Statistics | |||||
Download this table Table 5: Staff dealt with the respondent in a sensitive manner
.xls (18.4 kB)
Table 6: Was the respondent given enough help and support by the healthcare team at the actual time of the death?
| NHS Area Teams, England, 2012-2013 | |||||
| Weighted % | |||||
| Response | Number of question responses | Mean % | Lowest % | Highest % | Variability between Area Teams (% point difference) |
| Yes, definitely | 42,065 | 60.1 | 52.4 | 65.7 | 13.3 |
| Source: Office for National Statistics | |||||
Download this table Table 6: Was the respondent given enough help and support by the healthcare team at the actual time of the death?
.xls (18.4 kB)
Table 7: The respondent was involved in decisions about care
| NHS Area Teams, England, 2012-2013 | |||||
| Weighted % | |||||
| Response | Number of question responses | Mean % | Lowest % | Highest % | Variability between Area Teams (% point difference) |
| Respondent was involved as much as they wanted to be | 41,580 | 77.9 | 73.2 | 80.9 | 7.7 |
| Source: Office for National Statistics | |||||
Download this table Table 7: The respondent was involved in decisions about care
.xls (18.4 kB)8. Response rates and NHS Area Team samples
The VOICES survey has been conducted annually since 2011. In each year, the data are weighted to adjust for sampling and response biases (see background note 8). The sample each year was selected to be representative of deaths in England, for instance place of death, cause of death and geographical area. Certain causes of death were excluded from the sample, such as those resulting from external or sudden causes, for example, suicides and accidents.
There are 25 NHS Area Teams, which vary demographically and the analysis presented does not account for these differences. For example, urban and rural differences and deprivation levels may affect the actual quality of care available and the expectations of the respondent about care quality. While these factors may influence results, they have not been controlled due to the aim of NHS England to provide a high standard of care, regardless of the demographics of the area.
The London NHS area team is distinct in that it covers the same area as the London NHS region. It therefore has the largest population (6.4 million people aged over 17) while all other areas have a population between approximately 1 and 2 million people. Naturally, London also has the highest number of deaths (45,000 deaths in 2013), compared to between 11,000 and 25,000 in all other areas.
Over the 2 survey years (2012 and 2013), 45,000 people have responded to the VOICES survey, representing 46% of people who have been contacted. NHS Area Team sample sizes vary between 2,477 in “Durham, Darlington and Tees” and 9,825 in London. Response rates vary between 39% in Merseyside and 52% in “Bath, Gloucestershire, Swindon and Wiltshire”.
Other main characteristics of the sample were:
approximately 60% of respondents in each NHS Area Team were female and 70% to 80% were aged 50 to 79
approximately 60% of respondents were the son or daughter of the deceased
further details on the demographics of the sample can be found in reference table 1 (392 Kb Excel sheet), sample details
9. Guidance on interpreting results
This bulletin uses data from VOICES 2012 and 2013, which have been combined to enable detailed analysis at sub-national level. Combining 2 years of data creates a larger sample size, increasing the validity of the results. Results are presented in this bulletin for NHS Area Teams with data for each question provided in reference table 1 (392 Kb Excel sheet).
It is appropriate to combine the 2 datasets as they are based on comparable methodology. In both 2012 and 2013, the sample has been drawn from deaths registered between January and April of the survey year, with respondents returning their questionnaires between September and December. It is worth noting that there are seasonal effects on the number of deaths, with higher numbers, particularly of older people, dying in the winter months and that the survey is therefore only representative of deaths in this period. However, as the comparison period is the same each year, it is appropriate to combine the data. Data is not collected throughout the year so it is unnecessary to adjust the figures for seasonal effects.
Respondents complete the questionnaire 4 to 11 months after a death in each year that the survey is conducted. This is deemed appropriate to avoid acute periods of grief and the anniversary of a death. It does mean that the responses are open to recall bias with events potentially forgotten and more salient events affecting ratings more than may otherwise be the case. Again, the collection methodology is consistent each year, allowing for the same period of cognitive change for respondents and enhancing comparability.
The VOICES survey approaches the person registering a death to complete information on the quality of care that the deceased received. As such, the survey provides a proxy measure of end of life care, which may differ to the unknown opinions of the person who actually received the care. Respondents are posted the survey to complete, enabling them to complete it in their own time, or pass it to someone more appropriate. While the survey can receive criticism from respondents for being too rigid, it has received consistent year on year response rates of 45%, which is good for a survey based on this methodology.
As a sample survey, VOICES is subject to variability in the results found. To aid interpretation, the confidence intervals are presented in the reference table. These enable comparisons to be drawn between groups or areas and indicate the amount of uncertainty there is around a figure (the larger the interval, the greater the uncertainty). Where confidence intervals between 2 figures overlap, we cannot say with certainty that there is more than a chance difference between the figures. The confidence intervals for each of the NHS Area Teams commonly overlap with each other and it is important to recognise that where this is the case, areas do not differ significantly from each other. This is an important consideration when interpreting results (see background note 6).
The survey routes respondents to questions relevant to their situation and therefore some questions have more responses than others. For instance, few people experienced care in hospices and the number of responses to hospice related questions is far lower than to questions on themes such as support provided to carers at the end of a life, which are relevant to all respondents. Questions with fewer responses are less robust and consequently have wider confidence intervals, reducing the likelihood of significant differences between areas.
As well as question response differences, VOICES is also subject to sampling error and response bias. As a sample survey, responders represent a proportion of the population of deaths registered between 2012 and 2013. Of the sample selected, it is important to remember that the survey reflects the views of responders only and nothing is known about the experiences of people who do not respond. The VOICES weighting methods aim to control these biases (see background note 8 and further details on the types of bias affecting the survey are given in the Quality and Methodology Information Report).
Questions in the VOICES survey use a range of response option scales. For instance, overall quality of care is measured on a 5 point scale from ‘outstanding’ to ‘poor’, while quality of care by setting is measured on a 4 point scale from ‘excellent’ to ‘poor’. Caution should be taken in comparing results based on different scales, as differences in results can be caused by having a different number of response options for respondents to choose from. This is particularly true for comparing questions under the theme ‘Support for carer and the family’.
This bulletin is an update on the 2011 to 2012 NHS Area Team bulletin. It is appropriate to draw comparisons between the results in each bulletin, however, as the results are based on similar data (2012 data is included in each bulletin to provide a larger sample), there are no significant changes in this updated bulletin. Where no changes are discussed in the commentary, there were no notable differences between the results of each bulletin.
Back to table of contents10. Clinical Commissioning Group analysis
A decision has been made that Clinical Commissioning Group (CCG) level analysis should not be included in this year’s bulletin. The survey design of VOICES is focused on providing results at national and Area Team Level; it does not allow for representative analysis of the population within a CCG area. A small number of tables were presented at CCG level in the 2011 to 2012 NHS Area Team bulletin to satisfy user requirements. This analysis showed that only a few questions could be presented in the bulletin due to the limited sample size, and where this was possible, only the positive end of the response scale was presented (for example “outstanding” or “excellent”), due to small numbers at the negative end (for example “poor” or “never”). Results were also presented with confidence intervals to demonstrate the low reliability of the figures.
Despite these caveats, NHS England and ourselves have become aware that the results have been used without consideration of these limitations. We have therefore taken the difficult decision to withdraw them from this publication as they cannot be considered a thorough enough measure to inform decision-making on services.
Back to table of contents11. Uses and users of end of life care statistics
The National Survey of Bereaved People (VOICES) has a range of uses and users. The Department of Health commissioned this survey to follow up on a commitment made in the End of Life Care Strategy. The results of this survey will be used to inform policy decisions and to enable evaluation of the quality of end of life care in different settings, across different ages and different causes of death.
The Liverpool Care Pathway has provided a protocol for end of life care which has received criticism in a recent review (NHS England, 2013a). Following this review, the Leadership Alliance for the Care of Dying People has been established to provide improvements in end of life care (NHS England, 2013b). VOICES statistics provide data which will enable the impact of end of life care policies to be monitored during this transitional period.
NHS England are taking this work forward. Quality of end of life care is 1 of the main areas in the NHS Outcomes Framework. This has relevance for Domain 2 ‘Enhancing quality of life for people with long-term conditions’ and Domain 4 ‘Ensuring that people have a positive experience of care’. Indicator 4.6 ‘Improving the experience of care for people at the end of their lives’ uses data from VOICES to gather bereaved carers’ views on the quality of care in the last 3 months of life.
VOICES data is also used to support third sector activity, such as supporting lobbying campaigns to improve care at home, allocating charity resources and evaluating and comparing service provision across settings. VOICES results also have value in academic research and have been used in numerous studies, for example, identifying factors influencing quality of care and the impact of pain management on experience of care.
There is also wide public interest in VOICES results, which help to inform differences in quality of care between settings, health conditions and stage of life and can inform lifestyle choices on preferences for care and place of death. Survey respondents in particular have an interest in the results. The full range of uses for official statistics can be seen in The Use Made of Official Statistics (2010).
We welcome feedback from users on the content, format and relevance of this release. Data users can post or email feedback to the address in the background notes section.
Back to table of contents12. Next publication
The National Survey of Bereaved People (VOICES), 2014 is due to be published in July 2015.
From January 2016, the publication schedule is changing to make release of the statistics more timely. The National Survey of Bereaved People (VOICES), 2015 will be published in March/April 2015.
A combined publication of 2013 to 2014 data will not be published due to some questions on the 2013 and 2014 surveys being different and a lack of visible change between publications containing 1 year of the same data.
Back to table of contents