Table of contents
- Main points
- Summary
- Time trends for the UK as a whole, 1994 to 2014
- Comparisons between the 4 countries of the UK, 1994 to 2014
- Regions of England
- Deaths mentioning an alcohol-related cause as a contributory factor
- Alcohol-related deaths definition
- Context and uses of these statistics
- Registration delays
- Full results
- References
- Background notes
- Methodology
1. Main points
In 2014, there were 8,697 alcohol-related deaths registered in the UK, an age-standardised rate of 14.3 deaths per 100,000 population
In the UK as a whole, alcohol-related death rates have fallen since peaking in 2008, but the rate in 2014 is still higher than that observed in 1994
The majority of alcohol-related deaths (65%) in the UK in 2014 were among males.
Alcohol-related death rates were highest among 55 to 64-year-olds in 2014.
For both sexes, Scotland had the highest alcohol-related death rates in 2014. However, Scotland has also seen the fastest decrease in its rates since they peaked in the 2000s
Alcohol-related death rates for both sexes were significantly higher in the north of England than the south in 2014.
England and Wales are the only UK countries where alcohol-related death rates for females were significantly higher in 2014 than 1994
2. Summary
In 2014, there were 8,697 alcohol-related deaths registered in the UK, an age-standardised rate of 14.3 deaths per 100,000 population. Of these, 5,687 deaths were among males (65% of the deaths) and 3,010 among females (35% of the deaths), with rates of 19.4 deaths per 100,000 males and 9.6 per 100,000 females.
In 2014, Scotland had the highest age-standardised alcohol-related death rate for males at 31.2 deaths per 100,000. This rate is significantly higher than those of any other constituent country of the UK. Rates in Northern Ireland (20.3 per 100,000 males), Wales (19.9 per 100,000 males), and England (18.1 deaths per 100,000) were not statistically significantly different from each other.
Scotland also had the highest alcohol-related death rate for females at 13.3 deaths per 100,000. This rate is significantly higher than that in England and Northern Ireland, but not significantly different from that in Wales. Rates in Wales (10.4 deaths per 100,000), England (9.1 per 100,000), and Northern Ireland (8.5 deaths per 100,000 females) were not statistically significantly different from each other.
Age-specific alcohol-related death rates among females were typically half those observed among males across all age groups. In 2014, the age-specific rate was highest among males aged 60 to 64 (47.6 deaths per 100,000) and among females aged 55 to 59 years (22.1 deaths per 100,000).
Figures are based on deaths registered in each calendar year, rather than occurring in each year. Since the majority of alcohol-related deaths registered in 2014 also occurred in that year (90%), registration delays are likely to have no impact on the findings.
Back to table of contents3. Time trends for the UK as a whole, 1994 to 2014
Rates of alcohol-related deaths have fallen, but still remain higher than those observed 20 years ago
The age-standardised rate for alcohol-related deaths in the UK has fallen from 15.8 deaths per 100,000 people in 2008, when the rate peaked, to 14.3 per 100,000 in 2014. Despite this improvement, the 2014 rate is still higher than that observed in 1994 (9.1 deaths per 100,000 people) when our records began.
Between 1994 and 2014, alcohol-related death rates among males were typically double that of females. In 2014, there were 19.4 alcohol-related deaths per 100,000 males, compared with 9.6 deaths per 100,000 females.
Figure 1: Age-standardised alcohol-related death rates per 100,000 population, UK, 1994 to 2014
Source: Office for National Statistics, National Records of Scotland, Northern Ireland Statistics and Research Agency
Notes:
- A common definition of alcohol-related death is used across the United Kingdom. See the section on the National Statistics definition of alcohol-related deaths for more information.
- Rates are expressed per 100,000 population and standardised to the 2013 European Standard Population.
- Deaths of non-residents are included in figures for the UK.
- Figures are for deaths registered in each calendar year.
- In 2014 the average number of days between date of death and death registration in England and Wales was 5 days for alcohol-related causes.
Download this chart Figure 1: Age-standardised alcohol-related death rates per 100,000 population, UK, 1994 to 2014
Image .csv .xlsAlcohol-related death rates highest among 55 to 64-year-olds in 2014
In each year between 1994 and 2014, the age-specific rate for alcohol-related deaths increased steadily with age, before generally peaking among those in their 50s or 60s. The rate then fell in subsequent age groups and, in some cases, the oldest age groups from 75 years upwards had rates similar to those in their 40s.
In 2014, age-specific rates for men were highest among those aged 60 to 64 years (47.6 deaths per 100,000 men) and lowest among 25 to 29-year-olds (1.8 per 100,000). For women, rates were highest among 55 to 59-year-olds (22.1 per 100,000) and lowest among 25 to 29-year-olds (1.1 per 100,000).
Alcohol-related death rates decreased among those younger than 60 since peaking in the 2000s
In age groups below 30 to 34 years, because there are generally fewer deaths related to alcohol than at older ages, it is not always possible to calculate reliable age-specific death rates. Therefore, we have based the analysis of time trends in age-specific rates on those in age groups from 30 to 34 years upwards.
For men, age-specific rates initially increased in the majority of age groups, despite annual fluctuations, between 1994 and the 2000s when they peaked. The most noticeable increases were in age groups up to 55 to 59 years, where rates at their peak were double those observed in 1994. Rates in these age groups have since fallen significantly to date, but in older age groups they have remained relatively stable. A similar picture was observed in women; however, only 40 to 44-year-olds and 50 to 54-year-olds experienced significant decreases in rates between the year they peaked and 2014.
Overall, despite improvements in the last decade or so, age-specific alcohol-related death rates were still higher in 2014 than in 1994.
Figure 2: Age-specific alcohol-related death rates per 100,000 males, UK, 1994 to 2014

Source: Office for National Statistics, National Records of Scotland, Northern Ireland Statistics and Research Agency
Notes:
- A common definition of alcohol-related death is used across the United Kingdom. See the section on the National Statistics definition of alcohol-related deaths for more information.
- Rates are expressed per 100,000 population and standardised to the 2013 European Standard Population.
- Deaths of non-residents are included in figures for the UK.
- Figures are for deaths registered in each calendar year.
- In 2014 the average number of days between date of death and death registration in England and Wales was 5 days for alcohol-related causes.
Download this image Figure 2: Age-specific alcohol-related death rates per 100,000 males, UK, 1994 to 2014
.png (33.0 kB) .xls (32.3 kB)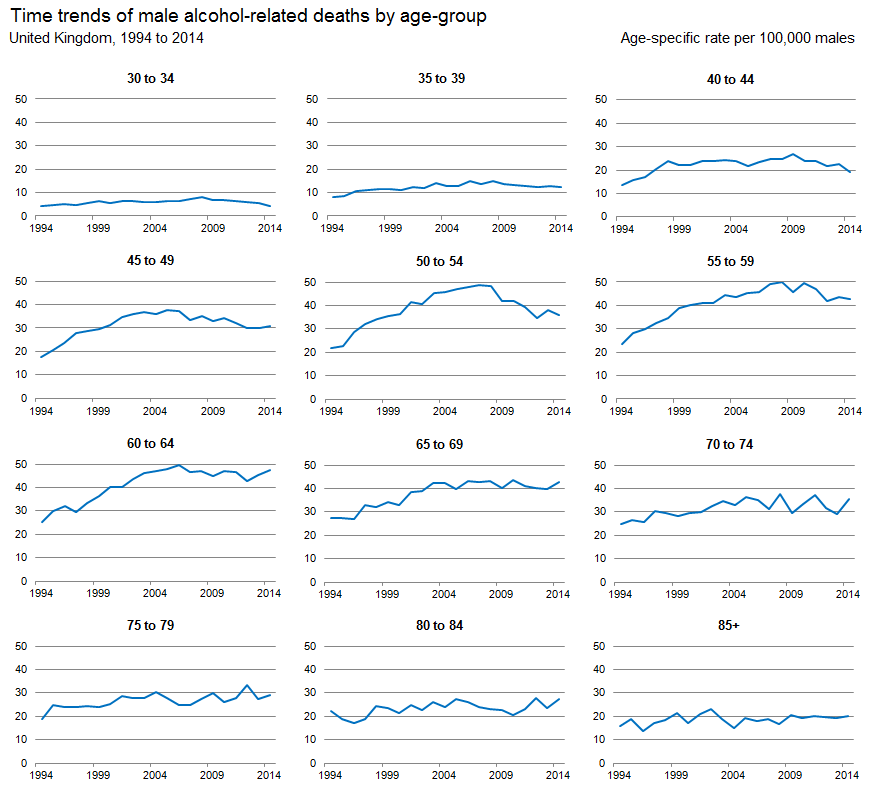
Figure 3: Age-specific alcohol-related death rates per 100,000 females, UK, 1994 to 2014
UK

Source: Office for National Statistics, National Records of Scotland, Northern Ireland Statistics and Research Agency
Notes:
- A common definition of alcohol-related death is used across the United Kingdom. See the section on the National Statistics definition of alcohol-related deaths for more information.
- Rates are expressed per 100,000 population and standardised to the 2013 European Standard Population.
- Deaths of non-residents are included in figures for the UK.
- Figures are for deaths registered in each calendar year.
- In 2014 the average number of days between date of death and death registration in England and Wales was 5 days for alcohol-related causes.
Download this image Figure 3: Age-specific alcohol-related death rates per 100,000 females, UK, 1994 to 2014
.png (33.7 kB) .xls (24.1 kB)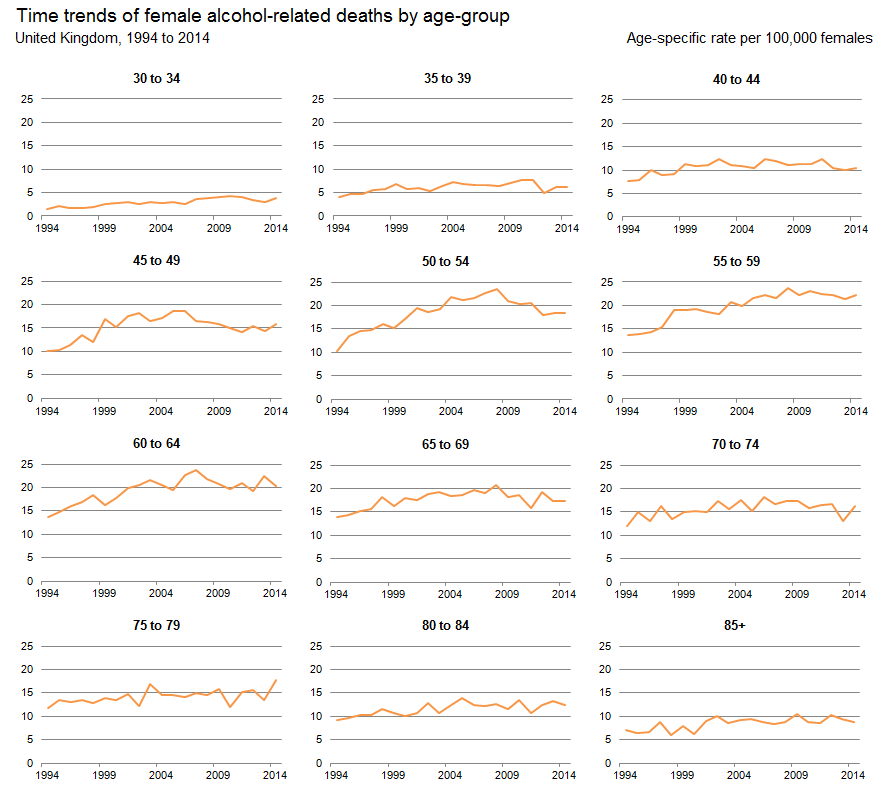
4. Comparisons between the 4 countries of the UK, 1994 to 2014
Males in Scotland experienced the fastest decrease in alcohol-related death rates since 2003
In 2014, Scotland had the highest age-standardised alcohol-related death rate for males at 31.2 deaths per 100,000. This rate is significantly higher than those of any other constituent country of the UK. Rates in England (18.1 deaths per 100,000), Wales (19.9 per 100,000 males) and Northern Ireland (20.3 per 100,000 males) were not statistically significantly different from each other.
In all constituent countries of the UK, the age-standardised alcohol-related death rate for males rose in the 1990s before peaking in the 2000s. Rates have generally fallen to date, but are still significantly higher than they were in 1994.
Scotland had the highest alcohol-related death rates over the period 1994 to 2014, as well as the steepest increase in rates between 1994 and the 2000s. Despite this, compared with other UK countries, Scotland saw the most substantial decrease in male alcohol-related death rates between 2003, when its rate peaked at 47.7 deaths per 100,000, and 2014. By 2014, the rate in Scotland had fallen significantly to 31.2 deaths per 100,000. Alcohol-related death rates for males were generally lower in England than in any other UK country over the last 2 decades, but these rates were sometimes not significantly different from those observed in Wales and Northern Ireland.
Figure 4: Age-standardised alcohol-related death rates per 100,000 males, UK constituent country, 1994 to 2014
Source: Office for National Statistics, National Records of Scotland, Northern Ireland Statistics and Research Agency
Notes:
- A common definition of alcohol-related death is used across the United Kingdom. See the section on the National Statistics definition of alcohol-related deaths for more information.
- Rates are expressed per 100,000 population and standardised to the 2013 European Standard Population.
- Deaths of non-residents are included in figures for the UK.
- Figures are for deaths registered in each calendar year.
- In 2014 the average number of days between date of death and death registration in England and Wales was 5 days for alcohol-related causes.
Download this chart Figure 4: Age-standardised alcohol-related death rates per 100,000 males, UK constituent country, 1994 to 2014
Image .csv .xlsEngland and Wales are the only UK countries where alcohol-related death rates for females were significantly higher in 2014 than 1994
In 2014, Scotland had the highest alcohol-related death rate for females at 13.3 deaths per 100,000. This rate is significantly higher than that in England and Northern Ireland, but not significantly different from that in Wales. Rates in Wales (10.4 deaths per 100,000), England (9.1 per 100,000), and Northern Ireland (8.5 deaths per 100,000 females) were not statistically significantly different from each other.
In each UK country, alcohol-related death rates increased in the 1990s before peaking in the mid to late 2000s. The increase in rates up to 2006 was noticeably steeper in Scotland than elsewhere.
Since peaking, rates in some countries have fallen significantly to date, while others have remained relatively stable.
Rates in Scotland were significantly higher than those in England between 1994 and 2014. Compared with Wales and Northern Ireland, rates in Scotland were significantly higher in each year up 2011, but not always significantly higher afterwards.
Overall, England and Wales are the only UK countries where the age-standardised alcohol-related death rates for females were significantly higher in 2014 than 1994.
Since 1994, female alcohol-related death rates in England, Northern Ireland and Wales have been largely comparable, with very few significant differences between these countries during the whole time period.
Figure 5: Age-standardised alcohol-related death rates per 100,000 females, UK constituent country, 1994 to 2014
Source: Office for National Statistics, National Records of Scotland, Northern Ireland Statistics and Research Agency
Notes:
- A common definition of alcohol-related death is used across the United Kingdom. See the section on the National Statistics definition of alcohol-related deaths for more information.
- Rates are expressed per 100,000 population and standardised to the 2013 European Standard Population.
- Deaths of non-residents are included in figures for the UK.
- Figures are for deaths registered in each calendar year.
- In 2014 the average number of days between date of death and death registration in England and Wales was 5 days for alcohol-related causes.
Download this chart Figure 5: Age-standardised alcohol-related death rates per 100,000 females, UK constituent country, 1994 to 2014
Image .csv .xls5. Regions of England
Alcohol-related deaths rates for both sexes were significantly higher in the north of England than the south in 2014
For males, alcohol-related death rates were significantly higher among regions in the north of England than those in the south. In 2014, there were 25.5 and 24.2 alcohol-related deaths per 100,000 in the North West and the North East, respectively. Conversely, in the South East and the East of England where rates were lowest, there were 15.1 and 13.3 deaths per 100,000, respectively.
As with males, female alcohol-related death rates were also significantly higher in the north of England than the south. In 2014, there were 15.1 and 13.4 alcohol-related deaths per 100,000 in the North East and the North West, respectively. Conversely, in London and the East of England, where rates were lowest, there were 6.8 and 7.3 deaths per 100,000 females, respectively.
For all regions of England, rates of alcohol-related deaths typically peaked in the mid-to-late-2000s. With the exception of London, rates for both sexes were significantly higher in 2014 than in 1994.
In some regions of England, the rate of alcohol-related death for both sexes has more than doubled since the time series began. For example, in Yorkshire and The Humber, rates of alcohol-related deaths in 1994 were 7.9 and 4.1 deaths per 100,000 for males and females, respectively. In 2014, these rates were 18.6 and 8.9 deaths per 100,000 for males and females, respectively.
The regional differences recorded in alcohol-related deaths are likely to have resulted from regional differences in drinking habits. Consumption habit data from Public Health England (2006) shows that in 1998, males and females in the North West were most likely to have been binge drinking on one day in the week before the survey, while males in the East of England, and females in the East of England, London and the South East were least likely to display these drinking habits.
An investigation into age-standardised hospital admissions due to alcohol-related causes between 2001 and 2004 by the North East Public Health Observatory (2006) revealed a similar pattern, with the North West recording the highest regional admissions and the East of England recording the lowest rates for both sexes.
The geographic variation in alcohol-related death rates has been well documented in previous research. For example, Breakwell et al. (2007) reported a strong link between higher alcohol-related death rates and those living in the most deprived neighbourhoods of England and Wales (2.95 Mb Pdf). Similarly, Fone et al. (2013) showed that those living in the most deprived areas of Wales were more likely to demonstrate harmful binge drinking behaviour than those in the least deprived areas. Erskine et al. (2010) also supported these findings, additionally reporting higher risk of alcohol-related deaths in urban areas, after accounting for socio-economic status.
Figure 6: Age-standardised rates of alcohol-related deaths for males, by region, England, 2014

Source: Office for National Statistics
Download this image Figure 6: Age-standardised rates of alcohol-related deaths for males, by region, England, 2014
.png (204.6 kB)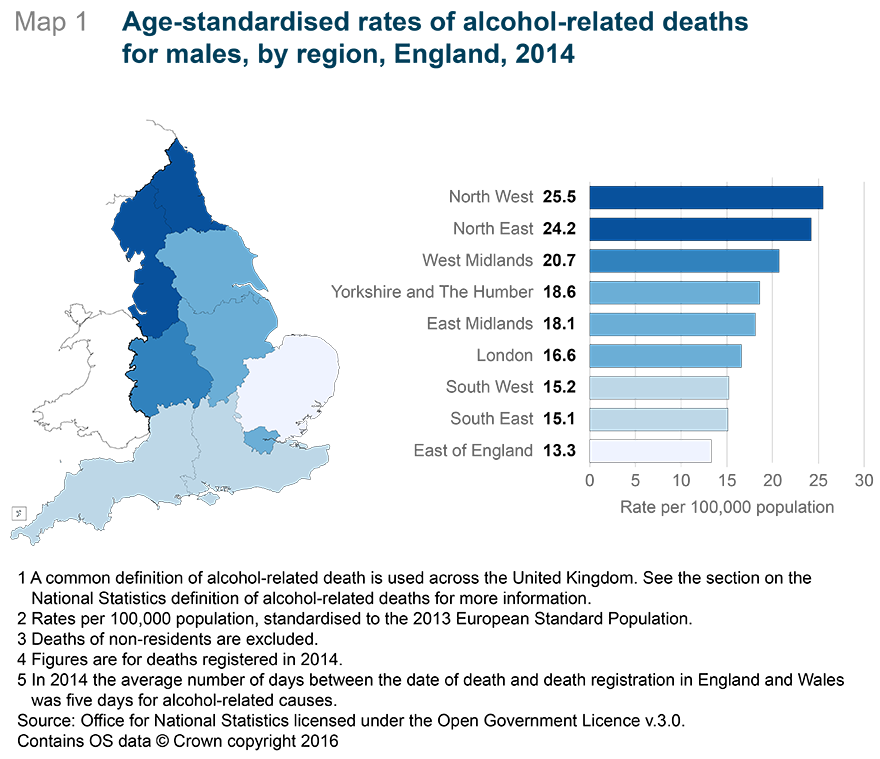
Figure 7: Age-standardised rates of alcohol-related deaths for females, by region, England, 2014

Source: Office for National Statistics
Download this image Figure 7: Age-standardised rates of alcohol-related deaths for females, by region, England, 2014
.png (160.4 kB)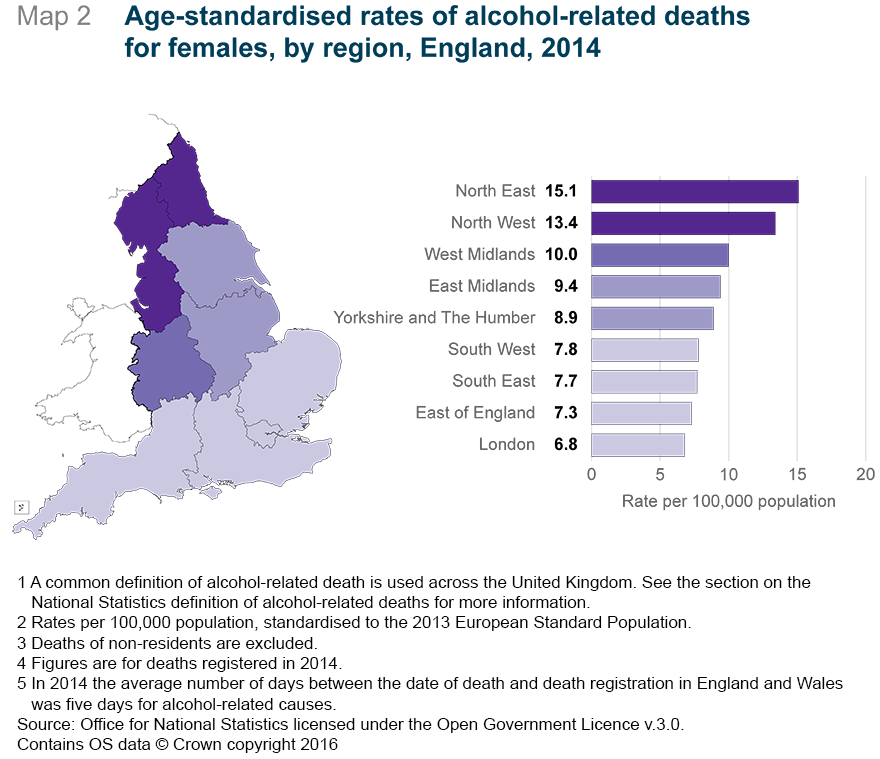
8. Context and uses of these statistics
Alcohol is a psychoactive substance, with dependence producing properties. It has been widely used for ritualistic and recreational purposes for centuries. Once consumed, alcohol is quickly absorbed by the stomach and small intestine and carried throughout the bloodstream where its effects on the brain are quickly established. The human body treats alcohol as a toxic substance, and removes it by breaking it down in the liver (FPH, 2008).
The harmful effects of alcohol on the human body can be categorised as acute (immediate) or chronic (longer-term). Examples of acute effects include reduced co-ordination and lowered inhibitions, while chronic effects include liver cirrhosis, heart disease and increased risk of developing liver, bowel and other forms of cancer (Cancer Research 2014). All types of alcoholic beverage (for example, beer, wine, spirits) increase the risk of certain cancers and recently it has been estimated that between 4 to 6% of new cancers in the UK are caused by alcohol consumption (COC, 2015).
In 2014, the UK consumed an average of 9.4 litres of alcohol per adult (defined as those aged 15 years and above; BBPA, 2015). Excessive drinking is estimated to result in approximately 3.3 million (5.9% of all deaths) deaths globally each year (WHO, 2014). This is greater than, for example, the proportion of deaths from HIV/AIDS (2.8%), violence (0.9%) or tuberculosis (1.7%) (WHO, 2014). In England, alcohol misuse costs the National Health Service (NHS) around £3.5 billion per year (House of Commons Health Committee, 2012).
Given the harmful effects of excessive alcohol consumption, there is widespread policy, professional and public interest in the prevalence of alcohol-related deaths in the UK. The main users of these statistics include the Department of Health and devolved government administrations, public health organisations and local government. The figures on alcohol-related deaths are used to monitor and develop policies to protect the health of the general public.
In January 2016, the government published new guidelines for alcohol consumption (Department of Health, 2016), recommending that men and women should drink no more than 14 units of alcohol per week and that these units should be spread across several days. These new guidelines outline the government’s commitment to protecting the population from serious health threats, helping people to live longer, healthier and more fulfilling lives. The Home Office’s Alcohol Strategy (2012) introduced a minimum unit price for alcohol and initiated a consultation on banning multi-buy alcohol discounting in order to reduce the number of people drinking to harmful levels.
Non-government users of these statistics include non-profit organisations such as Drinkaware and Addaction. These organisations use the statistics to raise awareness of the potential risks associated with excessive drinking habits, to target support services to groups at risk of experiencing adverse consequences of alcohol consumption and to inform public opinion and government policy. Many of these organisations have signed up as partners to the government’s Public Health Responsibility Deal (Department of Health, 2014). Academics and researchers also use the statistics to investigate the cause and impacts of alcohol-related deaths.
These statistics are of interest to the general public. Local and national media report on alcohol-related death trends and geographical patterns and may comment on the effectiveness of current or proposed government policies.
This statistical bulletin presents figures for the UK, England and Wales, and English regions. Statistics for Scotland are also published by the National Records of Scotland while those for Northern Ireland are published by the Northern Ireland Statistics and Research Agency.
Back to table of contents9. Registration delays
The information used to produce mortality statistics is based on the details collected when deaths are certified and registered. In England and Wales, deaths should be registered within 5 days of the death occurring, but there are some situations that result in the registration of the death being delayed. Deaths considered unexpected, accidental or suspicious will be referred to a coroner who may order a post mortem or carry out a full inquest to ascertain the reasons for the death.
Alcohol-related death statistics are presented based on the number of deaths registered in each calendar year, rather than the number of deaths that actually occurred in that year. This method is used because there is a requirement for consistent and timely data, despite a potential limitation in data quality caused by registration delays.
In 2014, fewer deaths from alcohol-related causes were registered within 5 days than deaths from all other causes (55% compared with 71%) in England and Wales. The average (median) time taken for a death to be registered was 5 days, a day longer than from all causes of death. Approximately 80% of alcohol-related deaths were registered within 30 days, while approximately 4% took upwards of 6 months to be registered. The majority of alcohol-related deaths registered in 2014 also occurred in that year (90%). The average registration period for alcohol-related deaths in Scotland and Northern Ireland were 3 days and 6 days respectively.
Table 3: Registration period for alcohol-related deaths and all-cause mortality, England and Wales, deaths registered in 2014
| Cause | Deaths registered in 2014 | Proportion of deaths registered (%) | |||||
| Within 5 days | Six days to one month (6-30 days) | One to three months (31 - 91 days) | Three to six months (92 - 183 days) | Six months to one year (184 - 365 days) | Over 1 year (over 365 days) | ||
| Alcohol-related | 7,307 | 54.6 | 25.1 | 8.5 | 7.5 | 3.0 | 1.4 |
| All-cause mortality | 501,424 | 71.0 | 22.0 | 2.2 | 2.5 | 1.5 | 0.9 |
| Source: Office for National Statistics | |||||||
| Notes: | |||||||
| 1. A common definition of alcohol-related death is used across the United Kingdom; see the ‘Definition’ section of the bulletin for further information. | |||||||
| 2. Figures include deaths of those who are not usually resident in England and Wales. | |||||||
| 3. Deaths where the day and/or month of death are missing have been excluded. | |||||||
Download this table Table 3: Registration period for alcohol-related deaths and all-cause mortality, England and Wales, deaths registered in 2014
.xls (33.3 kB)10. Full results
Figures for alcohol-related deaths for the UK, England, Northern Ireland, Scotland, Wales, and regions of England can be found in the datasets (Microsoft Excel workbooks) on our website.
The 3 workbooks contain:
Results for the UK (134 Kb Excel sheet) – age-standardised rates per 100,000 (with 95% confidence intervals) and numbers of alcohol-related deaths for the period 1994 to 2014. Age-specific rates per 100,000 (with 95% confidence intervals) and numbers of alcohol-related deaths for the period 1994 to 2014. Both sets of figures are available split by sex.
Results for constituent countries of the UK (148 Kb Excel sheet) – for each constituent country, age-standardised rates per 100,000 (with 95% confidence intervals) and number of alcohol-related deaths for the period 1994 to 2014. Figures are available split by sex.
Alcohol-related deaths by individual cause (333 Kb Excel sheet) – for each constituent country, the number of alcohol-related deaths by the individual cause of death for the period 2001 to 2014. Figures are available split by sex and 5-year age groups.
Detailed statistics for Scotland, published by National Records of Scotland and for Northern Ireland, published by the Northern Ireland Statistics and Research Agency (NISRA) are available on their respective websites.
Back to table of contents