1. Main points
In the period July 2014 to June 2015, paying into an employer pension scheme was considered to be the safest way to save for retirement (41% of individuals asked considering this the safest method), with investing in property considered the second safest way (28% of individuals asked considering this the safest method)
When asked which method of saving for retirement was likely to make the most of their money, 44% of individuals asked considered investing in property the most likely while 25% considered paying into an employer pension scheme the most likely
The proportion of people not currently contributing towards a pension who gave the reason for this to be due to low income, not working or still in education, rose from 38% during July 2010 to July 2012 to 50% in July 2014 to June 2015
The percentage of people “very confident” or “fairly confident” their income in retirement will provide the standard of living they hope for, increased from 41% in July 2010 to June 2012 to 52% in July 2012 to June 2015
The proportion of individuals keeping up with all bills and credit cards without difficulty increased 10 percentage points, from 53% in July 2012 to June 2014 to 63% in July 2014 to June 2015
The percentage of people reporting their debt burden as “not a problem at all” rose from 66% during July 2010 to June 2012 to 75% in July 2014 to June 2015
2. Introduction
This report presents some early analysis of Wealth and Assets Survey (WAS) data covering the period July 2014 to June 2015, the first year of Wave 51 of the survey. These data are provisional and will not be considered “finalised” until publication of July 2014 to June 2016 data, due around December 2017.
Main results from Wave 4 of the Wealth and Assets Survey2, covering the period July 2012 to June 2014, is due to be published in December 2015, so these data presented here are also provisional.
There is currently, therefore, a delay of around 18 months between the end of data collection and the availability of full results for that particular wave. In order to better meet customer needs, provide timely metrics and added value before the main delivery of data, this is the second in a series3 of releases presenting some “early indicators” using data from WAS.
The publication of early indicators serves 2 purposes:
to monitor areas where we expect to see change
to allow more up-to-date statistics to be quoted
The development and purpose of the “early indicators” was given in the first edition of this article.
Notes for Introduction
The Wealth and Assets Survey (WAS) is a longitudinal survey, where respondents are questioned every 2 years. Each 2-year period is referred to as a “Wave”. Wave 1 covered the period July 2006 to June 2008, with subsequent waves carrying on continuously from this date. Wave 5 of the survey therefore covers the period July 2014 to June 2016. The latest data covered in this report covers the period July 2014 to June 2015 – the first year of Wave 5
Wealth in Great Britain – July 2012 to June 2014. This will follow the format of previous reports concentrating on total household wealth and the 4 components of wealth: net property wealth, net financial wealth, physical wealth and private pension wealth
Early indicators will be updated approximately every 6 months – so the third edition will be published around May 2016
3. “Early indicators” in this release
This release includes preliminary data for the periods July 2014 to June 2015 and July 2012 to June 2014 of the survey alongside finalised data for the period July 2010 to June 2012.
In order to maintain the production timetable for the main results of the survey, it is important that the production for the early indicators is not allowed to affect this. It is, therefore, not the intention to provide a great deal of commentary on these data, however the main observations will be highlighted.
Each release will therefore comprise a short article, containing commentary alongside plots of the cumulative data, with accompanying data tables and plots of the time series1.
Notes for “Early indicators” in this release
- Either quarterly or 6-monthly depending on the size of the sample responding to each question
4. Results
The early indicators included in this second release have been suggested by the consortium of funding departments of the Wealth and Assets Survey (WAS) and mirrors the analysis in the first early indicators release, with the exception of the variable “LvTday”1 which was not included in Wave 5 and with the addition of 2 variables, “DBurd ” and “DBurdA” which concern debt burden. At present 3 main subject areas are covered: saving for retirement, keeping up with bills and credit commitments, and debt burden.
Notes for Results
- This variable measured respondents’ tendency to live for today and let tomorrow take care of itself
5. Saving for retirement
There are a number of questions included in WAS that seek the views of respondents concerning their attitudes towards saving for retirement. They are:
Question name: OSafeRet
Which of the options on this card do you think would be the safest way to save for retirement?
CODE ONE ONLY 1. paying into an employer pension scheme 2. paying into a personal pension scheme 3. investing in the stock market by buying stocks or shares 4. investing in property 5. saving into a high rate savings account 6. saving into an ISA (or other tax-free savings account) 7. buying Premium Bonds 8. other
This provides a regular indication of people’s attitudes towards saving for retirement, including trust in pensions.
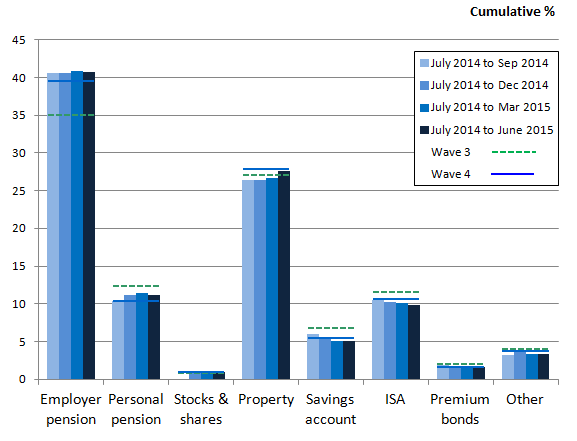
The safest way to save for retirement is considered to be paying into an employer pension scheme, with 41% of those asked reporting this as the safest method in the period July 2014 to June 2015. This continues to be reported as the safest way to save for retirement since July 2010 to June 2012, when 35% of those asked considered it to be the safest method.
The second safest way was considered to be investing in property. In the period July 2014 to June 2015, 28% of those asked reported this as the safest method, which has remained consistent with the period July 2012 to June 2014.
Attitudes towards the safest ways to save for retirement have remained consistent since the period July 2010 to June 2012, with public confidence strengthened in employer pensions and property. Stocks, shares, and premium bonds are considered the least safe method of saving for retirement.
Figure 1: Which option do you think would be the safest way to save for retirement?
Great Britain, 2010 to 2015
Source: Wealth and Assets Survey - Office for National Statistics
Notes:
- Wave 3 refers to the period July 2010 to June 2012; Wave 4 refers to the period July 2012 to June 2014. Data for periods from July 2012 are preliminary estimates
- Data has been suppressed if the unweighted sample counts are less than 30 respondents
Download this image Figure 1: Which option do you think would be the safest way to save for retirement?
.png (14.4 kB)
Question name: OMakeMost1
And which do you think would make the most of your money?
CODE ONE ONLY 1. paying into an employer pension scheme 2. paying into a personal pension scheme 3. investing in the stock market by buying stocks or shares 4. investing in property 5. saving into a high rate savings account 6. saving into an ISA (or other tax-free savings account) 7. buying Premium Bonds 8. other
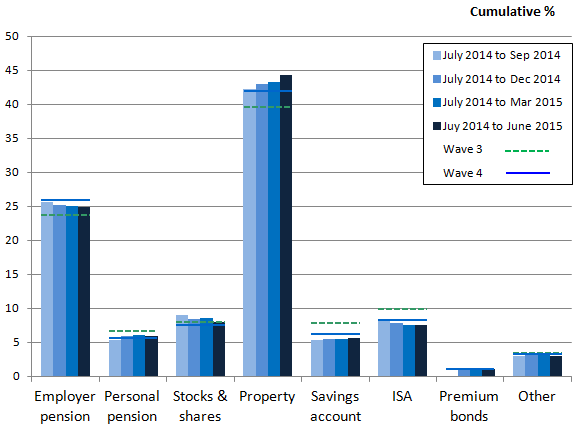
Figure 2 illustrates that pension schemes and property are also the 2 methods considered to make the most of your money when saving for retirement. Of those asked in the period July 2014 to June 2015, 44% thought investing in property would make the most of their money, whilst a quarter (25%) of respondents thought paying into an employer pension scheme would make the most of their money. The results again reiterate the growing confidence in property prices since July 2010.
The decrease in confidence that savings accounts and ISAs would make the most of their money observed between July 2010 to June 2012 and July 2012 to June 2014 continues into the period July 2014 to June 2015. This may be due to low interest rates impacting on people’s attitudes towards investments.
Figure 2: Which option do you think would make the most of your money?
Great Britain, 2010 to 2015
Source: Wealth and Assets Survey - Office for National Statistics
Notes:
- Wave 3 refers to the period July 2010 to June 2012; Wave 4 refers to the period July 2012 to June 2014. Data for periods from July 2012 are preliminary estimates
- Data has been suppressed if the unweighted sample counts are less than 30 respondents
Download this image Figure 2: Which option do you think would make the most of your money?
.png (14.2 kB)
Question name: OUnder
“I feel I understand enough about pensions to make decisions about saving for retirement”.
1. strongly agree 2. tend to agree 3. neither agree nor disagree 4. tend to disagree 5. strongly disagree 6. don’t know/no opinion (SPONTANEOUS ONLY)
With changes to pension policies in recent years, this question was designed to gauge whether respondents feel they have sufficient knowledge and understanding about pensions in general so that they can make the necessary decisions about saving for retirement and to understand if current information provided is sufficient or if more is needed. This question was introduced in July 2010. In the period July 2014 to June 2015, a higher proportion of people felt they had sufficient understanding of pensions, with 49% of respondents saying they either strongly agreed or tended to agree that they understand enough, compared with 47% in the period July 2012 to June 2014 and 43% in the period July 2010 to June 2012.
Figure 3: “I feel I understand enough about pensions to make decisions about saving for retirement”
Great Britain, 2010 to 2015

Source: Wealth and Assets Survey - Office for National Statistics
Notes:
- Wave 3 refers to the period July 2010 to June 2012; Wave 4 refers to the period July 2012 to June 2014. Data for periods from July 2012 are preliminary estimates
Download this image Figure 3: “I feel I understand enough about pensions to make decisions about saving for retirement”
.png (12.6 kB)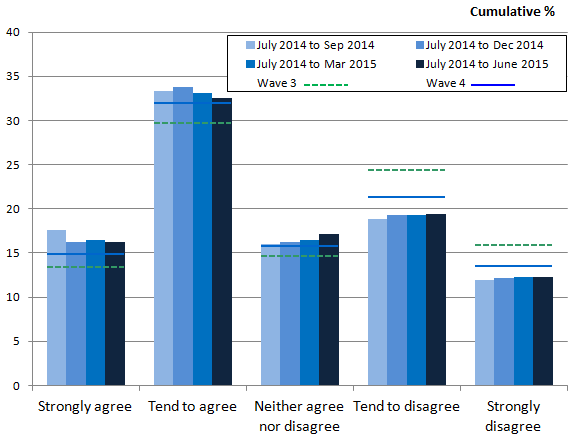
Question Name: OPens
Sometimes people save towards retirement, at different times and in different ways. What are your reasons for not currently contributing towards a pension?
CODE ALL THAT APPLY 1. low income/not working/still in education 2. too many other expenses/bills/debts 3. can’t afford to (general) 4. too early to start a pension 5. too late to start a pension 6. don't know enough about pensions 7. not interested/not thought about it/got around to it 8. prefer alternative forms of saving 9. not eligible/employer doesn't offer a pension scheme 10. employers scheme not attractive/generous 11. not staying with employer/looking for a new job/recently changed jobs 12. past pension arrangements are adequate 13. don't think I will live that long 14. do not trust pension companies/schemes 15. other 16. don't know (SPONTANEOUS ONLY)
As this question is a “code all that apply” multiple response question, each respondent can appear in any or all of the categories (1 to 15).
As contributing towards a pension will remain the main way in which most people save for their retirement, it is important to understand why people are not contributing towards a pension and whether such reasons are changing.
However, it is important to note that this data only reflects the opinion of those people who do not have pensions so it does not take into account that many may have started a pension between waves and are therefore now excluded from the latest data.
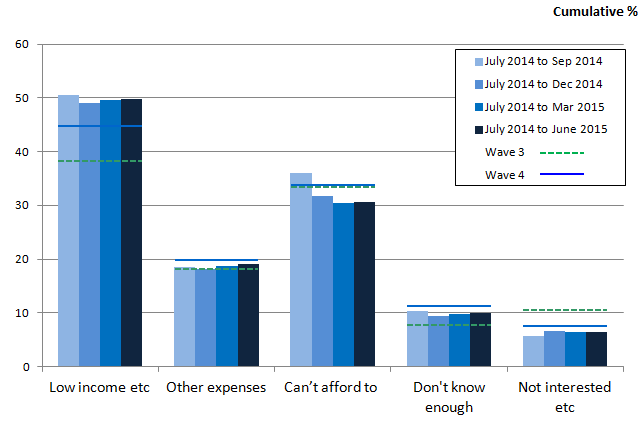
Figure 4 displays the most frequently reported reasons for not contributing to a pension. Having a low income, not working or still being in education remains the most popular reason with half (50%) of the respondents asked in the period July 2014 to June 2015 providing this answer compared with 38% in the period July 2010 to June 2012. This corresponds with the high response of not being able to afford paying into a pension, which nearly a third of respondents stated in the period July 2014 to June 2015. There has also been a notable decline between waves in those not being interested or having thought about contributing to a pension, as response has fallen gradually since July 2010 to June 2012 by 5 percentage points.
Figure 4: Reasons for not contributing to a pension
Great Britain, 2010 to 2015
Source: Wealth and Assets Survey - Office for National Statistics
Notes:
- Wave 3 refers to the period July 2010 to June 2012; Wave 4 refers to the period July 2012 to June 2014. Data for periods from July 2012 are preliminary estimates
Download this image Figure 4: Reasons for not contributing to a pension
.png (14.5 kB)
Variable Name: PExpRet
At what age do you expect to retire (from your main job)?
ENTER AGE Less than 55 55 to 59 60 to 64 65 to 69 70 to 74 75 or more
This question has always been included on the WAS questionnaire to give an indication of people’s expectation of when they will retire if they are working, or not retired, or intend to work in the future. This was not really expected to change unless pension reforms were announced. As recent pension policy reforms have included a gradual increase to the age at which state pensions could be claimed, this question could help to give us an indication of changes in people’s expectation of when they will retire.
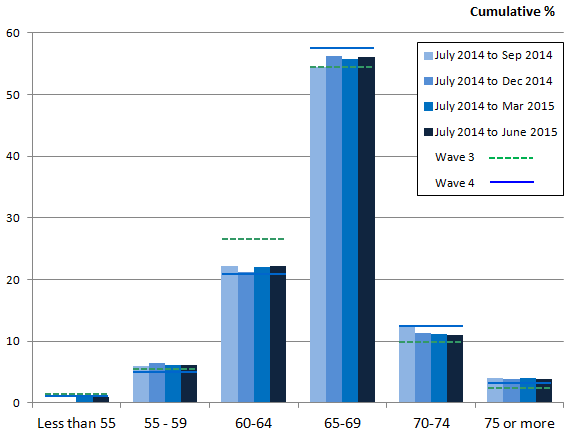
In the preliminary data for the period July 2014 to June 2015, there is less of an effect in the change in expected retirement age than that seen between July 2010 to June 2012 and July 2012 to June 2014 (see Figure 5). The effect of such an announcement is evident in the time series of data, with the expected retirement age increasing across waves; the proportion of respondents expecting to retire between the ages of 60 and 64 falling from 27% in July 2010 to June 2012 to 22% in July 2014 to June 2015. In the period July 2014 to June 2015, 15% of respondents stated they expect to retire from their main job later in life, aged 70 or over compared with 12% in July 2010 to June 2012.
Figure 5: At what age do you expect to retire (from your main job)?
Great Britain, 2010 to 2015
Source: Wealth and Assets Survey - Office for National Statistics
Notes:
- Wave 3 refers to the period July 2010 to June 2012; Wave 4 refers to the period July 2012 to June 2014. Data for periods from July 2012 are preliminary estimates
- Data has been suppressed if the unweighted sample counts are less than 30 respondents
Download this image Figure 5: At what age do you expect to retire (from your main job)?
.png (14.1 kB)
Question Name: KnowWPR
In 2012 the government introduced a new way to encourage more people to save for their retirement. This is referred to as the “workplace pension reforms” or “automatic enrolment”.
How much, if anything, would you say you knew about the workplace pension reforms or automatic enrolment?
1. knew a great deal 2. knew a fair amount 3. knew a little 4. heard of but knew nothing 5. haven't heard of it
This question, introduced into WAS in July 2012, was designed specifically to give an indication of the public’s awareness of automatic enrolment as part of the “Workplace Pension Reforms” (WPR).
Figure 6 suggests publicity of WPR has been effective, as fewer people reported that they hadn’t heard of the changes introduced by the government. In July 2012 to June 2014, 16% of respondents reported no knowledge, compared with 10% in the period July 2014 to June 2015. However, whilst more people reported they had heard of the policy changes, they had no knowledge of what they entailed. A quarter (25%) of people answered “heard of but knew nothing” compared with 19% in the period July 2012 to June 2014.
Figure 6: How much, if anything, would you say you knew about the workplace pension reforms or automatic enrolment?
Great Britain, 2012 to 2015

Source: Wealth and Assets Survey - Office for National Statistics
Notes:
- Wave 4 refers to the period July 2012 to June 2014. Data for periods from July 2012 are preliminary estimates
Download this image Figure 6: How much, if anything, would you say you knew about the workplace pension reforms or automatic enrolment?
.png (16.1 kB)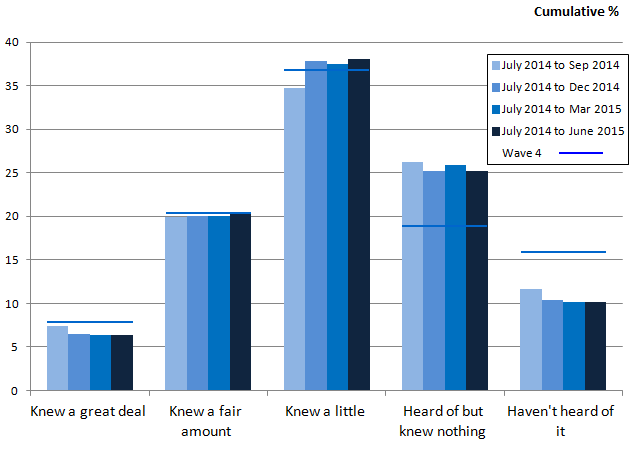
Question Name: OSavExt
Thinking back over the last 12 months, has anything in the wider world, or outside your household, influenced your decisions on pensions, savings or investments?
1. Yes 2. No
This question aims to be a direct indicator of the possible impact of any policy changes and advertising campaigns that occur during the period of the survey.
Figure 7 indicates the impact of external events has had a lessening effect since July 2010, with the largest decrease being between July 2010 to June 2012 and July 2012 to June 2014. Nearly a quarter of people (24%) answered yes to this question in July 2010 to June 2012, which could be a result of the timing of the economic downturn.
Since then, the economy has stabilised but the Bank of England base rate has remained low. In the period July 2014 to June 2015, 17% reported there had been external influences on their decisions regarding pensions, savings, or investments.
Figure 7: Thinking back over the last 12 months, has anything in the wider world, or outside your household, influenced your decisions on pensions, savings or investments?
Great Britain, 2010 to 2015

Source: Wealth and Assets Survey - Office for National Statistics
Notes:
- Wave 3 refers to the period July 2010 to June 2012; Wave 4 refers to the period July 2012 to June 2014. Data for periods from July 2012 are preliminary estimates
Download this image Figure 7: Thinking back over the last 12 months, has anything in the wider world, or outside your household, influenced your decisions on pensions, savings or investments?
.png (10.2 kB)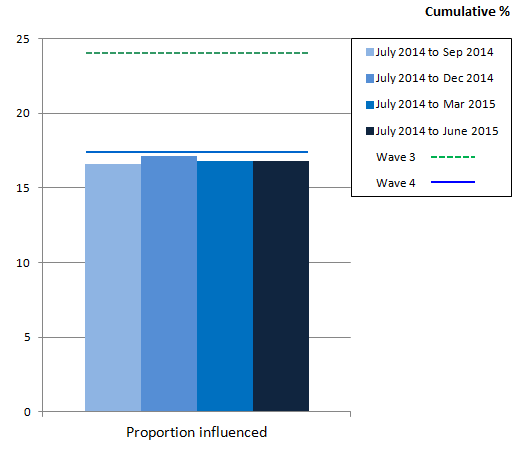
Question Name: OStandL
How confident are you that your income in retirement will give you the standard of living you hope for?
Would you say you were…
1. very confident 2. fairly confident 3. not very confident, or 4. not at all confident?
The levels of confidence that income in retirement will provide the standard of living individuals hope for were stable between July 2010 to June 2012 and July 2012 to June 2014, but early responses from July 2014 to June 2015 suggest an increase in confidence in relation to this question. Figure 8 shows over half the individuals (52%) in the period July 2014 to June 2015 felt confident that they would have sufficient income in retirement to meet their expectations compared with 41% of those asked in the period July 2012 to June 2014.
Figure 8: How confident are you that your income in retirement will give you the standard of living you hope for? Would you say you were…
Great Britain, 2010 to 2015

Source: Wealth and Assets Survey - Office for National Statistics
Notes:
- Wave 3 refers to the period July 2010 to June 2012; Wave 4 refers to the period July 2012 to June 2014. Data for periods from July 2012 are preliminary estimates
Download this image Figure 8: How confident are you that your income in retirement will give you the standard of living you hope for? Would you say you were…
.png (15.1 kB)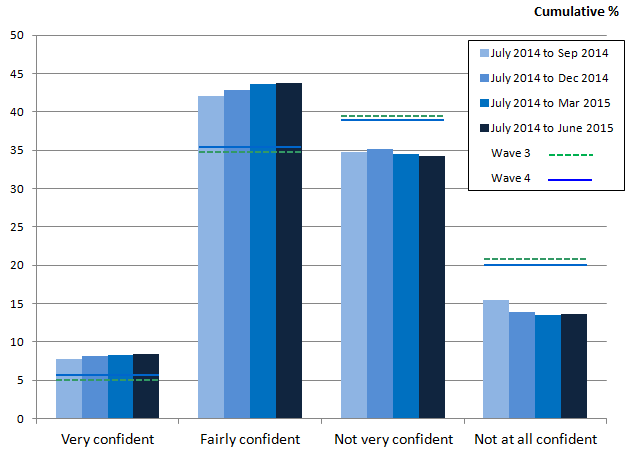
Notes for Saving for retirement
- The variable OMakeMost was previously name OSafeRe2. The survey question remains the same as only the variable name was changed
6. Credit commitments
Question Name: Commi
Which of the following statements best describes how well you are keeping up with your bills and credit commitments at the moment?
Are you…
1. keeping up with all of them without any difficulties 2. keeping up with all of them but it is a struggle from time to time 3. keeping up with all of them but it is a constant struggle 4. falling behind with some of them 5. having real financial problems and have fallen behind with many of them 6. don't have any commitments
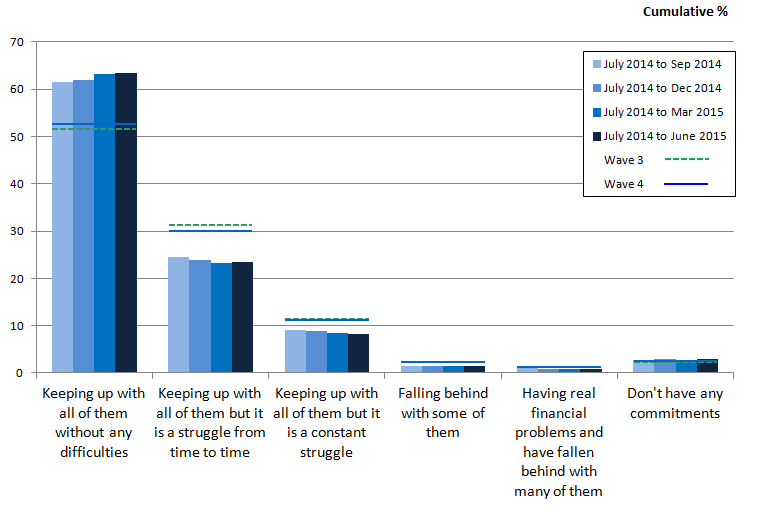
In the period July 2014 to June 2015 of the survey, 63% of individuals asked said they were keeping up with their bills and credit commitments without any difficulty, which is an increase of 10 percentage points from July 2012 to June 2014. Despite little change between July 2010 to June 2012 and July 2012 to June 2014, a larger proportion of individuals are now reporting that they are more able to keep on top of their financial commitments. See Figure 9.
Figure 9: Which of the following statements best describes how well you are keeping up with your bills and credit commitments at the moment? Are you…
Great Britain, 2010 to 2015
Source: Wealth and Assets Survey - Office for National Statistics
Notes:
- Wave 3 refers to the period July 2010 to June 2012; Wave 4 refers to the period July 2012 to June 2014. Data for periods from July 2012 are preliminary estimates
Download this image Figure 9: Which of the following statements best describes how well you are keeping up with your bills and credit commitments at the moment? Are you…
.png (21.9 kB)
7. Debt burden
Question Name: DBurd
Thinking about the non- mortgage debt you have just told me about, to what extent is keeping up with the repayment of them and any interest payments a financial burden to you?
1. Heavy burden 2. Somewhat of a burden 3. Not a problem at all
There has been a decline in the proportion of respondents who report that their financial debt is a burden. Approximately a third of people (34%) in the period July 2010 to June 2012 felt it was either a heavy or somewhat of a burden compared with 25% now in the period July 2014 to June 2015. Figure 10 illustrates this improvement, with the shift from financial debt being a burden to being no problem at all over time, being more evident since July 2014 as the results were consistent between earlier periods.
Figure 10: Thinking about the non-mortgage debt you have just told me about, to what extent is keeping up with the repayment of them and any interest payments a financial burden to you?
Great Britain, 2010 to 2015

Source: Wealth and Assets Survey - Office for National Statistics
Notes:
- Wave 3 refers to the period July 2010 to June 2012; Wave 4 refers to the period July 2012 to June 2014. Data for periods from July 2012 are preliminary estimates
Download this image Figure 10: Thinking about the non-mortgage debt you have just told me about, to what extent is keeping up with the repayment of them and any interest payments a financial burden to you?
.png (15.0 kB)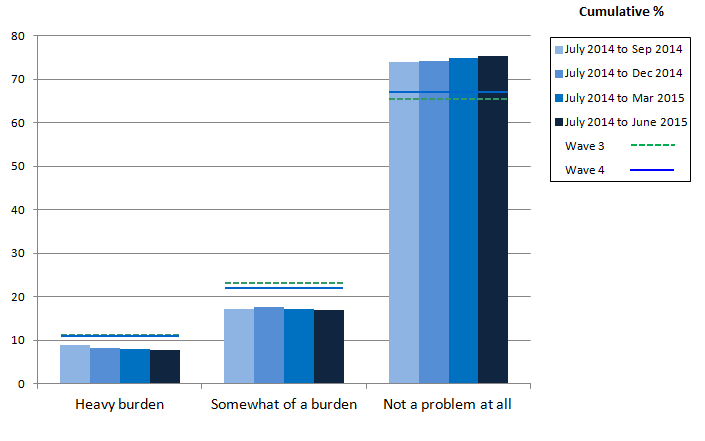
Question Name: DBurdA
Have you sought any help or advice because of debt in the last two years?
1. Yes 2. No
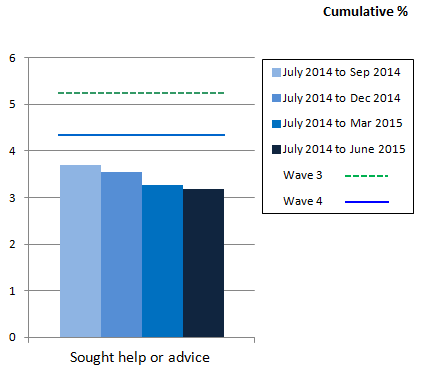
Figure 11 shows that the proportion of people seeking help and advice because of their debt has been declining steadily since July 2010 to June 2012. This could be affecting whether people are seeking support, as only 3% reported they have sought help and advice in the last 2 years in the period July 2014 to June 2015 compared with 5% in July 2010 to June 2012.
Figure 11: Have you sought any help or advice because of debt in the last 2 years?
Great Britain, 2010 to 2015

Source: Wealth and Assets Survey - Office for National Statistics
Notes:
- Wave 3 refers to the period July 2010 to June 2012; Wave 4 refers to the period July 2012 to June 2014. Data for periods from July 2012 are preliminary estimates