Table of contents
- Main points
- Summary
- Live births to UK and non-UK born women
- Total fertility rate for UK born and non-UK born women
- Country of birth of foreign born mothers
- Country of birth of foreign born fathers
- Age of mother
- Mother’s area of usual residence
- Births within marriage/civil partnership
- Live births to non-UK born women in the UK
- Reweighting of Annual Population Survey (APS) data
- Country of birth comparison tool
- Planned changes to birth publications
- Users and uses of parents’ country of birth statistics
- Further information
- References
- Background notes
1. Main points
Over a quarter of births (27.0%) in 2014 were to mothers born outside the UK, a slight increase from 2013 (26.5%)
The number of live births in England and Wales to UK born women decreased by 1.1% compared with 2013, while live births to non-UK born women rose by 1.4%
The total fertility rate (TFR) for UK born women has fallen to 1.76 from 1.77 in 2013
The TFR for non-UK born women has fallen to 2.09 from 2.13 in 2013
Poland remains the most common country of birth for non-UK born mothers between 2010 and 2014, followed by Pakistan and India
Pakistan remains the most common country of birth for non-UK born fathers between 2008 and 2014, followed by Poland and India
Newham remains the local authority with the highest percentage of births to non-UK born women (76.7%) in 2014. Torfaen has the lowest percentage (3.2%)
2. Summary
This bulletin presents annual statistics on live births in England and Wales in 2014 by parents’ country of birth. In particular, it reports the 10 most common countries of birth for non-UK born mothers and fathers, and the age of mothers by country of birth, as well as total fertility rates (TFRs) for UK born and non-UK born women. The percentage of births to non-UK born mothers is also provided at local authority level.
Parents’ country of birth statistics have been compiled from final annual birth registration data, which include all live births occurring in England and Wales in a calendar year.
This is the first time that detailed 2014 birth statistics for England and Wales on parents’ country of birth have been published. Only figures for the overall proportion of births to mothers born outside the UK have been previously published in the Birth summary tables, England and Wales, 2014 in July 2015.
Back to table of contents3. Live births to UK and non-UK born women
The total number of live births in England and Wales decreased by 0.5% in 2014 to 695,233, compared with 698,512 in 2013. This decrease in births resulted from a 1.1% fall in live births to UK born women (5,824 fewer births) and a 1.4% rise to non-UK born women (2,535 more births).
In 2014, there were 507,587 live births to UK born mothers compared with 187,610 to non-UK born mothers. Births to non-UK born mothers accounted for 27.0% of all live births in 2014, compared with 26.5% in 2013. This is the highest proportion of births to mothers born outside the UK since information on parents’ country of birth was first collected at birth registration in 1969 (Figure 1). This proportion has increased every year since 1990, when it was 11.6%, with a marked rise since the turn of the century.
Figure 1: Percentage of live births to mothers born outside of the UK, 1969 to 2014
England and Wales
Source: Office for National Statistics
Download this chart Figure 1: Percentage of live births to mothers born outside of the UK, 1969 to 2014
Image .csv .xlsThe number of births to women born outside the UK has risen every year since 1995, apart from a small decrease in 2013. In contrast, the number of births to UK born mothers has varied over the same period, with a fall in births in the late 1990s, followed by an increase between 2002 and 2008 and fluctuating birth numbers from 2008 onwards.
Back to table of contents4. Total fertility rate for UK born and non-UK born women
2014, the estimated total fertility rate (TFR) in England and Wales (see background notes 3 and 4) for women born in the UK fell to 1.76 children per woman, from 1.77 in 2013. As in previous years, the estimated TFR for women born outside the UK but living in England and Wales was higher, at 2.09 children per woman in 2014, but 0.04 lower than in 2013. This is the lowest non-UK born TFR recorded since 2004, and follows a broadly decreasing trend.
The TFR depends on the size of the female population of childbearing age and the number of births. The TFR for UK born women remained fairly stable in 2014, as the number of births has fallen by 1.1% on the previous year and the size of the population has fallen by a similar proportion between 2013 and 2014.
Between 2007 and 2012, the number of births to non-UK born women increased annually, but because the increase in the non-UK born childbearing age population was proportionally larger than the increase in births, their estimated TFR decreased. In 2013, the number of births to non-UK born women decreased, and this further decreased their TFR.
In 2014, the number of births to non-UK born women increased slightly (by 1.4%), while the population of non-UK born women increased by 3.4%. As a result, the TFR for non-UK born women fell to 2.09 in 2014, from 2.13 in 2013 (Figure 2). The TFR has fallen despite the fact that there were more births, as the population has increased proportionally more than the number of births and so non-UK born women were having more births as a group, but fewer each on average.
Figure 2: Estimated total fertility rates and number of live births to UK born and non-UK born women, 2004 to 2014
England and Wales

Source: Office for National Statistics
Download this image Figure 2: Estimated total fertility rates and number of live births to UK born and non-UK born women, 2004 to 2014
.png (13.8 kB) .xls (27.1 kB)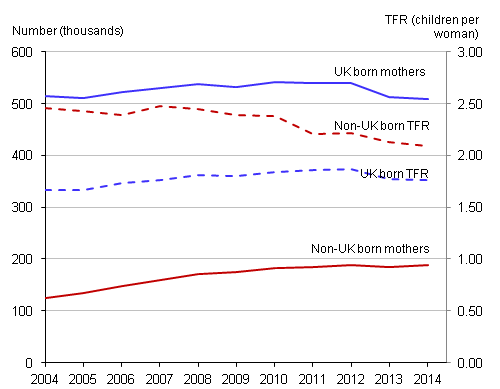
Between 2013 and 2014, the total number of UK born women of childbearing age (15 to 44) living in England and Wales decreased by 1.3%, to 8.77 million. Conversely, the number of non-UK born women of reproductive age was 3.4% higher than in 2013, increasing to 2.35 million in 2014.
There is a marked difference in the longer-term trends between the UK born and non-UK born female populations of childbearing age. Since 2005, there has been a continuous fall in the size of the population of UK born women of childbearing age (8.4% lower in 2014 than in 2005). This fall is mainly a result of the changing size of cohorts, as larger groups of women age out of the childbearing age window, to be replaced by smaller groups reaching mid-teenage ages.
In contrast, the number of non-UK born women of childbearing age has continued to increase over the same period and has increased substantially (57%) between 2005 and 2014. This increase is mainly due to increased immigration. Because non-UK born women have higher fertility, on average, than those born in the UK, their increasing population share has pushed the estimated overall TFR upwards since 2005.
The majority of women of childbearing age living in England and Wales were born in the UK (79% in 2014). As a result, UK born women continue to make the largest contribution to the overall TFR, by a large margin. It is not just recent migration that has an impact on the childbearing age population; the current size and age-structure of the foreign born population is in part determined by levels of earlier in-migration of children and younger women between the 1970s and 1990s. In addition, the descendants of past in-migrants are likely to constitute an increasing share of the UK born population (Tromans et al, 2009).
Estimated TFRs for UK and non-UK born women will be sensitive to changes in the timing of births within women’s lives. For example, research has noted that immigrant women typically have low fertility prior to immigration, followed by high fertility immediately after immigration (Toulemon, 2004). If this were also the case in England and Wales, the estimated TFR for non-UK born women could be inflated by this timing effect (Robards and Berrington, 2014).
A report on “Childbearing of UK and non-UK born women living in the UK – 2011 Census data” (ONS, 2014) shows detailed fertility estimates for 2011 for women’s individual countries of birth. Summary information from this report can be found in Table 5 of this release.
Back to table of contents5. Country of birth of foreign born mothers
In England and Wales in 2014, births to mothers born in the European Union (EU), excluding the UK, represented 9.2% of all live births (Figure 3). Births to mothers born in 1 of the 13 countries that have joined the EU since April 2004 represented the majority of these births (6.5% of all live births). Mothers born in the Middle East and Asia contributed 9.5% of all live births, while mothers born in Africa contributed 5.0%.
Figure 3: Number of live births to mothers born outside the UK, by country group, 2014
England and Wales
Source: Office for National Statistics
Notes:
- EU figures are based on the EU as constituted in 2014 for comparability. See background note 5 in the Statistical Bulletin for a list of the countries included.
Download this chart Figure 3: Number of live births to mothers born outside the UK, by country group, 2014
Image .csv .xlsIn 2014, Poland, Pakistan and India were the 3 most common countries of birth for non-UK born mothers (Table 1). Between 2001 and 2006, Pakistan, India and Bangladesh were consistently the 3 most common countries. However, in 2007, Poland replaced Bangladesh as the third most common country, rising to second place in 2008 and first place in 2010.
Table 1: 10 most common countries of birth for non-UK born mothers, by country, 2014
| England and Wales | |||
| Country of birth of mother | Number | Percentage of all live births | |
| 1 | Poland | 22,122 | 3.2 |
| 2 | Pakistan | 17,943 | 2.6 |
| 3 | India | 13,735 | 2.0 |
| 4 | Bangladesh | 7,783 | 1.1 |
| 5 | Nigeria | 7,030 | 1.0 |
| 6 | Romania | 6,102 | 0.9 |
| 7 | Lithuania | 4,786 | 0.7 |
| 8 | Germany | 4,708 | 0.7 |
| 9 | Somalia | 4,696 | 0.7 |
| 10 | China | 3,882 | 0.6 |
| Total outside the UK | 187,610 | 27.0 | |
| Source: Office for National Statistics | |||
| Notes: | |||
| 1. Figures by country include births to mothers whose usual residence is outside England and Wales. The total outside the UK excludes those births where the mother's country of birth was not stated | |||
Download this table Table 1: 10 most common countries of birth for non-UK born mothers, by country, 2014
.xls (49.7 kB)Poland appeared in the top 10 most common countries of birth for non-UK born mothers in 2005 when it was ninth. In 2003, there were 1,392 live births in England and Wales to Polish born mothers, compared with 1,830 in 2004 when Poland joined the EU and 22,122 in 2014.
Between the year ending December 2003 and the year ending December 2014, the estimated total Polish born population of the UK increased from 75,000 (ONS, 2011) to 790,000 (ONS, 2015a). It should be noted that when you look at the populations of the A8 countries that joined the EU in 2004 (Poland, Czech Republic, Estonia, Hungary, Latvia, Lithuania, Slovakia and Slovenia), Poland accounts for more than half of the total population of those countries (see international comparisons within the Eurostat database). This partially explains why the Polish-born population in the UK has increased so much more than that of other countries.
In 2014, Romania was the sixth most common country of birth for non-UK born mothers, rising from ninth position in 2012. Romania first appeared in the top 10 non-UK countries of birth of mother in 2012 when it replaced China (figures available back to 2001), having gradually increased in the rankings. In 2006, there were 772 live births in England and Wales to Romanian born mothers, compared with 1,248 in 2007 (when Romania joined the EU) and 6,102 in 2014. Between the year ending December 2006 and the year ending December 2014, the estimated total Romanian born population of the UK increased from 17,000 (ONS, 2015b) to 170,000 (ONS, 2015a).
The top 10 non-UK countries of birth of mother have remained fairly similar across the 10-year period since 2004, with 6 countries remaining constant: Pakistan, India, Bangladesh, Nigeria, Germany and Somalia. The United States left the top 10 in 2005, Ireland in 2007, Ghana in 2011 and South Africa in 2014. China entered the top 10 for 2009 and 2011, before re-entering the top 10 in 2014.
The diverse fertility levels of migrants born in different countries are important when analysing the impact of migration on fertility in recent years. The report on “Childbearing of UK and non-UK born women living in the UK, 2011” (ONS, 2012) examined fertility patterns in the UK for UK born and non-UK born mothers in the period 2007 to2011, using Annual Population Survey (APS) data. Figures within the report are not directly comparable to fertility rates reported in this release due to reweighting of the APS data (for more information see the Reweighting of Annual Population Survey data section). The report includes an investigation of fertility patterns at the country level, and also of specific non-UK maternal countries of birth.
A similar but more recent report on “UK and non-UK born women living in the UK – 2011 Census data” (ONS, 2014) covers just England and Wales. Figures in that report are therefore not directly comparable to fertility rates reported in this release, as they use population data obtained from different sources (APS in this release and 2011 Census in the report). However, the use of census data does allow for more detailed examination of individual countries of birth with a greater level of precision (Table 5 of Parents’ country of birth (472.5 Kb Excel sheet) shows some summary information from that report).
Table 5 (472.5 Kb Excel sheet) shows that the TFRs for women born in different parts of the world but living in England and Wales vary widely, from very low levels such as those for women born in Australasia (TFR of 1.3 in 2011) to much higher levels such as those for women born in North Africa (3.9 in 2011). This table also provides comparable TFRs for 2001, which can give added insight into specific fertility trends. Further breakdowns, including by individual country, can be found in the table published alongside the 2014 report (ONS 2014).
Back to table of contents6. Country of birth of foreign born fathers
In 2014, there were 175,118 babies born to non-UK born fathers, which represents 26.6% of live births where the fathers’ country of birth was stated. This includes a smaller proportion (19.7%) of babies that had both parents born outside the UK. Information for fathers is not available for births registered solely by the mother (5.4% of all live births in 2014).
The top 10 most common countries of birth of non-UK born fathers consisted of the same countries between 2008 and 2014, with the exception of Romania, which replaced Ghana in 2012 after gradual increases in ranking. Pakistan was the most common country of birth in 2014, followed by Poland, India and Bangladesh (Table 2). The top 10 countries of birth of non-UK born fathers in 2014 are similar to those of non-UK born mothers, with the inclusion of South Africa and Sri Lanka rather than Lithuania and China, and some differences in rankings.
Table 2: 10 most common countries of birth for non-UK born fathers, by country, 2014
| England and Wales | |||
| Country of birth of father | Number | Percentage of all live births | |
| 1 | Pakistan | 19,601 | 3.0 |
| 2 | Poland | 16,950 | 2.6 |
| 3 | India | 13,639 | 2.1 |
| 4 | Bangladesh | 8,534 | 1.3 |
| 5 | Nigeria | 8,467 | 1.3 |
| 6 | Romania | 5,414 | 0.8 |
| 7 | Somalia | 4,334 | 0.7 |
| 8 | Germany | 3,988 | 0.6 |
| 9 | South Africa | 3,744 | 0.6 |
| 10 | Sri Lanka | 3,509 | 0.5 |
| Total outside the UK | 175,118 | 26.6 | |
| Source: Office for National Statistics | |||
| Notes: | |||
| 1. The percentage of births to fathers born outside the UK is calculated using the total number of live births excluding those births where the father's country of birth was not stated. | |||
| 2. Figures by country include births to fathers whose usual residence is outside England and Wales. | |||
| 3. The Human Fertilisation and Embryology Act 2008 contained provisions enabling 2 females in a same sex couple to register a birth from 1 September 2009 onwards. Due to the small numbers, births registered to a same sex couple (990 in 2014) are included in the figures, with the country of birth of the second female parent being included under the country of birth of father. | |||
Download this table Table 2: 10 most common countries of birth for non-UK born fathers, by country, 2014
.xls (49.7 kB)7. Age of mother
In 2014, the most common age group of both UK born mothers (30%) and non-UK born mothers (35%) was 30 to 34 years (Figure 4). A much higher proportion of UK born mothers were aged under 25 (23%) in comparison to foreign born mothers (12%). This is a similar pattern to recent years. This reflects the lower proportion of women aged under 25 in the non-UK born population of childbearing age.
Figure 4: Percentage of live births by age of mother, UK and non-UK born mothers, 2014
England and Wales
Source: Office for National Statistics
Download this chart Figure 4: Percentage of live births by age of mother, UK and non-UK born mothers, 2014
Image .csv .xls8. Mother’s area of usual residence
In 2014, the region with the highest percentage of live births to mothers born outside the UK was London (58.1%). The North East had the lowest percentage (10.6%). London and the North East have, since 2001, consistently shown the highest and lowest percentages respectively of live births to mothers born outside the UK.
Since 2004, Newham has been the local authority with the highest percentage of births to non-UK born mothers. In 2014, over three-quarters of births (76.7%) were to non-UK born mothers. Outside of London, Slough had the highest percentage in 2014 (60.8%), followed by Luton (56.1%). Slough has had the highest percentage of births to non-UK born women outside of London for over 11 years. Luton replaced Forest Heath to become the area with the second highest percentage of births to non-UK born mothers in 2007. The area with the lowest percentage of births to mothers born outside the UK in 2014 was Redcar and Cleveland, with 3.7%. In 2013, South Staffordshire had the lowest percentage.
In Wales, the percentage of live births to foreign born mothers in 2014 was 10.9%. Of the local authorities in Wales, Cardiff had the highest percentage of births to mothers born outside the UK (24.7%) and Torfaen had the lowest (3.2%). Cardiff and Torfaen also had the highest and lowest percentages respectively in 2013.
Geographical variations in the proportion of births to mothers born outside the UK are to be expected, due to local differences in the proportion of people born outside the UK. This can be seen in the indicators of migration at local authority level (ONS, 2015c). In addition, the composition of the foreign born population, in terms of individual countries of birth, will vary considerably between local authorities.
Back to table of contents9. Births within marriage/civil partnership
In 2014, a much higher proportion of births to non UK-born women took place within marriage/civil partnership (72%) than for UK-born mothers (45%) (Figure 5). This is a similar pattern to previous years. There is considerable variation in the proportion of births within marriage/civil partnership depending on the country of birth of the mother. For example, 97% of births to mothers born in India took place within marriage/civil partnership in 2014, in comparison to 37% of births to mothers born in the Caribbean. These variations reflect different societal expectations between cultures, for example, the acceptability of cohabitation.
Figure 5: Percentage of live births within marriage/civil partnership, by country group of birth of mother, 2014
England and Wales
Source: Office for National Statistics
Notes:
- EU figures are based on the EU as constituted in 2014 for comparability. See background note 5 in the Statistical Bulletin for a list of the countries included.
Download this chart Figure 5: Percentage of live births within marriage/civil partnership, by country group of birth of mother, 2014
Image .csv .xls10. Live births to non-UK born women in the UK
The percentage of live births to non-UK born women living in the UK was 25.7% (199,883 births).
For comparison, Scotland was 16.2% (9,178 births) and Northern Ireland was 12.7% (3,095 births).
Back to table of contents11. Reweighting of Annual Population Survey (APS) data
This publication contains the first estimates of UK and non-UK born women’s fertility rates to use population estimates rebased to take into account the 2011 Census results. As a result, the figures here supersede those published in previous years for fertility between 2004 and 2013.
The reweighting of APS data resulted in consistently larger populations of women of childbearing ages. Combined with fixed births numbers, this has resulted in small decreases to the TFRs for both UK born and non-UK born women, compared with previously published estimates. A summary of these differences can be found in Table 3.
Table 3: Difference in TFRs caused by the reweighting of Annual Population Survey data following the 2011 Census
| England and Wales | |||||||||||
| Difference | 2004 | 2005 | 2006 | 2007 | 2008 | 2009 | 2010 | 2011 | 2012 | 2013 | 2014 |
| UK born | -0.02 | -0.01 | -0.03 | -0.04 | -0.04 | -0.05 | -0.04 | -0.04 | -0.03 | -0.02 | 0.00 |
| Non-UK born | -0.04 | -0.01 | -0.03 | -0.06 | -0.07 | -0.09 | -0.07 | -0.08 | -0.07 | -0.06 | 0.00 |
| Total | -0.02 | -0.01 | -0.03 | -0.03 | -0.05 | -0.05 | -0.05 | -0.04 | -0.03 | -0.03 | 0.00 |
| Source: Office for National Statistics | |||||||||||
Download this table Table 3: Difference in TFRs caused by the reweighting of Annual Population Survey data following the 2011 Census
.xls (53.8 kB)12. Country of birth comparison tool
This release is accompanied by the first release of a new country of birth comparison tool that we have created to aid interpretation of the births dataset. This comparison tool (205.5 Kb Excel sheet) allows the comparison of births to women born in selected countries of birth (the top 50 in England and Wales in this first release). A suite of indicators are provided to aid research and we are keen to hear any feedback about how this tool can be improved. Please email fertility@ons.gov.uk.
The dashboard allows you to select 2 countries of birth to compare, and a range of graphs showing characteristics of births to women born in the 2 countries are generated automatically, so you can easily see similarities and differences.
Currently this dashboard produces a range of indicators (by country of birth) including:
number of births to mothers from a specific country of birth
number of births to fathers from a specific country of birth
2011 TFR using census populations
mean age of mother
percentage of births within marriage
percentage of births to sole parents
percentage of births that are to previously childless women
mean age gap between parents
13. Planned changes to birth publications
From the 2014 data year, there will be some changes to the published packages. Packages that will remain unchanged are:
From October 2015 a number of births packages will be combined into two packages: Birth characteristics and Births by parents’ characteristics. Details of what will be included in these packages are shown below:
Birth characteristics – will provide summary statistics on stillbirths, including birthweight data for live and stillbirths by mother's area of usual residence and maternities, live births, and stillbirths in hospitals by area of occurrence. These tables will also provide live birth statistics by month and quarter of occurrence, and maternity figures for multiple births and by place of birth. Prior to the 2014 data year these statistics were published in separate releases: Characteristics of birth 1 and Characteristics of birth 2;
Births by parents’ characteristics – will provide live birth, stillbirth and maternity statistics by age of mother, type of registration (within marriage/civil partnership, joint, sole), and mean age of mother by birth order. It will also provide live birth statistics (numbers and rates) within and outside marriage/civil partnership, data on live births by age of mother and number of previous live-born children along with median birth intervals. Prior to the 2014 data year these statistics were published in separate releases: Characteristics of mother 1, Characteristics of mother 2 and Further parental characteristics
14. Users and uses of parents’ country of birth statistics
The Office for National Statistics uses data on parents’ country of birth to:
report on social and demographic trends
analyse recent trends in births to UK and foreign born women
The Home Office is n important user of birth statistics by parents’ country of birth. Data are used to inform policy decisions and help to estimate the size of migrant communities. Other important users of the data are local authorities and other government departments who use the data to inform planning and resource allocation. ONS is collaborating with the Cabinet Office to inform migration debate in government.
Other users include academics, demographers and health researchers who conduct research into trends and characteristics. Lobby groups use the statistics to support their cause or campaign; for example, organisations supporting parents from black and minority ethnic groups’ access to maternity services. The media also report on main trends and statistics.
Back to table of contents