Table of contents
- Key findings
- New European Standard Population 2013
- Summary
- Results
- All malignant neoplasms (tumours): number of newly diagnosed cases, 2012
- All malignant neoplasms: incidence rates by sex and age group, 2012
- All malignant neoplasms: frequency distribution by sex and age group, 2012
- All malignant neoplasms: standardised registration by region, 2012
- Number of registrations by major sites, 2012
- Cancer registrations, 1971 to 2011
- Cancer registrations: interpretation and data quality
- Users and uses of cancer statistics
- Policy context
- Additional information
- References
- Acknowledgements
- Background notes
- Methodology
1. Key findings
The three most common cancers for men in 2012 remained prostate (25.9%), lung (13.6%) and colorectal (13.4%)
The three most common cancers for women in 2012 remained breast (30.9%), lung (11.9%) and colorectal (10.9%)
Liver cancer incidence has increased by 70% for males and 60% for females from 2003 to 2012. This is now the 18th most common cancer in England
Malignant melanoma, a type of skin cancer, has increased by 78% among males and 48% among females from 2003 to 2012. This is now the fifth most common cancer in England
Cancer incidence was more than 5% higher than expected in the north of England (North East and North West), and more than 5% lower than expected in London
2. New European Standard Population 2013
The age-standardised cancer incidence rates produced in this report and in the associated reference tables have been calculated using the new 2013 European Standard Population (ESP). Eurostat updated the ESP for the first time since it was introduced in 1976, to make it more representative of the current population in Europe (Eurostat, 2013). For almost all cancers, the age-standardised cancer incidence rates for registrations are higher when calculated using the 2013 ESP, and for some cancers, this change is large. This is because the age distributions of diagnoses differ depending on the type of cancer. More information about the impact of this change can be found on the ONS website.
Back to table of contents3. Summary
This publication presents data for England on those patients who were diagnosed with cancer during 2012 and whose registrations were received at the Office for National Statistics (ONS) by the end of February 2014. This is the first time that ONS has published 2012 statistics on cancer incidence in England.
Back to table of contents4. Results
The three most common cancers, 2012
In the International Classification of Diseases, Tenth Revision (ICD-10), there are 88 three-digit site codes relating to malignant neoplasms (tumours): of these, four relate to males only and eight to females only. For both males and females three cancer sites (different ones for each sex) constituted just over half of the total registrations in 2012. The most common cancer site for males was prostate, and for females breast. The second and third most common cancers for both males and females were lung and colorectal cancer. The number of registrations for each of these cancer sites is shown in Table A.
Table A: The three most common cancers, England, 2012
| ICD-10 code | Site description | Number of registrations | % of total malignancies |
| Males | |||
| C61 | Prostate | 37,136 | 25.9 |
| C33-C34 | Trachea, bronchus and lung | 19,547 | 13.6 |
| C18-C20 | Colorectal | 19,286 | 13.4 |
| Total | 75,969 | 53.0 | |
| All malignancies1 | 143,406 | 100.0 | |
| Females | |||
| C50 | Breast | 42,489 | 30.9 |
| C33-C34 | Trachea, bronchus and lung | 16,356 | 11.9 |
| C18-C20 | Colorectal | 15,036 | 10.9 |
| Total | 73,881 | 53.6 | |
| All malignancies1 | 137,712 | 100.0 | |
| Source: Office for National Statistics | |||
| Notes: | |||
| 1. Excluding non-melanoma skin cancer (ICD-10 C44) | |||
Download this table Table A: The three most common cancers, England, 2012
.xls (34.3 kB)Breast cancer is the most common cancer in females, accounting for just under one-in-three newly diagnosed cases of cancer in 2012. The main risk factor for breast cancer, after gender, is age: 80% of all new cases of breast cancer diagnosed among women in 2012 were among those aged 50 and over (see Table 1 of the reference tables associated with this publication (1.66 Mb Excel sheet)). It is estimated that about 27 per cent of cases of female breast cancer in the UK are linked to lifestyle and environmental factors, such as alcohol consumption, obesity, lack of physical activity, and hormonal and reproductive factors (Parkin, Boyd and Walker, 2011). The age-standardised incidence rate for breast cancer has remained fairly stable over the past ten years (Table 9 (1.66 Mb Excel sheet).
Prostate cancer accounted for just over one-in-four newly diagnosed cases of cancer in males in 2012. Prostate cancer incidence has increased greatly since the early part of the 1990s, largely reflecting improvements in diagnosis from increased use of Prostate-Specific Antigen (PSA) testing (Quinn, Babb, Brock et al, 2001). Between 2003 and 2012 the age-standardised rate increased by 6% (Table 9 (1.66 Mb Excel sheet), when calculated using the new European Standard Population. The strongest risk factor for prostate cancer is age: 89% of all new cases in 2012 were in those aged 60 and over (Table 1 (1.66 Mb Excel sheet).
Lung cancer was the second most common cancer among both men and women in 2012, accounting for 14% and 12% of all newly diagnosed cases respectively. Since 2003 the age-standardised incidence rate has decreased by 8% among males but has increased by 18% among females (Table 9 (1.66 Mb Excel sheet). The majority of lung cancer cases occur as a result of tobacco smoking, with around one fifth of cases in the UK being attributable to diet and occupational exposures (Parkin, Boyd and Walker, 2011. While men remain more likely to smoke than women, the gap has narrowed: whereas 51% of men and 41% of women smoked in 1974, 22% of men and 19% of women smoked in 2012 (Office for National Statistics, 2013).
Colorectal (or bowel) cancer was the third most common cancer in both males and females in 2012. The age-standardised incidence rate for colorectal cancer has remained fairly stable for both sexes over the past ten years (Table 9 (1.66 Mb Excel sheet). As with many cancers, the biggest risk factors for bowel cancer are age and family history (Cancer Research UK, 2012). In 2012, 71% of newly diagnosed cases in men, and 73% of those in women, were among those aged 65 and older (Table 1 (1.66 Mb Excel sheet).
Full details of registrations of newly diagnosed cases of cancer by site, sex and age group are presented in Table 1 (1.66 Mb Excel sheet of the reference tables associated with this publication.
Back to table of contents5. All malignant neoplasms (tumours): number of newly diagnosed cases, 2012
Registrations of non-malignant skin cancer (nmsc, ICD-10 C44) are excluded from the figures in the commentary that follows, as experts have advised that it is greatly under-registered.
There were 143,406 new cases of cancer registered for males and 137,712 new cases registered for females in England in 2012. This represents an age-standardised incidence rate of 668 new cases per 100,000 men and 530 new cases per 100,000 women, calculated using the new European Standard Population. Since 2003, the age-standardised incidence rate has increased by 3% for males and 6% for females (Tables 8 and 9 of the reference tables (1.66 Mb Excel sheet). Much of this increase is due to people living longer: as age increases so does the incidence of cancer.
Back to table of contents6. All malignant neoplasms: incidence rates by sex and age group, 2012
Cancer is predominantly a disease of the elderly. The overall crude rates of cancer registrations (C00–C97 excluding non-melanoma skin cancers (nmsc)) are 545 new cases per 100,000 population for males and 507 new cases per 100,000 population for females. However, this conceals wide differences between the sexes and across the age groups, as illustrated in Figure A. Following the small decrease in rates after early childhood, rates increased continuously with age for both males and females, but decreased again for females at age group 90 years and over. From the 25 to 29 age group up to the 55 to 59 age group, rates of cancer were higher in females than in males, and in the 40 to 44 and 45 to 49 age groups, the rate in females was more than double that for males. Much of this difference is due to the high incidence of breast cancer among women in these age groups: in 2012 breast cancer accounted for 44% of all malignant cancers (excluding nmsc) among women aged 25-59. Rates of cancer were higher in males than females from the 60 to 64 age group onwards: males were 19% higher in the 60 to 64 age group and 78% higher in the 90 years and over age group.
Figure A: All malignant neoplasms: incidence rates by sex and age group, England, 2012
Source: Source: Office for National Statistics
Notes:
- Excluding non-melanoma skin cancer (ICD-10 C44)
Download this chart Figure A: All malignant neoplasms: incidence rates by sex and age group, England, 2012
Image .csv .xlsThe numbers on which Figure A is based are presented in Table 2 (1.66 Mb Excel sheet) of the reference tables associated with this publication.
Back to table of contents7. All malignant neoplasms: frequency distribution by sex and age group, 2012
Figure B shows the frequency distribution by sex and age group for cancer registrations in 2012. Excluding non-melanoma skin cancers (nmsc), only 1,156 (0.4 per cent) of all malignancies occurred in children aged under 15 years, with the most common of these being leukaemias (ICD-10 C91–C95, 388 malignancies, 34% of all malignancies in children aged under 15). From the 20 to 24 years age group to the 55 to 59 years age group, the higher percentage of cancers in females than males was mainly due to the incidence of cancers of the breast (ICD-10 C50), cervix (ICD-10 C53) and ovary (ICD-10 C56 – C57). Cancers in those aged under 45 years accounted for 5% of the total for males and 9% for females.
There was a clear peak in the age group frequency distribution for males and females, with the greatest percentage of cancer registrations being recorded for those aged 65 to 69 years.
Figure B: All malignant neoplasms: frequency distribution by sex and age group, England 2012
Source: Source: Office for National Statistics
Notes:
- Excluding non-melanoma skin cancer (ICD-10 C44)
Download this chart Figure B: All malignant neoplasms: frequency distribution by sex and age group, England 2012
Image .csv .xlsThe numbers on which Figure B is based are presented in Table 1 (1.66 Mb Excel sheet) of the reference tables associated with this publication.
Back to table of contents8. All malignant neoplasms: standardised registration by region, 2012
Standardised registration ratios (SRRs) allow regions to be compared, with the registration rates for England being taken as standards. If a regional cancer incidence rate is high compared with the national rate, then the observed incidence for that region will be higher than the expected incidence and the SSR will be greater than 100. If a regional cancer incidence rate is lower than the national rate, then the SSR will be lower than 100. For example, if an SRR for a particular region was 106, this would mean the cancer incidence in that region was 6% higher than expected, compared to England as a whole. Conversely, an SSR of 94 would mean the cancer incidence was 6% lower.
Figure C presents SSRs for each region in England, for 2012. This shows that actual cancer incidence was more than 5% higher than the expected incidence in the north of England (North East and North West), compared with the England baseline. Cancer incidence was more than 5% lower than expected in London.
SRRs should be interpreted with caution because it is difficult to separate the effect of variation in levels of ascertainment of cases across the different regions of England from genuine geographical differences in incidence. However, it is recognised that there are generally higher levels of deprivation in the north of England than in the south (Communities and Local Government, 2011) and increased incidence rates of many cancers has been associated with higher levels of deprivation (National Cancer Intelligence Network, 2008, Shack, Jordon, Thomson et al, 2008 "Shack, Jordon, Thomson et al, 2008").
Figure C: All malignant neoplasms: standardised registration ratios by region, England, 2012

Source: Office for National Statistics
Download this image Figure C: All malignant neoplasms: standardised registration ratios by region, England, 2012
.png (18.6 kB)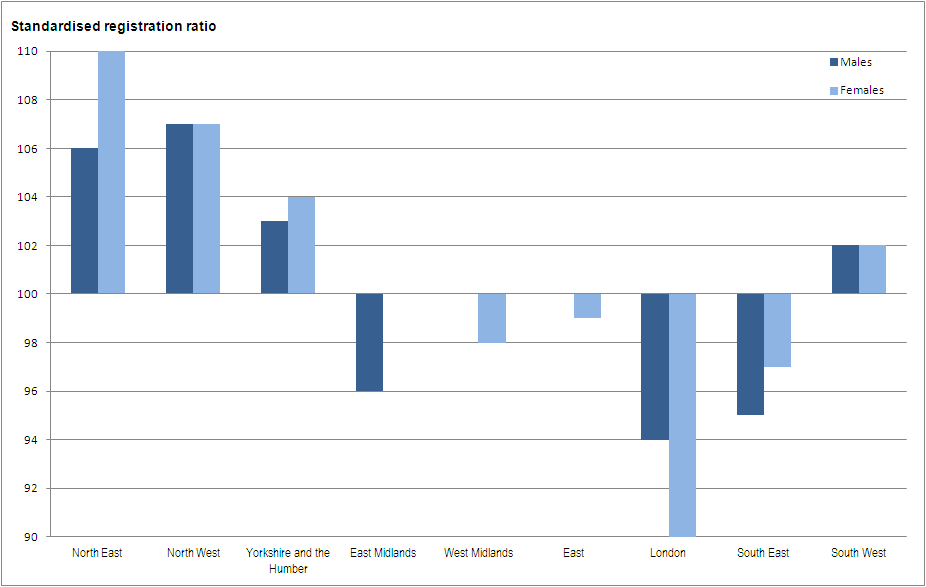
- Excluding non-melanoma skin cancer (ICD-10 C44)
The numbers on which Figure C is based are presented in Table 5 (1.66 Mb Excel sheet) of the reference tables associated with this publication.
Back to table of contents9. Number of registrations by major sites, 2012
Figure D shows the number of registrations for 24 major sites for males and females in 2012. These registrations represented 93% and 92% of the total number of registrations for males and females respectively.
Previous editions of the MB1 release reported on different numbers of 'common cancer' sites. For the editions 1992 through 1998 the focus was on 20 major sites, increasing to 21 in 1999 when Hodgkin's disease was added to the list. Whilst year on year consistency is helpful in analysing trends, relative changes in incidence have now warranted the inclusion of additional cancer sites, namely liver (C22), mesothelioma (C45) and thyroid gland (C73). In addition, the ICD codes used to define some of the other major sites have been adjusted in order to ensure consistency across other outputs.
Figure D: Number of registrations by major sites, England, 2012
Source: Office for National Statistics
Notes:
- Excluding non-melanoma skin cancer (ICD-10 C44)
Download this chart Figure D: Number of registrations by major sites, England, 2012
Image .csv .xlsSince 2003, there have been large increases in the number of registrations of liver, oral, uterine and kidney cancers, and malignant melanoma of the skin (Table 9 (1.66 Mb Excel sheet)). These cancers are strongly linked to lifestyle choices, such as smoking, alcohol consumption and obesity (Parkin, Boyd and Walker, 2011).
Liver cancer incidence has increased by 70% among males and 60% among females since 2003, which means it is now ranked as the 18th most common cancer in England. The main risk factors for developing liver cancer are hepatitis B or C infection. The attributable risk estimates for the combined effects of these infections account for well over 80% of liver cancer cases worldwide (Bosch et al., 2004 "Bosch et al., 2004"). Alcohol consumption and diabetes are other risk factors (Giovannucci et al., 2010 "Giovannucci et al., 2010").
Malignant melanoma incidence has increased by 78% among males and 48% among females since 2003. These increases are considered to be due to changes in exposure to solar UV rays as a result of altered patterns of behaviour in recent decades, such as choice of clothing and recreational sunbathing (Parkin, Mesher and Sasieni, 2011).
There have been large decreases in the incidence of stomach cancer over recent decades. Since 2003, the decrease has been 15% and 25% respectively, for males and females. This corresponds with a fall in stomach cancer incidence across numerous countries worldwide over the last 50 years. This decline is thought to be associated with a reduction in Helicobacter pylori infection and changes in diet in developed countries. The widespread use of refrigeration (allowing consumption of more fresh vegetables and less salt preserved foods) is another possible factor contributing to the decline (Howson et al., 1986).
The numbers on which Figure D is based are presented in Table 1 (1.66 Mb Excel sheet) of the reference tables associated with this publication.
Back to table of contents10. Cancer registrations, 1971 to 2011
Cancer registrations for England are submitted to ONS by the the National Cancer Registration Service in Public Health England. These data are then loaded onto a database and validated. The extensive checks include the compatibility of the cancer site and the associated histology, and are closely based on those promoted by the International Agency for Research on Cancer (IARC, Parkin, Chen, Ferlay et al, 1994). Once all the expected records for any one incidence year have been received and validated, detailed tables are published (see ‘Results’ section) on the numbers and rates of all types of cancer by age and sex, and by region of residence.
Registration of cases of cancer is a dynamic process in the sense that the data files, both in the cancer registries and at ONS, are always open. Cancer records may be amended: for example the site code would be modified should later and more accurate information become available. The date of death is added to the record for those cases registered when the person was alive. Although relatively unusual, records may be cancelled. Also, complete new ‘late’ registrations may be made after either the cancer registry or ONS, or both, have published what were thought at the time to be virtually complete results for a particular year.
Refreshing the database means that current numbers of registrations are generally greater than the published figures. The balance between ensuring completeness of the data but publishing tables in a timely manner is necessarily a compromise. The gap between the data year and production of tables has varied considerably over time, which results in varying proportions of additional cancer registrations held on the ONS database in comparison with the numbers published in the corresponding annual report (MB1 series), as shown in Figure E. Over the 41-year period reported, differences between published and current numbers of registrations for each year average less than 5%.
Figure E: Number of registrations published in the annual report (MB1 series) and currently on the National Cancer Registry database, England, 1971–2011
Source: Source: Office for National Statistics
Notes:
- Figures for 1971 to 1989 have been extracted from the 'frozen' historical data set published in 2012, and are therefore the same as those published in this series last year
- The published figures for 1971 to 1978 correspond to all malignancies, not all registrations
- Figures at March 2014
Download this chart Figure E: Number of registrations published in the annual report (MB1 series) and currently on the National Cancer Registry database, England, 1971–2011
Image .csv .xls11. Cancer registrations: interpretation and data quality
It is estimated that the 2012 cancer registrations reported in this publication are around 99% complete (see Background Note 5). It is expected that the remaining 1% of cancer registrations for 2012 will be received over the next few years.
Some regions are not always able to collect complete information about benign, uncertain and unknown neoplasms and therefore these registration rates are almost certainly underestimates of the true incidence. This should be noted when interpreting regional differences.
A specific example of variation in completeness of registration applies to cancer of the eye. Registrations of eye cancer appear to have increased noticeably in 2012 compared to 2011. This is because a number of 2011 eye cancer registrations were submitted by the National Cancer Registry Service too late to be included in the ‘Cancer Registration Statistics, England, 2011’ report, and too late to be included in the updated 2011 figures reported here. As there are only small numbers of cases of eye cancer, this resulted in a large percentage increase in registrations. These late registrations for 2011 will be included in the next annual report (June 2015).
In 2012, registrations of cervical cancer have continued to decline from a peak in 2009, when more women attended cervical cancer screening appointments following the diagnosis of a young celebrity with cervical cancer. In addition, there are known changes in respect of one of the data providers in Yorkshire, which explain the change in incidence in this region.
Increases in the number of registrations of skin cancer and mesothelioma reflect actual changes in incidence patterns.
ONS has been advised by expert epidemiologists and members of the former Steering Committee on Cancer Registration that non-melanoma skin cancer (ICD-10 C44) and carcinoma in situ of skin (ICD-10 D04) are greatly under registered. Registration varies widely depending on a registry’s degree of access to out-patient and general practitioners records. This should be noted when interpreting these figures, particularly when considering changes over time.
During 2013, the English regional registries completed the migration onto one national cancer registration system (NCRS). Use of this single system will ensure that all cancer registries record cancer incidence data using a consistent approach. Four of the registries completed this migration in 2012, with the remaining four completed in 2013.
Despite the advantages of a single NCRS, the migration process created a considerable additional workload for the national cancer registration service. In some instances, this resulted in a lack of time for quality assurance work to be carried out as thoroughly as in previous years. For example, one indicator of quality is the percentage of cases that are registered solely from the information on a death certificate, known as Death Certificate Only (DCO) registrations. With these cases, the incidence date is unknown, so the date of death is used to register the case so the case may be recorded against the wrong calendar year. A high DCO rate may also imply under-ascertainment, because patients are being missed by the registry while they are alive and not all cancer patients die of their disease (in which case, cancer is not mentioned on the death certificate). The target is for all registries across the UK and Ireland to have a DCO rate of less than 2% of all cancer registrations. Although the average DCO rate across the UK and Ireland for 2012 data was 1.1% for males and 1.3 % for females, comparable figures for England were 2.5% for males and 2.8% for females (UKIACR Annual Report, 2014 "UKIACR Annual Report, 2014"). However, on an international scale, these figures are still extremely good (Forman et al., 2013 "Forman et al., 2013").
Due to the additional workload experienced by some of the cancer registries, the date for registrations for those patients diagnosed with cancer during 2012 to be received by ONS was delayed by two months: all registrations were submitted to ONS by the end of February 2014, instead of the end of December 2013 as should have been the case.
The agreed procedures to be followed by the cancer registries and ONS, when submitting and processing data, are set out in the ‘Registry/ONS Interface Document’ (Office of Population Censuses and Surveys, 1994). These are summarised by three levels of quality status, where levels one and two can be included in tables. It is a requirement that when a registry’s data for a particular year are complete, no more than 0.5% of records should have a quality recorded as Status 3, and over the past 12 years the proportion of records with serious errors has consistently been 0.1% or less. The quality status of all the records on the ONS cancer registration database from 1971 up to 2012 is shown in Table 10 (1.66 Mb Excel sheet) of the reference tables associated with this publication. Further details about the cancer registration data can be found in the Cancer Registration Statistics Quality and Methodology Information paper and in previous Annual Reference Volumes.
Further comments on data quality and interpretation for this data can be found in the Background Notes and in the metadata with the tables accompanying this report.
Back to table of contents12. Users and uses of cancer statistics
Key users of cancer survival estimates include the Department of Health, academics and researchers, cancer charities, cancer registries, other government organisations, researchers within ONS, the media, and the general public. The Department of Health uses cancer statistics to brief parliamentary ministers, and as part of the evidence base to inform cancer policy and programmes, for example in drives to improve survival rates. Academics and researchers use the figures to inform their own research. Similarly cancer registries and other government organisations use the figures to carry out individual and collaborative projects to apply subject knowledge to practice. Charities use the data so they can provide reliable and accessible information about cancer to a wide range of groups, including patients and health professionals via health awareness campaigns and cancer information leaflets/web pages. Within the Office for National Statistics (ONS), cancer registration data are used to produce National Statistics on cancer incidence and survival. These data are also used to answer parliamentary questions and provide bespoke tables for customers.
Back to table of contents13. Policy context
In ‘Improving Outcomes: A Strategy for Cancer’ (January 2011), the Department of Health stated that although improvements have been made in the quality of cancer services in England, significant gaps remain in mortality and survival rates compared with the European average.
The Outcomes Strategy sets out how the Department of Health aims to improve outcomes for all cancer patients and improve cancer survival rates, with the aim of saving an additional 5,000 lives every year by 2014/15.
Outcomes strategies set out how the NHS, public health and social care services will contribute to the ambitions for progress agreed with the Secretary of State in each of the high-level outcomes frameworks. The indicators set for the NHS Outcomes Framework 2013 to 2014 – focus on measuring health outcomes include one- and five-year cancer survival indicators for all cancers combined, and for colorectal, breast and lung cancers combined.
Back to table of contents