Table of contents
- Main points
- Definitions
- Time trends for England and Wales
- Time trends for England
- Time trends for Wales
- Time trends in regions of England
- Background
- Limitations
- ICD-10 coding changes implemented in 2011
- Methodological changes affecting age-standardised rates
- Registration delays
- Uses and policy context
- Results on our website
- References
- Background notes
- Methodology
1. Main points
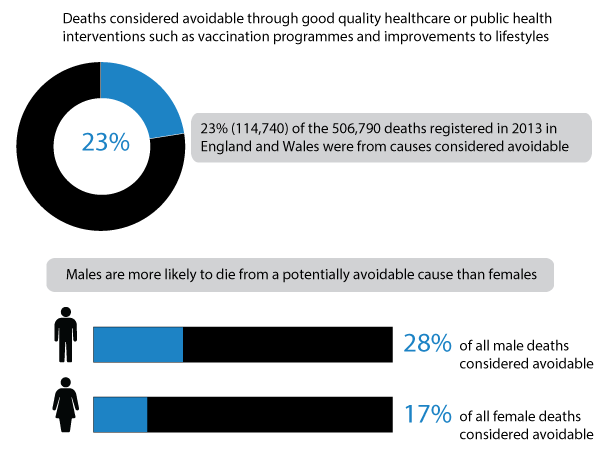
- In 2013, approximately 23% (114,740 out of 506,790) of all deaths registered in England and Wales were from causes considered avoidable through good quality healthcare or wider public health interventions
- In England and Wales, the majority (at least 60%) of potentially avoidable deaths in each year between 2001 and 2013 were among males
- Avoidable mortality rates for cardiovascular disease (disease of the heart or blood vessels) fell by 52% between 2001 and 2013, the greatest decrease by any broad cause group. This decrease meant that neoplasms (cancer and non-cancerous abnormal tissue growths), which fell by 17%, replaced cardiovascular disease in 2007 as the cause group responsible for the majority of avoidable deaths
- Breaking the causes into more detail, Ischaemic (coronary) heart disease was the most common individual cause of avoidable death for all persons, accounting for 17% (19,951 out of 114,740) of these deaths in 2013
- When the sexes were examined separately, Ischaemic heart disease was the most common cause of avoidable deaths for males, but for females it was lung cancer
- In 2013, Ischaemic heart disease accounted for 22% (15,078 out of 69,245) of avoidable male deaths, while lung cancer accounted for 15% (6,823 out of 45,495) of avoidable female deaths
- In both England and Wales, avoidable mortality rates were higher for males than females. While the gap between the sexes narrowed in England, it increased in Wales
- Avoidable mortality rates fell significantly in all regions between 2001 and 2013. The greatest decrease was in London, where rates for males and females fell by 38% and 36% respectively. The smallest decrease was in the South West, where rates for males and females fell by 27% and 23% respectively
2. Definitions
We present mortality figures for causes of death that are considered avoidable in the presence of timely and effective healthcare or public health interventions (avoidable mortality). Figures are presented for England and Wales and the regions of England for the period 2001 to 2013. While a particular condition can be considered to be avoidable, this doesn’t mean that every death from that condition could be prevented. This is because factors, such as the lifestyle and age of the patient, the extent of disease progression at diagnosis or the existence of other medical conditions, are not taken into account when making a list of causes.
For most of the causes of death included there is an upper age limit of 74 years. This is because deaths at older ages are often difficult to attribute definitively to a single underlying cause, and the chances of death are more affected by coexisting medical conditions and other factors. A full list of the causes of death included in the definition, ICD-10 codes and age limits are included in the reference tables.
We also present trends in mortality by causes considered preventable (preventable mortality) or amenable to healthcare (amenable mortality), which are subsets of total avoidable mortality.
Amenable mortality:
- a death is amenable (treatable) if, in the light of medical knowledge and technology at the time of death, all or most deaths from that cause (subject to age limits if appropriate) could be avoided through good quality healthcare
Preventable mortality:
- a death is preventable if, in the light of understanding of the determinants of health at time of death, all or most deaths from that cause (subject to age limits if appropriate) could be avoided by public health interventions in the broadest sense
Avoidable mortality:
- avoidable deaths are all those defined as preventable, amenable or both, where each death is counted only once; where a cause of death is both preventable and amenable, all deaths from that cause are counted in both categories when they are presented separately
We published a definition of avoidable mortality in 2011, following a period of consultation with statistics users, academics and experts. We received 20 responses to the consultation and a summary of these responses (174.8 Kb Pdf) was published on our website in August 2011. The final definition of avoidable mortality and the list of causes considered to be avoidable were published in the ‘Definition of Avoidable Mortality (306.9 Kb Pdf)’ document. This definition was used to produce an indicator of potentially avoidable deaths in England and Wales, and the first of a series of annual bulletins was published on 15 May 2012.
The list of causes considered avoidable, along with the associated age limits, will be reviewed every three years. This means that any cause of death which has been excluded from the current list due to concerns around the extent to which death can be avoided will be reassessed and may be included into future lists. We are now seeking your views to assist with this process. You can contribute to the consultation by answering the questions in the consultation document.
Figure 1: Number of deaths from causes considered avoidable as a proportion of all deaths
England and Wales, 2013

Download this image Figure 1: Number of deaths from causes considered avoidable as a proportion of all deaths
.png (28.1 kB)3. Time trends for England and Wales
In 2013, approximately 23% (114,740 out of 506,790) of all deaths registered in England and Wales could have been potentially avoided through good quality healthcare or wider public health interventions. This proportion has decreased since 2001, when records began, when it stood at 26% (140,820 out of 532,498 deaths).
Males are more likely to die from a potentially avoidable cause than females. At least 60% of all potentially avoidable deaths in each year between 2001 and 2013 were among males. In 2013, potentially avoidable deaths accounted for 28% of all male deaths, compared with 17% of all female deaths.
Figure 2: Age-standardised mortality rates for causes of death considered avoidable, amenable or preventable
England and Wales, 2001 to 2013
Notes:
- Avoidable deaths have fallen from 317 per 100,000 population in 2001 to 222 per 100,000 population in 2013
- Deaths are considered avoidable if the cause is amenable to healthcare (treatable) or could be prevented (preventable through public health interventions such as vaccination
- Not every death can be prevented because of lifestyle, age, extent of disease progression at diagnosis or the existence of other medical conditions
Download this chart Figure 2: Age-standardised mortality rates for causes of death considered avoidable, amenable or preventable
Image .csv .xlsThe age-standardised rate for deaths from potentially avoidable causes fell significantly from 317.3 deaths per 100,000 population in 2001, to 221.6 deaths per 100,000 population in 2013. However, while rates fell significantly in each year between 2001 and 2012, for the first time, there was no significant change in rates between 2012 and 2013.
Rates differed by sex and were significantly higher for males than females throughout the period 2001 to 2013. Males saw a 32% decrease in rates from 407.8 deaths per 100,000 males in 2001 to 278.3 deaths per 100,000 in 2013. Detailed analysis of the time trend for males showed that rates fell significantly in successive years between 2001 and 2012, but there was no significant change in rates between 2012 and 2013.
Avoidable mortality rates also fell for females, but at a slower pace than for males. For females, rates fell significantly by 28% from 234.9 to 168.8 per 100,000. However, within the period, there was no significant change in rates between successive years on 3 occasions, the most recent between 2012 and 2013.
Figure 3: Age-standardised avoidable mortality rates by sex
England and Wales, 2001 to 2013
Notes:
- The gap in avoidable mortality rates between males and females has narrowed since 2001
- Between 2001 and 2013 deaths from coronary (ischemic) heart disease fell for both males and females but the fall contributed more to the reduction in avoidable deaths for males. Also lung cancer deaths decreased for males but increased for females
Download this chart Figure 3: Age-standardised avoidable mortality rates by sex
Image .csv .xlsAge-standardised amenable mortality rates have fallen at a faster pace than preventable mortality rates. Amenable mortality rates fell by 43% from 180.9 per 100,000 population in 2001, to 103.7 per 100,000 in 2013. The decrease in preventable mortality rates was much smaller at 28%, from 257.5 to 185.6 per 100,000 population.
In keeping with the overall trend in avoidable mortality rates, there was no significant change in rates for both amenable and preventable causes between 2012 and 2013. Overall, Ischaemic heart disease was the most common individual cause of potentially avoidable deaths. Approximately 17% (19,951 of 114,740) of all potentially avoidable deaths were from this condition.
When both sexes were examined separately, Ischaemic heart disease was still the most common cause for males, but lung cancer was the most common for females. These conditions accounted for 22% and 15% of all potentially avoidable deaths among males and females respectively. When cause groups were examined in 2013, neoplasms were the most common cause of avoidable deaths, but this was not always the case. Between 2001 and 2006, cardiovascular disease was the most common cause of avoidable deaths. In 2001, cardiovascular disease was responsible for 55,874 potentially avoidable deaths, compared with 41,971 from neoplasms. Similarly, the age-standardised rate for avoidable deaths from cardiovascular disease was 35% higher than that of neoplasms (129.2 per 100,000 population compared with 95.6 per 100,000 respectively).
The death rates for both cause groups have since fallen but at different rates, resulting in neoplasms replacing cardiovascular disease as the most common cause of avoidable deaths in 2007. The decline in cardiovascular disease has been so rapid that by 2013, the rate for this cause group was 23% lower than that of neoplasms (61.5 per 100,000 compared with 79.5 per 100,000 respectively).
Since 2001, rates for avoidable deaths from cardiovascular disease have fallen by 52%, the greatest decrease in any cause group. Consequently, the decrease in the overall avoidable mortality rate is largely driven by this. Conversely, the rate for neoplasms only fell by 17%.
Figure 4: Age-standardised avoidable mortality rates by broad cause groups
England and Wales, 2001-2013
Source: Office for National Statistics
Notes:
- Since 2007 neoplasms have been the most common cause of avoidable deaths followed by cardiovascular disease. Increased uptake in exercise, a fall in smoking and medical improvement have contributed to the fall in cardiovascular disease
- There has been little change in the rates of avoidable deaths from injuries, respiratory diseases, drug use disorders and infection since 2001
Download this chart Figure 4: Age-standardised avoidable mortality rates by broad cause groups
Image .csv .xlsThe trends in overall avoidable mortality rates and by cause group are largely similar irrespective of the indicators used. Both age-standardised rates and standardised years of life lost (SYLL) decreased between 2001 and 2013.
For males, 7,641 potential years of life per 100,000 males were lost to avoidable deaths in 2001. By 2013, the number of potential years of life lost had fallen to 5,967 per 100,000 males. For females, the comparable years of life lost were 4,960 per 100,000 females in 2001 and 3,921 per 100,000 females in 2013.
When the broad cause groups were ranked according to SYLL in 2013, cardiovascular disease was responsible for the majority of life years lost for males (1,748 years per 100,000 population), but it was neoplasms for females (1,700 years per 100,000 population).
Back to table of contents4. Time trends for England
The number of potentially avoidable deaths in England fell from 131,004 in 2001 to 106,537 in 2013. Similarly, the number of avoidable deaths as a proportion of all deaths fell from 26% to 22% over the period.
The avoidable mortality rate for all persons fell by 30%, from 313.8 per 100,000 population in 2001 to 218.7 per 100,000 in 2013. Since 2001 rates for all persons have decreased significantly in each year up to 2012, but remained stable for the first time between 2012 and 2013.
A similar trend was observed in both sexes, but the decline in rates was sharper for males (Tables 1 and 2). Rates were consistently higher for males than females, but the gap is narrowing because of a sharper decline for males. In 2001, the avoidable mortality rate for males was 74% higher than that of females (403.6 deaths per 100,000 males compared with 232.0 deaths per 100,000 females). By 2013, the difference in rates had fallen to 65% (274.5 deaths per 100,000 males compared with 166.7 deaths per 100,000 females).
In 2013, the most common cause of avoidable deaths in England was neoplasms, but it used to be cardiovascular disease up until 2006. Studies have attributed the decline in deaths from cardiovascular disease to advancements in medicine, as well as lifestyle and behavioural modifications. Bajekal et al (2012) found that medical and surgical treatments were responsible for about half of the decline in deaths from coronary heart disease (a sub-group of cardiovascular diseases), between 2000 and 2007 in England. A further third of this decline was attributed to changes in lifestyle and behavioural risk factors, such as smoking and physical activity. However, the study also found that the benefits of improvements in blood pressure, cholesterol levels, smoking prevalence and physical activity were partly negated by increases in body mass index and diabetes.
Avoidable mortality rates in England fell significantly between 2001 and 2013 for all cause groups, despite annual fluctuations within the period.
Figure 5: Age-standardised avoidable mortality rates by country and sex
England and Wales (separately), 2001-2013
Notes:
- Avoidable mortality rates are higher in Wales than in England
Download this chart Figure 5: Age-standardised avoidable mortality rates by country and sex
Image .csv .xls5. Time trends for Wales
The number of avoidable deaths in Wales has fallen since 2001. The number of deaths fell from 9,037 in 2001 to 7,601 in 2013. Avoidable deaths as a proportion of all deaths also fell, from 27% to 24% respectively.
Overall, avoidable mortality rates for all persons fell significantly from 345.9 per 100,000 population in 2001 to 249.4 per 100,000 in 2013, although changes between successive years were not always significant. A similar trend was observed when the sexes were examined separately. However, unlike in England, the decrease in rates was slightly greater for females than males. Rates fell by 29%, from 263.7 to 187.2 per 100,000, for females and by 27%, from 435.1 to 316.2 per 100,000 for males, with the gap between the sexes increasing over time.
The trends in avoidable mortality from cardiovascular disease and neoplasms in Wales were similar to those for England. Mortality rates for both cause groups fell significantly between 2001 and 2013, but more so for cardiovascular disease. Neoplasms replaced cardiovascular disease as the most common cause of avoidable deaths in 2007. For the remaining cause groups, 2013 rates were similar to those observed in 2001, despite significant changes between some years within the period.
Avoidable mortality rates were significantly higher in Wales than in England throughout the period 2001 to 2013. Overall the decrease in rates between 2001 and 2013 was slightly greater in England than Wales (30% compared with 28% respectively).
Back to table of contents6. Time trends in regions of England
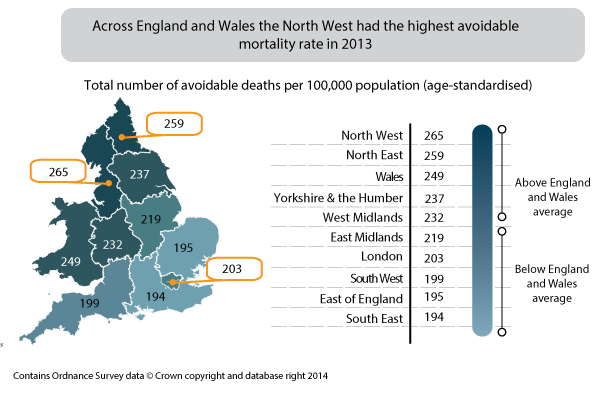
Avoidable mortality rates varied across the regions of England but tended to be highest in the north of England and lowest in the south and the East of England.
For males, 2013 rates were highest in the North West (325.8 per 100,000) and lowest in the East of England (241.0 per 100,000). For females, rates were also highest in the North West (206.6 per 100,000), but lowest in the south east (146.5 per 100,000).
Avoidable mortality rates fell significantly in all regions in England between 2001 and 2013. The greatest decrease was in London, where rates for males and females fell by 38% and 36% respectively. In contrast, the smallest decrease was in the South West, where rates for males and females fell by 27% and 23% respectively.
The gap between the regions with the highest and lowest rates narrowed between 2001 and 2013. However, it must be noted that regions were not necessarily similarly ranked in each year.
For all persons, avoidable mortality rates in 2013 were highest in the North West (264.6 per 100,000) and lowest in the South East (193.9 per 100,000) of England.
Figure 6: Age-standardised avoidable mortality rates for all persons by English region and Wales
Regions of England and Wales, 2013
Download this image Figure 6: Age-standardised avoidable mortality rates for all persons by English region and Wales
.png (48.7 kB)Data tables - Males
Table 1: Male avoidable mortality rates: by country and region of England, 2001-2013
| Rate per 100,000 population | |||||||||||||
| Country/region | 2001 | 2002 | 2003 | 2004 | 2005 | 2006 | 2007 | 2008 | 2009 | 2010 | 2011 | 2012 | 2013 |
| England and Wales | 407.8 | 394.2 | 383.9 | 363.2 | 352.1 | 337.7 | 327.2 | 320.8 | 308.7 | 298.7 | 286.1 | 276.0 | 278.3 |
| England | 403.6 | 389.9 | 379.8 | 359.5 | 348.4 | 334.0 | 322.9 | 317.0 | 304.6 | 295.5 | 282.8 | 272.6 | 274.5 |
| North East | 492.7 | 476.0 | 461.6 | 446.3 | 422.8 | 400.7 | 379.3 | 384.8 | 359.1 | 341.8 | 344.1 | 323.4 | 317.1 |
| North West | 483.0 | 461.0 | 452.2 | 429.2 | 418.2 | 400.3 | 387.3 | 382.7 | 371.5 | 356.0 | 340.6 | 327.3 | 325.8 |
| Yorkshire and The Humber | 428.1 | 418.2 | 394.9 | 380.6 | 370.1 | 355.7 | 343.3 | 341.8 | 324.7 | 314.6 | 312.0 | 298.0 | 294.2 |
| East Midlands | 393.8 | 388.1 | 383.0 | 350.2 | 344.1 | 318.8 | 320.4 | 315.6 | 304.7 | 298.6 | 283.8 | 269.5 | 278.0 |
| West Midlands | 429.9 | 412.7 | 408.1 | 385.0 | 375.1 | 360.9 | 347.2 | 340.7 | 321.4 | 308.8 | 295.2 | 284.8 | 295.4 |
| East | 344.7 | 335.7 | 322.2 | 308.8 | 300.2 | 288.6 | 280.9 | 270.9 | 261.3 | 260.7 | 244.5 | 235.8 | 241.0 |
| London | 420.7 | 404.7 | 398.8 | 374.8 | 354.5 | 344.6 | 326.9 | 319.1 | 302.5 | 292.4 | 274.2 | 276.7 | 260.2 |
| South East | 351.3 | 337.4 | 330.3 | 310.5 | 299.6 | 290.4 | 279.4 | 270.0 | 269.4 | 261.1 | 245.4 | 239.0 | 245.6 |
| South West | 344.0 | 332.9 | 322.0 | 307.4 | 302.9 | 291.7 | 284.2 | 280.3 | 269.6 | 262.2 | 254.3 | 242.6 | 252.4 |
| Wales | 435.1 | 429.3 | 417.1 | 388.1 | 381.3 | 366.7 | 366.2 | 347.6 | 346.1 | 326.5 | 315.8 | 308.2 | 316.2 |
| Source: Office for National Statistics | |||||||||||||
| Notes: | |||||||||||||
| 1. Figures are for deaths registered in the calendar year | |||||||||||||
| 2. See reference table 1 for details of the causes of death included and age-limits used for avoidable causes | |||||||||||||
| 3. Rates per 100,000 population, standardised to the 2013 European Standard Population | |||||||||||||
| 4. Deaths of non-residents are included in figures for England and Wales combined but are excluded in figures for England, Wales and regions | |||||||||||||
Download this table Table 1: Male avoidable mortality rates: by country and region of England, 2001-2013
.xls (30.7 kB)
Table 2: Number of male avoidable deaths: by country and region of England, 2001-20131,2,3
| Deaths | |||||||||||||
| Country/region | 2001 | 2002 | 2003 | 2004 | 2005 | 2006 | 2007 | 2008 | 2009 | 2010 | 2011 | 2012 | 2013 |
| England and Wales | 85,888 | 83,999 | 82,640 | 79,042 | 77,502 | 75,152 | 74,004 | 73,899 | 72,353 | 71,042 | 68,839 | 67,548 | 69,245 |
| England | 79,962 | 78,167 | 76,890 | 73,565 | 72,112 | 69,881 | 68,632 | 68,670 | 67,116 | 66,078 | 63,978 | 62,756 | 64,243 |
| North East | 5,239 | 5,100 | 4,972 | 4,852 | 4,618 | 4,402 | 4,232 | 4,334 | 4,082 | 3,948 | 4,002 | 3,828 | 3,801 |
| North West | 13,287 | 12,816 | 12,669 | 12,177 | 12,016 | 11,591 | 11,383 | 11,422 | 11,207 | 10,919 | 10,558 | 10,290 | 10,361 |
| Yorkshire and The Humber | 8,629 | 8,520 | 8,175 | 7,946 | 7,862 | 7,629 | 7,515 | 7,581 | 7,303 | 7,165 | 7,161 | 6,960 | 6,949 |
| East Midlands | 6,785 | 6,821 | 6,819 | 6,332 | 6,282 | 5,950 | 6,057 | 6,123 | 6,025 | 6,005 | 5,778 | 5,575 | 5,859 |
| West Midlands | 9,270 | 9,008 | 8,991 | 8,566 | 8,413 | 8,182 | 7,992 | 7,970 | 7,655 | 7,468 | 7,198 | 7,072 | 7,421 |
| East | 7,730 | 7,631 | 7,425 | 7,206 | 7,089 | 6,891 | 6,841 | 6,749 | 6,629 | 6,680 | 6,355 | 6,242 | 6,516 |
| London | 10,180 | 9,903 | 9,754 | 9,139 | 8,732 | 8,537 | 8,156 | 8,149 | 7,806 | 7,721 | 7,293 | 7,412 | 7,134 |
| South East | 11,362 | 11,047 | 10,935 | 10,423 | 10,196 | 9,997 | 9,784 | 9,641 | 9,847 | 9,684 | 9,259 | 9,176 | 9,622 |
| South West | 7,480 | 7321 | 7,150 | 6,924 | 6,904 | 6,702 | 6,672 | 6,701 | 6,562 | 6,488 | 6,374 | 6,201 | 6,580 |
| Wales | 5,387 | 5,382 | 5,307 | 4,987 | 4,974 | 4,843 | 4,928 | 4,749 | 4,827 | 4,602 | 4,496 | 4,448 | 4,622 |
| Source: Office for National Statistics | |||||||||||||
| Notes: | |||||||||||||
| 1. Figures are for deaths registered in the calendar year | |||||||||||||
| 2. See reference table 1 for details of the causes of death included and age-limits used for avoidable causes | |||||||||||||
| 3. Deaths of non-residents are included in figures for England and Wales combined but are excluded in figures for England, Wales and regions | |||||||||||||
| 4. Deaths of non-residents are included in figures for England and Wales combined but are excluded in figures for England, Wales and regions | |||||||||||||
Download this table Table 2: Number of male avoidable deaths: by country and region of England, 2001-20131,2,3
.xls (57.9 kB)Data tables - Females
Table 3: Female avoidable mortality rates: by country and region of England, 2001-2013
| Rate per 100,000 population | |||||||||||||
| Country/region | 2001 | 2002 | 2003 | 2004 | 2005 | 2006 | 2007 | 2008 | 2009 | 2010 | 2011 | 2012 | 2013 |
| England and Wales | 234.9 | 226.6 | 223.6 | 212.5 | 206.6 | 200.5 | 195.2 | 194.3 | 183.0 | 179.3 | 173.1 | 169.7 | 168.8 |
| England | 232.0 | 223.8 | 221.3 | 210.3 | 204.4 | 198.4 | 192.5 | 191.7 | 181.0 | 177.2 | 171.1 | 167.5 | 166.7 |
| North East | 283.8 | 273.1 | 270.5 | 261.3 | 247.0 | 246.7 | 233.0 | 232.2 | 219.4 | 212.0 | 216.2 | 206.9 | 204.3 |
| North West | 282.7 | 268.5 | 263.8 | 250.7 | 244.7 | 238.3 | 236.7 | 238.8 | 224.6 | 220.8 | 211.5 | 208.9 | 206.6 |
| Yorkshire and The Humber | 244.6 | 235.8 | 231.0 | 219.3 | 218.7 | 210.8 | 208.8 | 205.4 | 194.5 | 191.5 | 189.2 | 178.6 | 182.3 |
| East Midlands | 233.5 | 231.3 | 225.4 | 215.2 | 208.0 | 199.5 | 196.3 | 196.9 | 186.0 | 171.7 | 170.3 | 171.1 | 162.8 |
| West Midlands | 235.4 | 228.2 | 226.8 | 217.9 | 212.5 | 210.6 | 199.8 | 201.2 | 188.4 | 185.2 | 175.8 | 173.4 | 172.5 |
| East | 202.3 | 196.1 | 193.0 | 183.4 | 178.7 | 175.7 | 168.6 | 170.8 | 157.9 | 157.0 | 150.7 | 151.3 | 151.8 |
| London | 238.0 | 221.6 | 224.6 | 211.6 | 200.0 | 187.9 | 182.5 | 180.7 | 168.6 | 169.0 | 157.9 | 155.5 | 151.9 |
| South East | 201.2 | 196.6 | 195.2 | 184.9 | 180.4 | 177.9 | 169.9 | 165.8 | 157.8 | 155.3 | 149.6 | 145.3 | 146.5 |
| South West | 195.1 | 191.6 | 190.3 | 179.6 | 176.9 | 167.6 | 162.3 | 162.1 | 159.5 | 154.2 | 149.5 | 145.2 | 149.6 |
| Wales | 263.7 | 254.7 | 244.7 | 232.7 | 227.8 | 218.5 | 223.2 | 219.8 | 201.2 | 200.4 | 193.7 | 193.9 | 187.2 |
| Source: Office for National Statistics | |||||||||||||
| Notes: | |||||||||||||
| 1. Figures are for deaths registered in the calendar year | |||||||||||||
| 2. See reference table 1 for details of the causes of death included and age-limits used for avoidable causes | |||||||||||||
| 3. Rates per 100,000 population, standardised to the 2013 European Standard Population | |||||||||||||
| 4. Deaths of non-residents are included in figures for England and Wales combined but are excluded in figures for England, Wales and regions | |||||||||||||
Download this table Table 3: Female avoidable mortality rates: by country and region of England, 2001-2013
.xls (31.2 kB)
Table 4: Number of female avoidable deaths: by country and region of England, 2001-2013
| Deaths | |||||||||||||
| Country/region | 2001 | 2002 | 2003 | 2004 | 2005 | 2006 | 2007 | 2008 | 2009 | 2010 | 2011 | 2012 | 2013 |
| England and Wales | 54,932 | 53,296 | 53,084 | 50,832 | 49,830 | 48,682 | 47,970 | 48,543 | 46,450 | 46,095 | 45,071 | 44,945 | 45,495 |
| England | 51,042 | 49,520 | 49,422 | 47,327 | 46,372 | 45,301 | 44,499 | 45,043 | 43,214 | 42,855 | 41,911 | 41,723 | 42,294 |
| North East | 3,392 | 3,272 | 3,257 | 3,163 | 2,990 | 2,990 | 2,846 | 2,869 | 2,745 | 2,682 | 2,759 | 2,667 | 2,656 |
| North West | 8,730 | 8,304 | 8,219 | 7,853 | 7,699 | 7,523 | 7,539 | 7,696 | 7,336 | 7,274 | 7,047 | 7,057 | 7,062 |
| Yorkshire and The Humber | 5,492 | 5,328 | 5,273 | 5,045 | 5,057 | 4,902 | 4,919 | 4,899 | 4,707 | 4,682 | 4,669 | 4,453 | 4,618 |
| East Midlands | 4,415 | 4,416 | 4,357 | 4,208 | 4,117 | 3,985 | 3,980 | 4,081 | 3,923 | 3,677 | 3,706 | 3,787 | 3,673 |
| West Midlands | 5,606 | 5,458 | 5,478 | 5,299 | 5,207 | 5,192 | 4,974 | 5,094 | 4,851 | 4,818 | 4,633 | 4,611 | 4,667 |
| East | 4,985 | 4,883 | 4,883 | 4,685 | 4,630 | 4,588 | 4,470 | 4,602 | 4,335 | 4,367 | 4,250 | 4,365 | 4,468 |
| London | 6,367 | 5,964 | 6,031 | 5,714 | 5,427 | 5,085 | 5,003 | 5,020 | 4,753 | 4,857 | 4,570 | 4,596 | 4,568 |
| South East | 7,309 | 7,195 | 7,214 | 6,861 | 6,782 | 6,764 | 6,568 | 6,510 | 6,312 | 6,314 | 6,173 | 6,123 | 6,297 |
| South West | 4,746 | 4,700 | 4,710 | 4,499 | 4,463 | 4,272 | 4,200 | 4,272 | 4,252 | 4,184 | 4,104 | 4,064 | 4,285 |
| Wales | 3,650 | 3,550 | 3,440 | 3,308 | 3,260 | 3,164 | 3,269 | 3,279 | 3,031 | 3,055 | 2,974 | 3,038 | 2,979 |
| Source: Office for National Statistics | |||||||||||||
| Notes: | |||||||||||||
| 1. Figures are for deaths registered in the calendar year | |||||||||||||
| 2. See reference table 1 for details of the causes of death included and age-limits used for avoidable causes | |||||||||||||
| 3. Deaths of non-residents are included in figures for England and Wales combined but are excluded in figures for England, Wales and regions | |||||||||||||
Download this table Table 4: Number of female avoidable deaths: by country and region of England, 2001-2013
.xls (57.3 kB)7. Background
It is widely accepted that the contribution of healthcare to improvements in population health ought to be quantified. Avoidable mortality, which is based on the concept that premature deaths from certain conditions should be rare, and ideally should not occur in the presence of timely and effective healthcare, is used as an indicator to measure this contribution.
Although avoidable mortality has been researched for the last 3 decades, there is little consensus among researchers about how to define it. According to Kossarova et al., (2009), the concept of “avoidability” dates back to the early twentieth century, where confidential enquiries were made into maternal deaths in an attempt to identify improvements.
The concept of avoidable mortality was first introduced by Rutstein et al. in the 1970s. Rutstein argued that in order to develop effective indicators of healthcare a number of disease lists should be drawn up, which should not, or should only infrequently, give rise to death or disability (Rutstein et al., 1976). Subsequently, several papers have reported on regional variation from conditions avoidable with medical intervention.
Rutstein also noted that the list of conditions considered to be avoidable would need to be updated in light of improvements in medical knowledge and practice, as well as social and environmental changes. As a result, their original lists were revised in 1980 to take these and the move to the Ninth Revision of the International Classification of Diseases (ICD-9) into account.
In England and Wales, Charlton et al., (1983) were the first to examine avoidable mortality. They investigated the geographic variations in mortality between 1974 and 1978 using 14 amenable causes of death selected from Rutstein’s list. As with several researchers after them, they excluded conditions such as lung cancer, whose avoidance was considered to be outside the scope of medical care. They found that even after adjusting for social factors, substantial variations in avoidable deaths remained and they urged future studies to examine this further in relation to health-service inputs.
Following Charlton’s work, an attempt was made to compile an atlas on avoidable mortality in the European Community (EC).The conditions included in this atlas were meant to provide warning signals of potential shortcomings in healthcare delivery. It also provided conditions for which a proportion of deaths can be prevented (Holland, 1997, cited by Kossarova et al., (2009).
The atlas also provided a basis for the more recent concept of avoidable mortality, which differentiates between conditions amenable to healthcare (treatable) and those preventable through wider public health policies. Some of the more recent lists of avoidable causes of death include those produced by Nolte and McKee (2004) and Page et al.,(2006). These lists were used by us as the basis for the definition of avoidable mortality. They have been amended and updated to make them more relevant to the UK and to reflect recent developments in health public policy.
Back to table of contents8. Limitations
One of the main difficulties in producing an indicator of avoidable mortality is the selection of the causes of death for inclusion. While a particular condition can be considered to be avoidable, this doesn’t mean that every death from that condition could be prevented. This is because factors such as the age of the patient, the extent of disease progression at diagnosis or the existence of other medical conditions are not taken into account when compiling a list of causes.
Several studies have shown that deaths from causes amenable to healthcare are declining at a much faster rate than those from non-amenable causes, and that this decline has coincided with the introduction of specific improvements in healthcare. According to Nolte and McKee (2004) these studies are largely focused on quantitative measures, such as healthcare expenditure and the number of healthcare professionals, not necessarily measures of the quality of healthcare systems. They therefore argued that the lack of demonstrable association between avoidable mortality and healthcare resources is, in fact, not entirely surprising. Furthermore, there is likely to be a substantial time lag between change in resources, the introduction of a healthcare innovation or public health policy and a corresponding reduction in mortality. As a result, improvements in the healthcare system may not necessarily be evident from mortality figures in the short or medium term.
In a review of published work on amenable mortality, Mackenbach et al., (1990) noted that geographical variations were strongly linked to socioeconomic factors, which may reflect the differences in timely access to healthcare. Geographical variations may also simply be a result of random variations in disease incidence. For example, if there was a sudden increase in the incidence of a particular condition, and consequently an increase in the mortality rate for this condition, this might be mistakenly interpreted as a decrease in the quality of healthcare.
Note that avoidable mortality was not intended to serve as a definitive source of evidence of differences in effectiveness of healthcare systems. It was designed to highlight areas of potential weaknesses in healthcare that could benefit from further in-depth investigation (Nolte and McKee, 2004). Therefore, the statistics provided in this bulletin should help in assessing the quality and performance of healthcare, as well as wider public health policies. However, due to the limitations described, a degree of caution is required when interpreting the data.
Back to table of contents9. ICD-10 coding changes implemented in 2011
In 2011 we updated the software used for cause of death coding from ICD-10 version 2001.2, to version 2010. Following this we carried out a bridge study to help users understand the likely impact of this change on mortality statistics for England and Wales. The main changes in the ICD-10 version 2010 are amendments to the rules used in selecting the underlying cause of death. Overall, the impact of these changes is small, although some cause groups are affected more than others.
Many of the conditions affected by the software version change are not included in the avoidable mortality definition. In the majority of cases where conditions are affected, deaths previously coded to one condition are now coded to another condition also listed in causes of avoidable deaths. Therefore, the coding change will have had little impact on the summary avoidable mortality figures published since 2011. For example, analysis presented in the 2011 drug-related deaths bulletin showed that the number of deaths coded as illicit drug use disorders (ICD-10 codes F11–F16 and F18–F19) decreased by 84% per cent in v2010, compared with v2001.2. However, these deaths were allocated to accidental poisonings by drugs (ICD-10 code X40–X44), which is also a cause of avoidable deaths. The impact of coding changes may be more pronounced for cause groups.
Back to table of contents10. Methodological changes affecting age-standardised rates
The 2013 avoidable mortality indicators presented in this bulletin are based on the 2013 European Standard Population (ESP) introduced across our mortality outputs in 2014. Previously published indicators for 2001 to 2012, produced using the 1976 ESP, have been revised and published alongside data for 2013.
The difference between death rates based on the old and new ESP is purely methodological and doesn’t indicate an actual increase in previously published numbers of deaths or death rates. Further information on the change in ESP is available in our report examining the impact of the change in ESP on mortality data.
In future we intend to publish all age-standardised rates using the full 2013 ESP (with an upper age limit of 95+). However, until official population denominators are available for the oldest age group in the 2013 ESP, crude rates will continue to be standardised using the ‘abridged’ 2013 ESP, with an upper age limit of 90+. Our report found no significant difference between rates based on the upper age limits of 90+ and 95+.
Methods
Age-standardised rates were calculated using the number of potentially avoidable deaths registered in each year as the numerator and the mid-year population estimate for that year as the denominator. These rates were calculated for all avoidable, preventable and amenable deaths, as well as cause groups within these categories. Although age limits were set for some cause groups, rates were calculated using persons of all ages as the denominator. This method was adopted as the entire population is at risk of mortality due to causes considered to be avoidable at an aggregate level and also to allow data by cause group, amenable and preventable categories to be presented on a comparable basis.
Potential years of life lost (PYLL) is a measure of the potential number of years lost when a person dies prematurely from any cause. The basic concept underpinning PYLL is that deaths at younger ages are weighted more heavily than those at older ages. The advantage in doing this is that deaths at younger ages may be perceived to be of less importance if cause specific death rates alone were used to highlight the burden of disease and injury, as conditions such as cancer and heart disease often occur at older ages and have relatively high mortality rates.
In this bulletin, PYLLs are standardised using the 2013 ESP and referred to as standardised years of life lost (SYLL) for clarity. These rates represent the potential years of life lost if the population of England and Wales had the same population structure as the 2013 ESP. SYLL rates are presented as years of life lost per 100,000 population.
Formula for calculating SYLL
PYLL is calculated as the sum of the mortality rate in each age group, weighted by the potential number of years of life lost as indicated by the remaining period life expectancy for each age group. To calculate the SYLL, this is then standardised using the 2013 ESP.
Notes:
- Where:
i is the age group (<1, 1-4, 5-9, 10-14….85-89, 90+)
di is the number of deaths in age group i
ai is the weight, or average age-specific period life expectancy in age group i for a given year
ni is the population in age group i
wi is the number of individuals in the standard population in age group i
Modifications to standard error and confidence interval calculations
The mortality data in this release are not subject to sampling variation, as they were not drawn from a sample. Nevertheless, they may be affected by random variation, particularly where the number of deaths or probability of dying is small. To help assess the variability in the rates, they have been presented alongside 95% confidence intervals (CI’s).
Traditionally, an approximation method is used to calculate the variance of age-standardised rates. The age-standardised is a weighted sum of the age-specific death rates where the age-specific weights represent the relative age distribution of the ESP. Therefore, its variance is now calculated as the weighted sum of those age-specific variances.
Traditionally, a normal approximation method is used to calculate confidence intervals on the assumption that the underlying deaths-data rates are based on are normally distributed. However, in some instances, for example in Wales, the annual number of avoidable deaths in certain cause groups may be relatively small (fewer than 100), and may be assumed to follow a Poisson probability distribution. In such cases, it is more appropriate to use the confidence limit factors from a Poisson distribution table to calculate the confidence intervals, instead of a normal approximation method.
The method used in calculating confidence intervals for age-standardised rates based on fewer than 100 deaths was proposed by Dobson et al., (1991), as described in APHO, (2008). A normal approximation method was used to calculate 95% CI’s, where there were 100 or more deaths in a year.
Full details of all the methodological changes are available in the avoidable mortality quality and methodology information notes (211.2 Kb Pdf).
Back to table of contents11. Registration delays
The information used to produce mortality statistics is based on the details collected when deaths are certified and registered. In England and Wales deaths should be registered within 5 days of the death occurring, but there are some situations that result in the registration of the death being delayed. Deaths considered unexpected, accidental or suspicious will be referred to a coroner who may order a post mortem and/or carry out a full inquest to ascertain the reasons for the death.
Avoidable mortality statistics are presented based on the number of deaths registered in each calendar year, rather than deaths occurring in that year. This method is used due to the requirement for consistent and timely data, despite the potential limitation of data quality caused by registration delays.
In 2013 97% of avoidable deaths that were registered in 2013 also occurred in 2013.
In 2013, there were fewer avoidable, amenable and preventable deaths registered within 5 days than deaths from all causes. Approximately 59% of all avoidable deaths, 64% of amenable deaths and 58% of preventable deaths were registered within 5 days, whereas 73% of all causes were registered within 5 days. The average (median) time taken to register avoidable deaths in 2013 was 5 days, a day longer than all causes of death.
Table 5: Registration period for avoidable deaths and all-cause mortality, England and Wales, deaths registered in 2013
| Cause | Deaths registered in 2013 | Proportion of deaths registered | |||||
| Within 5 days | Six days to one month (6-30 days) | One to three months (31 - 91 days) | Three to six months (92 - 183 days) | Six months to one year (184 - 365 days) | Over 1 year (over 365 days) | ||
| Avoidable | 114,740 | 58.8% | 22.4% | 4.1% | 6.5% | 5.7% | 2.4% |
| Amenable | 53,463 | 63.6% | 29.1% | 2.4% | 2.3% | 1.7% | 0.9% |
| Preventable | 96,072 | 57.8% | 21.6% | 4.3% | 7.2% | 6.4% | 2.6% |
| All-cause | 506,790 | 73.2% | 20.5% | 1.6% | 2.2% | 1.8% | 0.8% |
| Source: Office for National Statistics | |||||||
| Notes: | |||||||
| 1. All cause mortality was extracted based on the underlying cause of death, defined using the International Classification of Diseases, tenth revision (ICD-10) | |||||||
| 2. Figures include deaths of non-residents | |||||||
| 3. Deaths where the day and/or month of death are missing have been excluded | |||||||
Download this table Table 5: Registration period for avoidable deaths and all-cause mortality, England and Wales, deaths registered in 2013
.xls (30.2 kB)12. Uses and policy context
Statistics on avoidable mortality are used by central government, public health observatories, academia and charitable organisations working to reduce the prevalence of specific diseases and conditions deemed to be avoidable causes of death.
One of the main expected uses of these statistics is the monitoring of the quality performance of healthcare and public health policies. The Department of Health uses PYLL from causes considered amenable to healthcare for children and young population in its NHS Outcomes Framework 2015/16 (Department of Health, 2015) and mortality from preventable causes as an indicator in its Public Health Outcomes Framework to reduce preventable ill health, population dying prematurely and to reduce the gap between communities (Department of Health, 2014).
There has been considerable local and international interest in the development of statistics on avoidable mortality in the last 2 decades. In the UK, charitable organisations such as the Hepatitis C Trust, the British Lung Foundation and the British Association for the Study of Liver (BASL) are keen to see the conditions or diseases they campaign about included in the list of causes of death considered avoidable. It is thought that if these conditions were included on the cause list it would draw increased attention towards them and allow comparisons of trends to be made against other conditions.
At an international level, the European Union funded project ‘Avoidable mortality in the European Union: Towards better indicators for the effectiveness of health systems’ (AMIEHS, 2011) aims to develop a list of indicators (causes of death) for which mortality rates are likely to reflect variations in the effectiveness of healthcare, as defined by primary care, hospital care and personalised health services. To date, the project has developed an atlas containing trends in mortality for 45 possible amenable causes. Similarly, the Office for Economic Co-operation and Development (OECD) published a working paper in 2011, ‘Mortality amenable to healthcare in 31 OECD countries: estimates and methodological issues’. The study assessed the feasibility of using amenable mortality as an indicator of the performance of healthcare systems in OECD countries, concluding that there is lots of potential for cross-country comparisons of healthcare effectiveness.
Back to table of contents13. Results on our website
Avoidable mortality figures for England and Wales combined, England, Wales and the regions of England are available on our website.
The workbooks contain results for England and Wales (combined and separately):
age-standardised rates per 100,000 population (with 95% confidence intervals), standardised years of life lost and the numbers of deaths for causes considered avoidable, amenable and preventable for the period 2001 to 2013 – data are available by cause group: infections; neoplasms; drug use disorders; cardiovascular diseases; respiratory diseases; injuries; and other conditions
the chances of eventually dying from avoidable causes based on the assumption that future mortality rates remain the same as those experienced in 2013
age-standardised rates per 100,000 population (with 95% confidence intervals) and the numbers of deaths for causes considered avoidable, amenable and preventable for the period 2001 to 2013 – data are for the regions of England, males, females and all persons
underlying dataset containing the number of deaths for each avoidable mortality cause group, broken down by sex and five-year age groups